. 2013 Sep 19;39(3):560-72.
doi: 10.1016/j.immuni.2013.08.005. Epub 2013 Aug 29.

Extrathymic Aire-expressing cells are a distinct bone marrow-derived population that induce functional inactivation of CD4⁺ T cells

Affiliations

Extrathymic Aire-expressing cells are a distinct bone marrow-derived population that induce functional inactivation of CD4⁺ T cells

James M Gardner et al. Immunity. .

Abstract

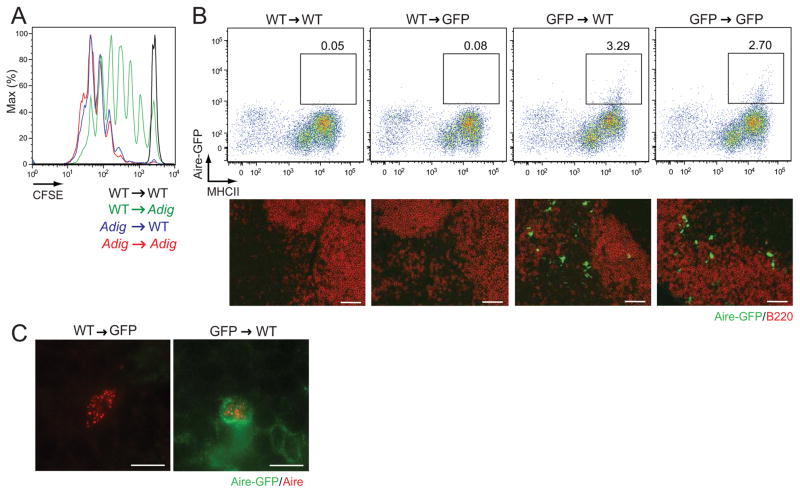
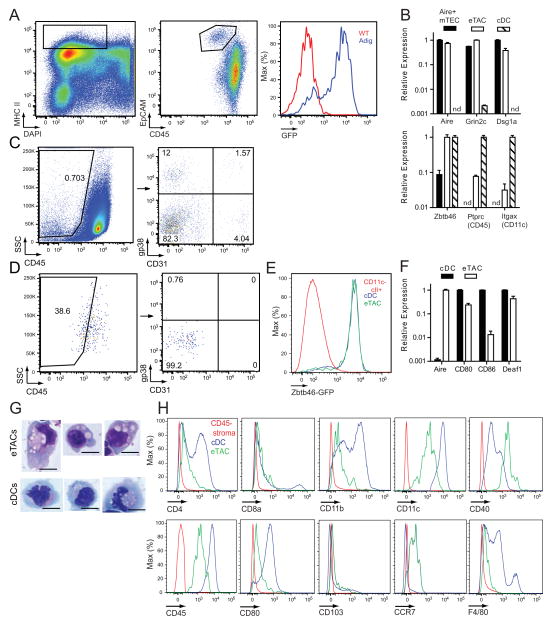
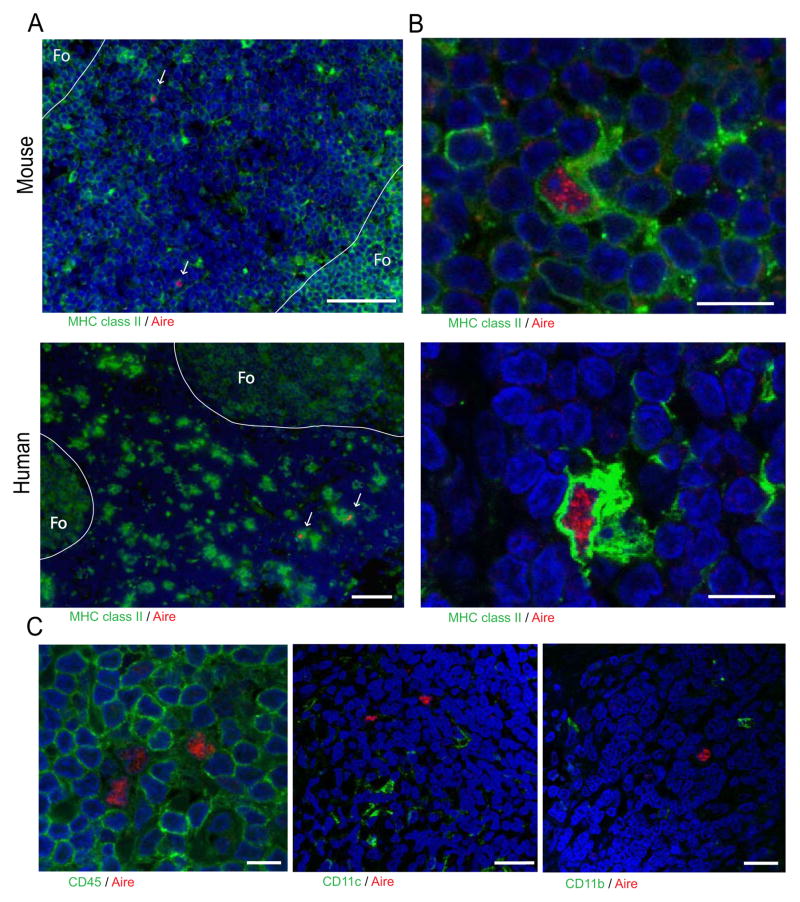
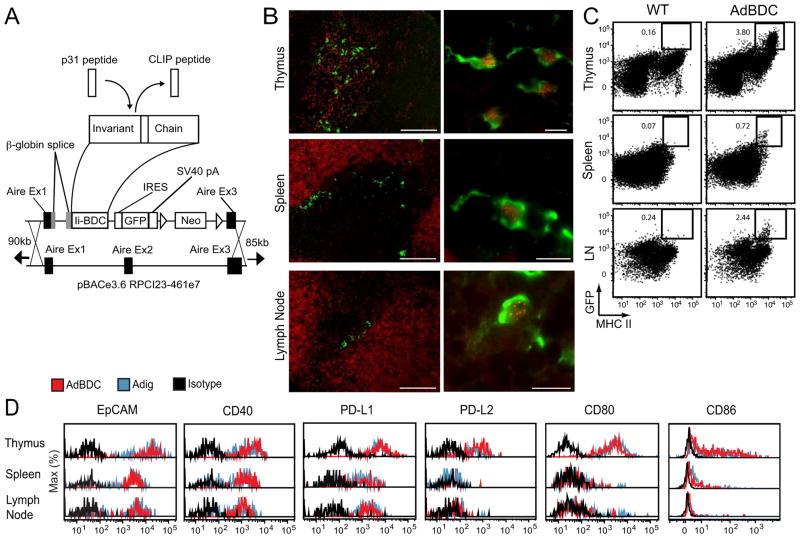
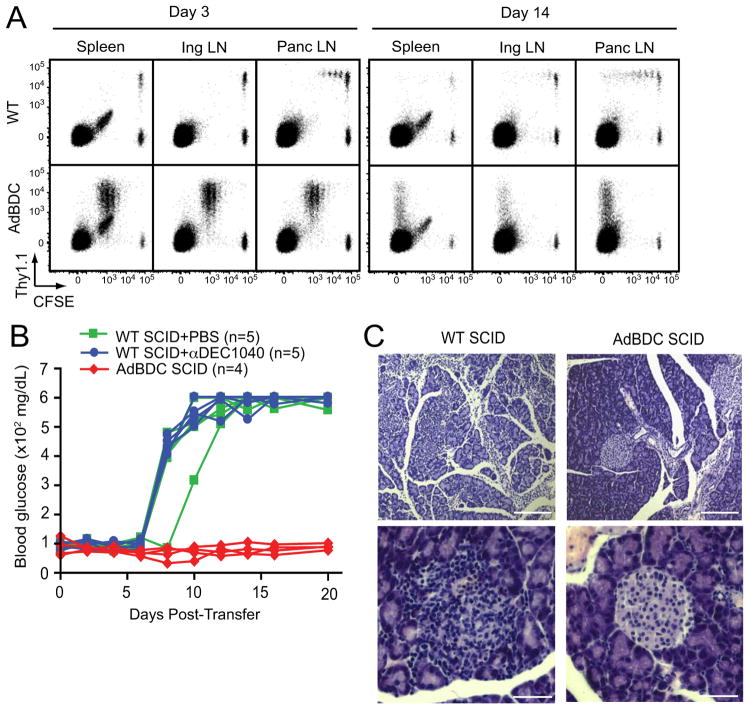
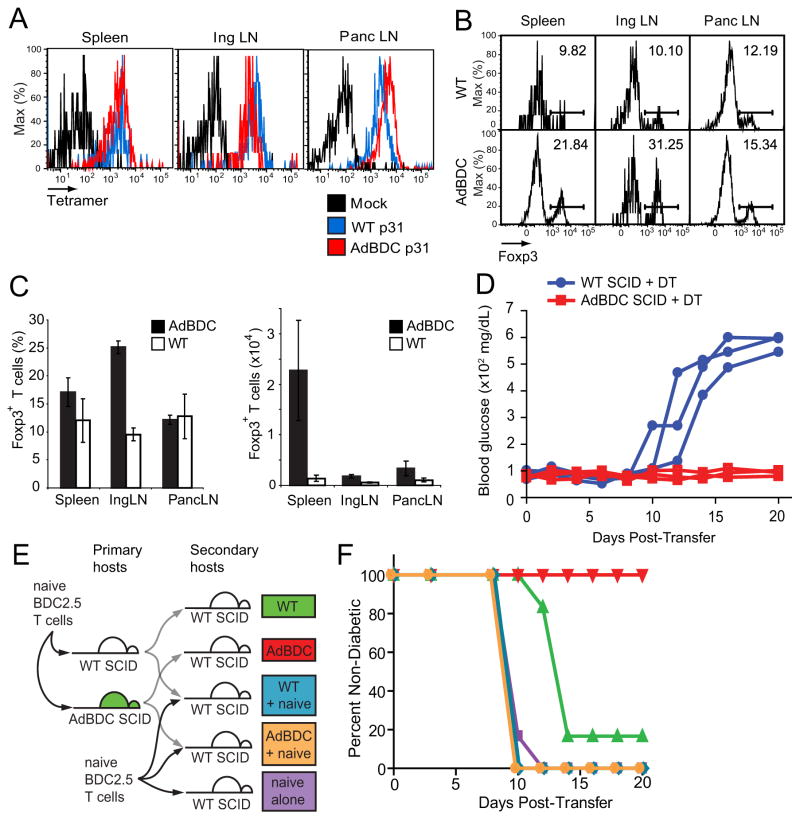
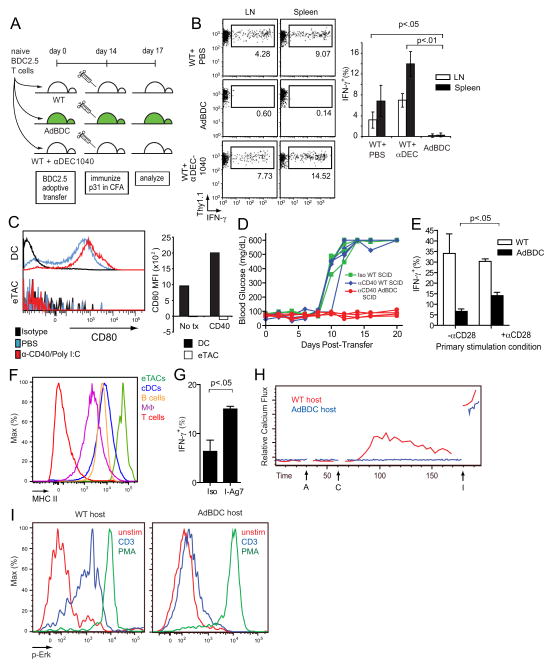
The autoimmune regulator (Aire) is essential for prevention of autoimmunity; its role is best understood in the thymus, where it promotes self-tolerance through tissue-specific antigen (TSA) expression. Recently, extrathymic Aire-expressing cells (eTACs) have been described in murine secondary lymphoid organs, but the identity of such cells and their role in immune tolerance remains unclear. Here we have shown that eTACs are a discrete major histocompatibility complex class II (MHC II)(hi), CD80(lo), CD86(lo), epithelial cell adhesion molecule (EpCAM)(hi), CD45(lo) bone marrow-derived peripheral antigen-presenting cell (APC) population. We also have demonstrated that eTACs can functionally inactivate CD4⁺ T cells through a mechanism that does not require regulatory T cells (Treg) and is resistant to innate inflammatory stimuli. Together, these findings further define eTACs as a distinct tolerogenic cell population in secondary lymphoid organs.


Conflict of interest statement

The authors declare no competing financial interests.

Figures

Figure 1
Figure 1
eTACs are bone marrow-derived. (A) CFSE dilution among Thy1.1-labeled 8.3 T cells in non-pancreatic lymph nodes three days after adoptive transfer into reciprocal Adig chimeras. Representative of two independent sets of chimeras. (B) Top: flow cytometric analysis of peripheral lymphoid organs from reciprocal bone marrow chimeras, made using WT and Aire-GFP reporter mice (performed in three independent experiments with Adig or AdBDC mice, see Fig. 4). Pre-gated on DAPI, CD45lo events. Bottom: Immunofluorescent images of lymph node sections from reciprocal chimeras, with Aire-driven GFP (green) and B220 (red) staining. Scale bars = 50 μm. Performed in three independent experiments with Adig or AdBDC mice, see Fig. 4. (C) Immunofluorescent detection of Aire protein (red) and Aire-driven GFP (green) in chimeras from (B). Scale bars = 7 μm, see also Figure S1.
Figure 2
Figure 2
eTACs are a distinct type of antigen presenting cell. (A) Identification of splenic eTACs without a GFP reporter. MHCII+ DAPI events are shown on a CD45 vs. EpCAM plot, and histograms of GFP expression are shown among a distinct EpCAM+ CD45lo population. (B) Quantitative PCR results of relative mRNA expression, Mean + SD, standardized to Ppia, in indicated populations. nd = not detected. Results are representative of at least two independent experiments per target. (C) Flow cytometric analysis of DAPI-, FSC vs. SSC Percoll light fractions from WT and Aire-GFP spleen. Representative of three independent experiments. (D) Back-gating of eTAC events, identified with an equivalent gating strategy to (A), onto the stromal cell identification approach shown in (C). (E) Flow cytometric analysis of spleen tissue from Zbtb46-GFP/WT mice showing GFP expression by the indicated populations. n=4 Zbtb46-GFP/WT or Zbtb46-GFP/GFP mice. (F) Additional qPCR analyses of target gene expression by eTACs and cDCs analyzed as in (B), mean + SD. (G) Giemsa staining of indicated populations from the spleens of Adig donors, cytospun onto slides, and visualized by light microscopy. Representative of two independent experiments. eTACs: FSC vs. SSC, DAPI, CD45lo, MHCIIhi, CD86, Aire-GFP+. Scale bars = 10 μm. (H) Flow cytometric analysis of the indicated markers on eTACs (green), CD45 stromal cells (red), and cDCs (blue). Representative of at least three independent experiments, see also Figure S2.
Figure 3
Figure 3
eTACs are present in human lymph nodes. (A) Immunofluorescent staining of eTACs from indicated lymph nodes counterstained with DAPI (blue), showing localization of eTACs to the T cell zone near B cell follicles. Note the rare Aire+ MHC II+ cells in the T cell zones (arrows). The outline of the follicle (Fo) is highlighted. Scale bar = 50 μm. Four independent experiments were performed with human samples. (B) Representative confocal images of eTACs in (A) showing nuclear Aire speckling. Scale bar = 10 μm. (C) Confocal images of eTACs with Aire (red) and co-staining of CD45 (left, scale bar = 10 μm), CD11c (center, scale bar = 25 μm), and CD11b (right, scale bar = 25 μm). Representative of at least two independent experiments per target, see also Figure S3.
Figure 4
Figure 4
The AdBDC transgene drives expression of the p31 mimetope peptide in Aire-expressing cells. (A) Schematic of Aire-driven BDC peptide Invariant Chain-GFP construct targeting the bacterial artificial chromosome (BAC) containing the murine Aire locus. The MHC class II-associated invariant chain peptide (CLIP) was replaced with the p31 peptide to facilitate its loading into MHC II molecules of Aire-expressing cells. (B) Immunofluorescent staining of AdBDC tissues with anti-GFP (green; all panels), B220 (red; spleen and lymph node left panels), cytokeratin 5 (red; thymus left panel) and anti-Aire (red, right panels). Representative of at least two independent experiments per analysis. (C) Flow cytometric analysis of GFP and MHC II expression from WT and AdBDC NOD tissues (pre-gated on CD45lo, DAPI). Representative of multiple independent experiments. (D) Flow cytometric analysis of DAPI, CD45lo, GFP+ populations with isotype control (black), or indicated markers from Adig (blue) and AdBDC (red) mice.
Figure 5
Figure 5
eTACs in AdBDC mice interact with CD4+ BDC2.5 T cells and prevent induction of autoimmune diabetes in SCID mice. (A) Flow cytometric analysis of CD4+ lymphocyte populations in after adoptive co-transfer of CFSE-labeled Thy1.1+ BDC2.5 T cells and Thy1.2+ polyclonal T cells to indicated hosts. Representative of at least three independent experiments. (B) Blood sugar values (mg/dl) among indicated mice following adoptive transfer of BDC2.5 T cells. Results are pooled from two independent cohorts. (C) Hematoxylin and eosin-stained pancreatic islet histology of indicated adoptive transfer recipients at day 10 post-transfer. Upper panel scale bars = 200 μm, lower panel scale bars = 50 μm. Representative of two independent experiments, see also Figure S4.
Figure 6
Figure 6
Regulatory T cells are dispensable for eTAC-induced tolerance. (A) Flow cytometric analysis of I-Ag7-p31 tetramer avidity among residual Thy1.1+ BDC2.5 T cells at day 14 post-adoptive transfer into indicated hosts compared with mock I-Ag7-CLIP tetramer (black). (B) Foxp3 staining of CD4+ Thy1.1+ BDC2.5 T cells 14 days after adoptive transfer to indicated hosts. (C) Quantitation of (B) showing percentage of Thy1.1+ CD4+ cells that are Foxp3+ (left) and total number of Foxp3+ cells (right) in indicated recipients, Mean +/− SD. (D) Blood sugar values (mg/dl) among DT-treated hosts after adoptive transfer of CD4-enriched, DT-treated BDC2.5 Foxp3-DTR T cells, n=3 per condition. (E) Schematic illustration of BDC2.5 serial adoptive transfer strategy. Naive BDC2.5 T cells were transferred into primary hosts; at day 10, lymphocytes were re-harvested, purified, and serially transferred into WT SCID secondary hosts alone or in a 1:1 mixture with fresh, naïve BDC2.5 T cells. (F) Diabetes incidence after adoptive transfer among secondary hosts indicated in (E), n=6 per condition, pooled from two independent cohorts, see also Figure S5.
Figure 7
Figure 7
eTACs induce functional inactivation of cognate T cells by presenting antigen in the absence of costimulation. (A) Schematic of p31+CFA immunization protocol to measure recall response of adoptively transferred BDC2.5 T cells. Naïve BDC2.5 T cells were transferred to indicated mice, which were immunized with p31 in complete freund’s adjuvant (CFA) 14 days later. IFN-γ production to this second stimulation was assessed ex vivo after three days. (B) IFN-γ production among CD4+ Thy1.1+ BDC2.5 T cells isolated from mice indicated in (A); bar graph shows quantification of pooled data with n=4 for each group, Mean +/− SD. Results are pooled from two independent experiments. (C) Representative flow cytometric analysis of CD80 staining in DAPI, CD45+, CD11c+ DCs and DAPI, CD45lo, MHCII+, GFP+ eTACs in response to anti-CD40+PolyI:C stimulus; quantification of MFI shifts above isotype levels shown at right. (D) Blood sugar values (mg/dL) among anti-CD40+PolyI:C treated hosts after adoptive transfer of naive BDC2.5 T cells, n=4 per condition, pooled from three independent experiments. (E) IFN-γ recall responses (% of CD4+ T cells) by CD4-enriched BDC2.5 T cells cultured with AdBDC or p31-pulsed WT primary APCs, and with anti-CD28 where indicated, responding to p31 + APC re-stimulation, Mean + SD. Data was pooled from three independent experiments. (F) Representative flow cytometric analysis of MHC II expression among by indicated populations. MΦ = macrophages. (G) IFN-γ recall responses by CD4+ Thy1.1+ CFSElo BDC2.5 T cells following culture with AdBDC APCs and either anti-I-Ag7 MHC II blocking antibody or isotype, Mean + SD. (H) Kinetic plots of relative Calcium signaling over time (seconds) of ex vivo BDC2.5 Thy1.1+ T cells recovered from indicated hosts and 14 days post-transfer, as detected by Indo-1 dyes. A - anti-CD3, C - cross-linking secondary, I – ionomycin. Results are representative of three independent experiments. (I) Flow cytometric analysis of Erk phosphorylation of rested Thy1.1+ CD4+ T cell populations in (H) after a 2 minute stimulation with anti-CD3 (blue) or PMA (green). Results are representative of three independent experiments, see also Figure S6.

Comment in

  • A breath of fresh aire.
    Zhang R, Turka LA. Zhang R, et al. Immunity. 2013 Sep 19;39(3):427-9. doi: 10.1016/j.immuni.2013.08.022. Immunity. 2013. PMID: 24054325

References

    1. Anderson MS, Venanzi ES, Chen Z, Berzins SP, Benoist C, Mathis D. The cellular mechanism of Aire control of T cell tolerance. Immunity. 2005;23:227–239. - PubMed
    1. Anderson MS, Venanzi ES, Klein L, Chen Z, Berzins SP, Turley SJ, von Boehmer H, Bronson R, Dierich A, Benoist C, et al. Projection of an immunological self shadow within the thymus by the aire protein. Science (New York, NY) 2002;298:1395–1401. - PubMed
    1. Bettini M, Szymczak-Workman AL, Forbes K, Castellaw AH, Selby M, Pan X, Drake CG, Korman AJ, Vignali DA. Cutting edge: accelerated autoimmune diabetes in the absence of LAG-3. Journal of immunology (Baltimore, Md : 1950) 2011;187:3493–3498. - PMC - PubMed
    1. Bonifaz L, Bonnyay D, Mahnke K, Rivera M, Nussenzweig MC, Steinman RM. Efficient targeting of protein antigen to the dendritic cell receptor DEC-205 in the steady state leads to antigen presentation on major histocompatibility complex class I products and peripheral CD8+ T cell tolerance. The Journal of experimental medicine. 2002;196:1627–1638. - PMC - PubMed
    1. Chemnitz JM, Parry RV, Nichols KE, June CH, Riley JL. SHP-1 and SHP-2 associate with immunoreceptor tyrosine-based switch motif of programmed death 1 upon primary human T cell stimulation, but only receptor ligation prevents T cell activation. Journal of immunology (Baltimore, Md : 1950) 2004;173:945–954. - PubMed

Publication types

MeSH terms