. 2013 Sep 12;51(5):606-17.
doi: 10.1016/j.molcel.2013.07.022. Epub 2013 Aug 29.

eRNAs promote transcription by establishing chromatin accessibility at defined genomic loci

Affiliations

eRNAs promote transcription by establishing chromatin accessibility at defined genomic loci

Kambiz Mousavi et al. Mol Cell. .

Abstract

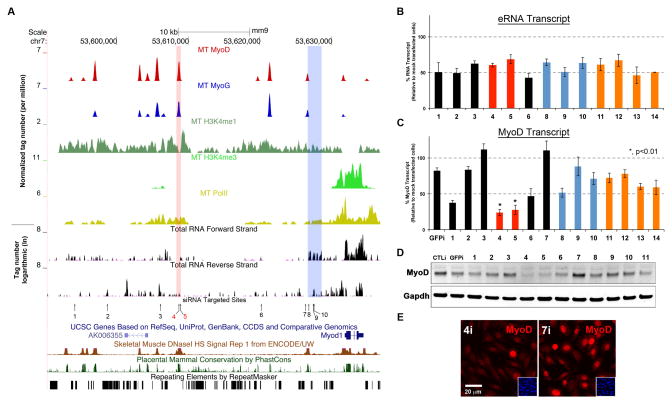
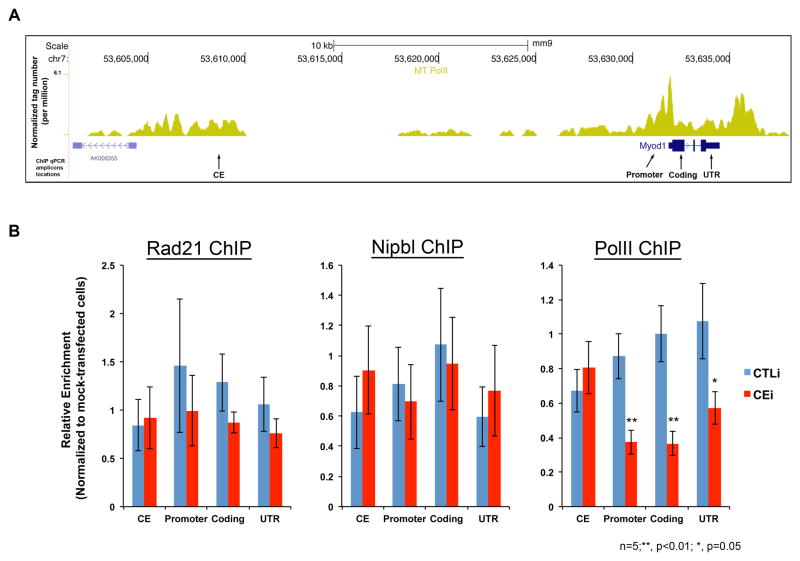
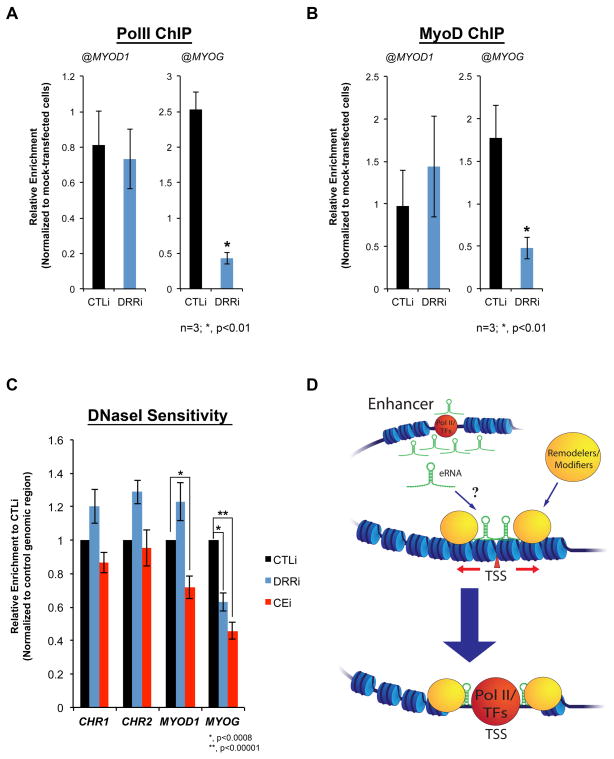
Transcription factors and DNA regulatory binding motifs are fundamental components of the gene regulatory network. Here, by using genome-wide binding profiling, we show extensive occupancy of transcription factors of myogenesis (MyoD and Myogenin) at extragenic enhancer regions coinciding with RNA synthesis (i.e., eRNA). In particular, multiple regions were transcribed to eRNA within the regulatory region of MYOD1, including previously characterized distal regulatory regions (DRR) and core enhancer (CE). While (CE)RNA enhanced RNA polymerase II (Pol II) occupancy and transcription at MYOD1, (DRR)RNA acted to activate the downstream myogenic genes. The deployment of transcriptional machinery to appropriate loci is contingent on chromatin accessibility, a rate-limiting step preceding Pol II assembly. By nuclease sensitivity assay, we found that eRNAs regulate genomic access of the transcriptional complex to defined regulatory regions. In conclusion, our data suggest that eRNAs contribute to establishing a cell-type-specific transcriptional circuitry by directing chromatin-remodeling events.


Conflict of interest statement

COMPETING INTERESTS STATEMENT

The authors declare no competing financial interests.

Figures

Figure 1
Figure 1. Transcription at MyoD+/MyoG+ Extragenic Regions
A. Genome-wide distribution of MyoG occupancy. B. Positive correlation of MyoD+/MyoG+ tags with H3K4me1+ peaks. Binding sites were binned for presentation. C. H3K4me1, PolII and H3K4me3 occupancy profiles at MyoG+ (2,170) enhancer sites. D. Number of MyoG+ peaks in the extragenic regions and their occurrence with H3K4me1, H3K27ac, PolII and RNA transcripts. E. RNA read profile at MyoG+ enhancers. F. eRNA-assigned upregulated genes (eRNA+) have higher mRNA levels than those without eRNA assigned (eRNA−). Data are represented as mean +/− SEM. G. PolII occupancy profile at eRNA+ and eRNA- upregulated genes in 48hrs MT.
Figure 2
Figure 2. eRNA Synthesis at DRR of MYOD1 (DRRRNA)
A. Occupancies of MyoD, MyoG, H3K4me1, H3K4me3, PolII and presence of RNA (polyA+ and ribosome-depleted) in regions within ~5–6kb of MYOD1 in C2C12 MB, MT and activated satellite cells. For better visualization, RNA scales are set to logarithmic. Region highlighted in light blue depicts DRRRNA-coding region. B. Nuclear (Nuc) distribution of DRRRNA, assessed by fractionation from cytoplasmic (Cyto) compartment. Data are represented as mean +/− SEM. C. Upregulation of DRRRNA during myogenic differentiation in C2C12 and primary cells (MB, 50–70% proliferating myoblasts, MT, 48hrs differentiated myotubes). Data are represented as mean +/− SEM. D. Significant reduction of MyoD and DRRRNA transcript levels following MyoDi (RT-qPCR), and reduction of MyoG and DRRRNA transcript levels after MyoGi (RT-qPCR). Biological replicates (n) and p-value are shown, data are represented as mean +/− SEM.
Figure 3
Figure 3. CERNA is Required for MyoD Expression
A. MyoD, MyoG, H3K4me1, H3K4me3, PolII occupancy profiles as well as PE-Seq reads (ribosome-depleted) in forward and reverse strand within ~50kb regions of MYOD1. CE and DRR are highlighted in red and blue bars, respectively. The sites of siRNAs are labeled 1–10. Sites 11–14 are located elsewhere on other chromosomes (see Figure S3). As well, sites of DNaseI sensitivity (ENCODE/UW), mammalian conservation (PhastCons) and repetitive elements (RepeatMasker) are shown. B. Targeted eRNA levels (measured by RT-qPCR) after RNAi. Data are represented as mean +/− SEM. C–D. Relative MyoD transcript levels (measured by RT-qPCR) and protein levels (shown by western blotting) following eRNAi, respectively. In C, data are represented as mean +/− SEM. E. MyoD immunofluorescence detection (red) after eRNAi against regions 4 and 7 in Panel A. Insets are DAPI-labeled nuclei in the same field of view.
Figure 4
Figure 4. DRRRNA Promotes Myogenic Differentiation
A. Immunofluorescence detection (red) of MyoD, MyoG, Myh in control, GFPi and DRRi cells. Note the reduction of MyoG and Myh in DRRi cells. B. Heat maps depicting the relative RNA levels (PolyA+ RNA-Seq) of myogenic genes in DRRi as compared to GFPi, and along side, relative transcript levels of myogenic genes from overexpressing cells (DRR1.2ox) as compared those expressing GFP (GFPox) are shown. Red arrows highlight MyoD and MyoG. C. Profiles of MyoD and MyoG occupancies as well as RNA (PE-Seq ribosome-depleted), the lengths of DRR fragments for overexpression are shown below. D. Increase in MyoG mRNA levels following overexpression of DRR1.2 and DRR2.0 fragments as compared to DRR0.5, a fragment −12kb upstream of MyoD (−12kb) and GFP. Biological replicates (n) and p-value are shown, data are represented as mean +/− SEM.
Figure 5
Figure 5. CERNA Influences PolII Occupancy at MYOD1
A. PolII occupancy (ChIP-Seq) profile at regulatory regions of MYOD1. Arrows are locations of ChIP-qPCR amplicons as CE, promoter, coding and 3′ untranslated region (UTR). B. Charts show relative ChIP-qPCR enrichment in CTLi (control) and CEi (CERNA siRNA) cells normalized to mock-transfected control samples. Biological replicates (n) and p-value are shown, data are represented as mean +/− SEM.
Figure 6
Figure 6. eRNAs Regulate Chromatin Accessibility
A–B. Charts represent relative enrichment (normalized to mock-transfected) of PolII and MyoD occupancies, respectively, at MYOD1 and MYOG in CTLi (control) and DRRi (DRRRNA siRNA) cells. Biological replicates (n) and p-value are shown, data are represented as mean +/− SEM. C. Chart shows relative enrichment of amplicons from CTLi, DRRi and CEi cells [values were normalized to a control genomic region with no accessibility (mm9, chr15:15,304,393-15,304,469). Values represent three biological replicates and 3–5 technical replicates per biological sample (p-value are shown, data are represented as mean +/− SEM). D. A drawing depicting a potential role of eRNAs (either direct or accompanied by chromatin remodelers/modifiers) in directing chromatin accessibility at protein-coding promoters.

Comment in

  • Opening the Chromatin by eRNAs.
    Shiekhattar R. Shiekhattar R. Mol Cell. 2013 Sep 12;51(5):557-8. doi: 10.1016/j.molcel.2013.08.033. Mol Cell. 2013. PMID: 24034693 Free PMC article.

References

    1. Asakura A, Lyons GE, Tapscott SJ. The regulation of MyoD gene expression: conserved elements mediate expression in embryonic axial muscle. Dev Biol. 1995;171:386–398. - PubMed
    1. Bernstein BE, Birney E, Dunham I, Green ED, Gunter C, Snyder M. An integrated encyclopedia of DNA elements in the human genome. Nature. 2012;489:57–74. - PMC - PubMed
    1. Biddie SC, John S, Sabo PJ, Thurman RE, Johnson TA, Schiltz RL, Miranda TB, Sung MH, Trump S, Lightman SL, et al. Transcription factor AP1 potentiates chromatin accessibility and glucocorticoid receptor binding. Molecular cell. 2011;43:145–155. - PMC - PubMed
    1. Blais A, Tsikitis M, Acosta-Alvear D, Sharan R, Kluger Y, Dynlacht BD. An initial blueprint for myogenic differentiation. Genes Dev. 2005;19:553–569. - PMC - PubMed
    1. Blum R, Vethantham V, Bowman C, Rudnicki M, Dynlacht BD. Genome-wide identification of enhancers in skeletal muscle: the role of MyoD1. Genes & development. 2012;26:2763–2779. - PMC - PubMed

Publication types

MeSH terms

Associated data