. 2013 Sep 16;26(5):469-482.
doi: 10.1016/j.devcel.2013.07.017. Epub 2013 Aug 29.

Retinoid signaling in progenitors controls specification and regeneration of the urothelium

Affiliations

Retinoid signaling in progenitors controls specification and regeneration of the urothelium

Devangini Gandhi et al. Dev Cell. .

Abstract

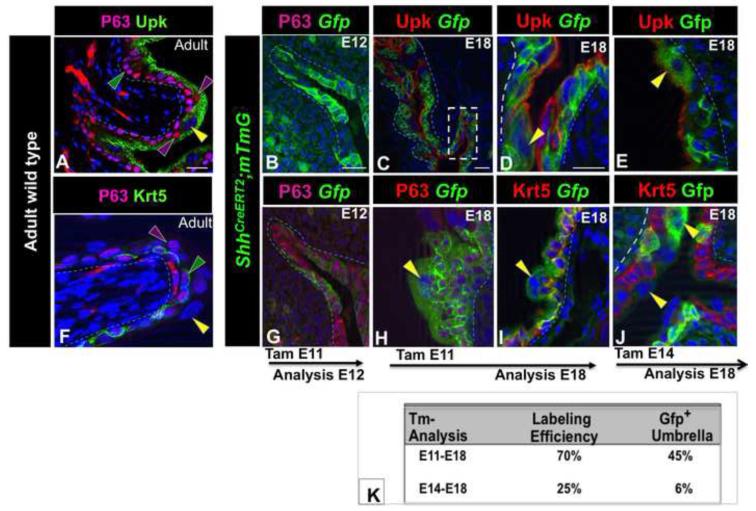
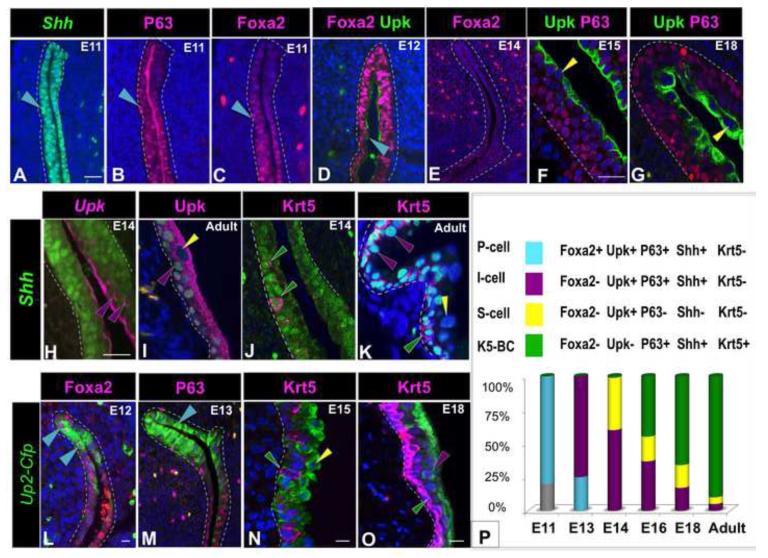
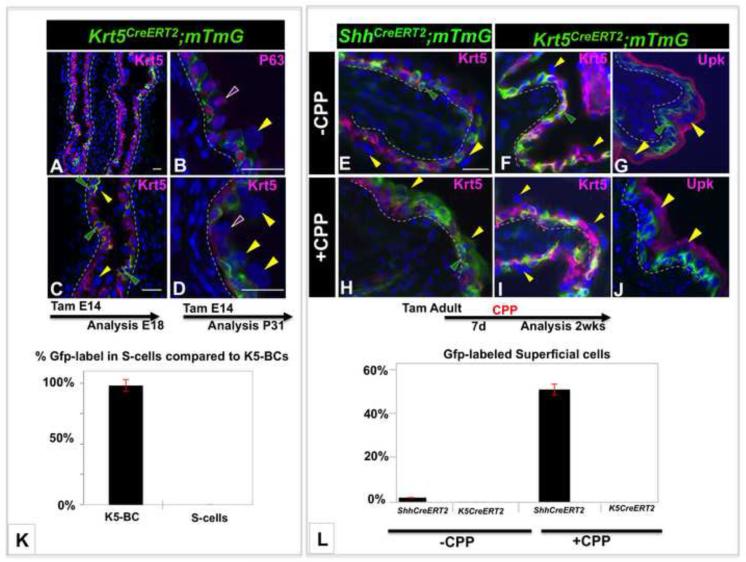
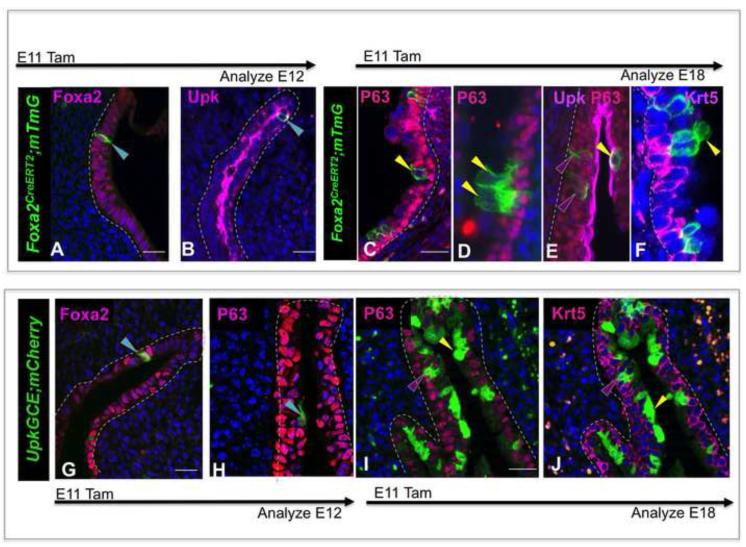
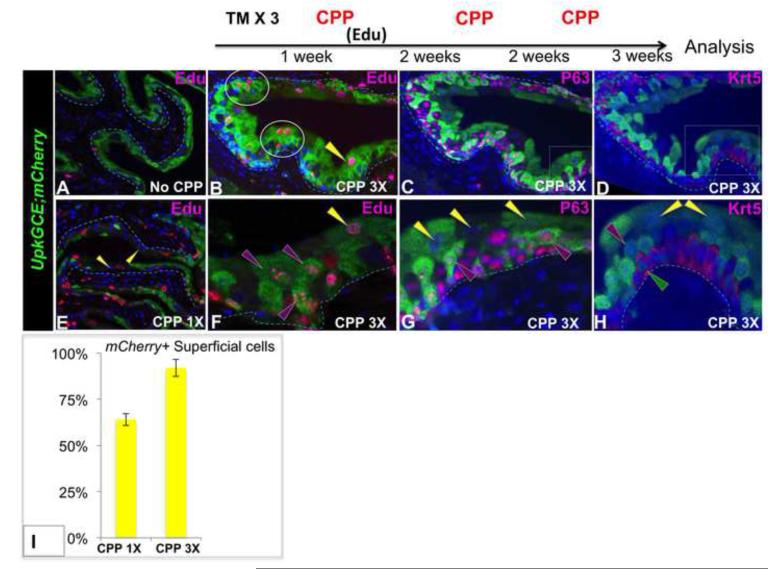
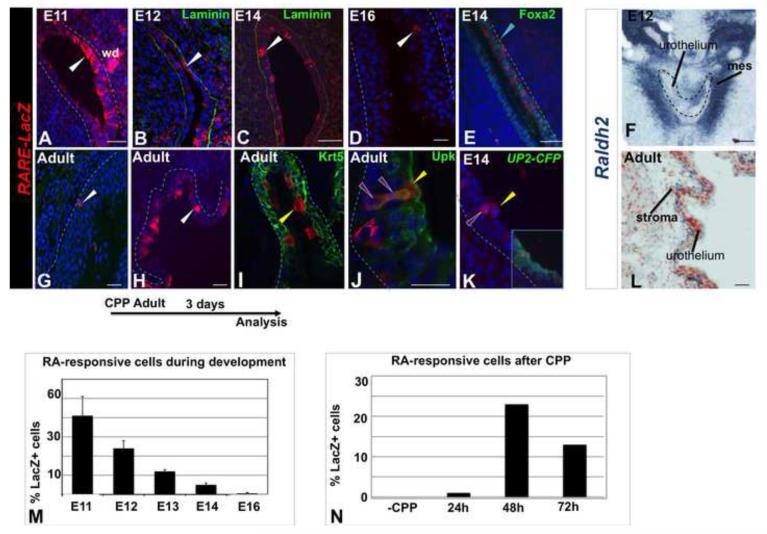
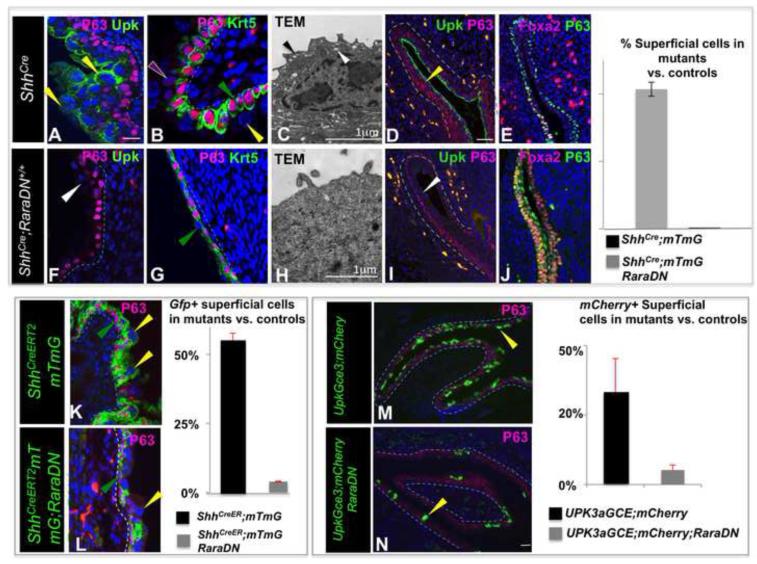
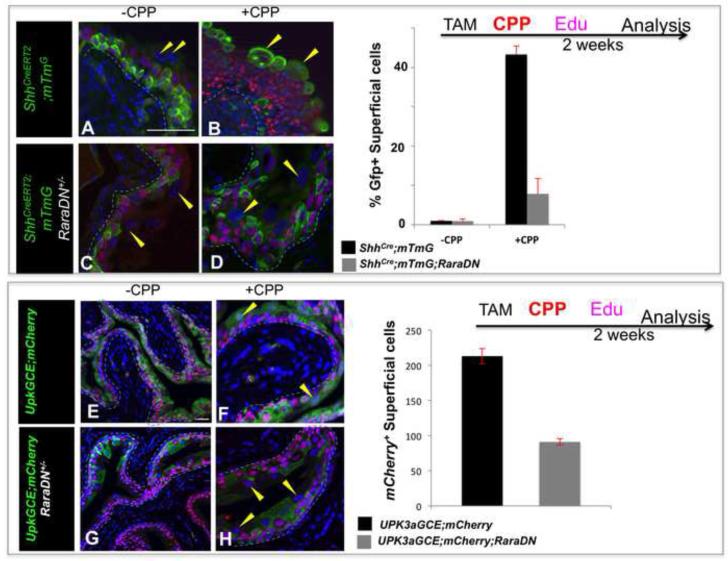
The urothelium is a multilayered epithelium that serves as a barrier between the urinary tract and blood, preventing the exchange of water and toxic substances. It consists of superficial cells specialized for synthesis and transport of uroplakins that assemble into a tough apical plaque, one or more layers of intermediate cells, and keratin 5-expressing basal cells (K5-BCs), which are considered to be progenitors in the urothelium and other specialized epithelia. Fate mapping, however, reveals that intermediate cells rather than K5-BCs are progenitors in the adult regenerating urothelium, that P cells, a transient population, are progenitors in the embryo, and that retinoids are critical in P cells and intermediate cells, respectively, for their specification during development and regeneration. These observations have important implications for tissue engineering and repair and, ultimately, may lead to treatments that prevent loss of the urothelial barrier, a major cause of voiding dysfunction and bladder pain syndrome.


Figures

Figure 1
Figure 1. Shh-expressing cells are progenitors in the developing urothelium
A. A section from an adult urothelium stained with Uroplakin (Upk; green) and P63 (pink). B. A section from an E12 ShhCreERT2;mTmG embryo treated with TM at E11. C. Upk-expression (red) in an E18 ShhCreERT2;mTmG embryo exposed to TM on E11. D. Higher magnification of C. E. Upk expression (red) in a section from an E18 ShhCreERT2;mTmG embryo exposed to TM on E14. F. A section from an adult urothelium stained with Krt5 (green) and P63 (pink). G. P63 expression in the urothelium from an E12 ShhCreERT2;mTmG embryo treated with TM on E11. H. P63-expression (pink) in an E18 ShhCreERT2;mTmG embryo exposed to TM on E11. I. Krt5-expression (red) in an E18 ShhCreERT2;mTmG embryo exposed to TM on E11. J. Krt5-expression (red) in an E18 ShhCreERT2;mTmG embryo exposed to TM on E14. K. A table showing the labeling efficiency after TM treatment at E11 vs. E14, and the percentage of S-cells in E18 ShhCreERT2;mTmG embryos expressing the Gfp lineage tag 7 days and 4 days after TM treatment, respectively. Yellow arrowheads: S-cells, Green arrowheads, K5-BCs, purple arrowheads; I-cells. mTmG Gfp-positive cells are green. Magnifications: A,B,C,G,F 20X ; D,E, H,I,J 40X . All scale bars are 50μm. (See Also Figure S1).
Figure 2
Figure 2. The Shh-population contains multiple cell types
A. A section from an E11 ShhGfp/Cre embryo immunostained for expression of Gfp (green nuclear staining). B. A serial section from the same embryo as in (A) stained for expression of P63 (pink). C. A serial section from the same embryo as in (A) stained for expression of Foxa2. D. A section from an E12 embryo showing P-cells expressing Foxa2 (pink) and Upk (green) expression. E. A section from an E14 embryo stained with Foxa2 antibody (pink) which is undetectable. F. A section from an E14 embryo stained for expression of Upk (green) and P63 (pink). G. A section from the urothelium of an E18 embryo stained for expression of P63 (pink) and Upk (green). H. A section from an E14 ShhGfp/Cre embryo (Gfp is green nuclear staining) stained for expression of Upk (pink). I. A section from an adult ShhnlacZ embryo (nlacZ is green nuclear staining) stained with Upk antibody (pink). J. A section from an E14 ShhGfp/Cre embryo (Gfp is green nuclear staining) stained for expression of Krt5 (pink). K. A section from an adult ShhnlacZ embryo (nlacZ is green nuclear staining) stained for expression Krt5 (pink). L. A section from an E12 Up2-Cfp embryo (Cfp detected with anti-Gfp antibody is shown in green) stained for expression of Foxa2 (pink). M. A section from a E13 Up2-Cfp embryo stained for expression of P63 (pink). Cfp detected with anti-Gfp antibody is shown in green. N. A section from an E15 Up2-Cfp embryo stained for expression of Krt5 (Cfp detected with anti-Gfp antibody is shown in green). O. A section from an E18 Up2-Cfp embryo stained with Krt5 antibody (pink). Cfp detected with anti-Gfp antibody is shown in green. P. A schematic showing the color code for different urothelial cell types and the relative proportions in the embryonic and adult urothelium. In this and subsequent figures: S-cells are marked with yellow arrowheads, I-cells with purple arrowheads, K5-BCs with green arrowheads, and P-cells, with blue-green arrowheads. Magnifications: A-D; L,M 20X; E 10X; F,G 40X; H-K 40X ;N ,O x40. Scale bars: 50μm. (See also Figure S2).
Figure 3
Figure 3. K5-BCs are unlikely to be urothelial progenitors
A-D. Lineage studies in the embryonic urothelium using the Krt5CreERT2;mTmG line to follow the fate of K5-BCs. A. section from a Krt5CreERT2;mTmG E18 embryo exposed to TM at E14 stained for expression of Krt5 (pink). Cells expressing the Gfp-lineage marker detected with Gfp antibody are green. B. A section from a Krt5CreERT2;mTmG embryo exposed to TM at E14 and analyzed 1 month later stained for expression of P63 (pink). Cells expressing the Gfp-lineage marker detected with Gfp antibody are green C. A higher magnification of the section in (A). D. A section from a Krt5CreERT2;mTmG embryo exposed to TM at E14 and analyzed after 1 month stained for expression of Krt5 (pink). Cells expressing the Gfp-lineage marker detected with Gfp antibody are green. E. A section from a TM treated adult ShhCreERT2;mTmG mouse that did not receive CPP, stained for expression of Krt5 (pink). Cells expressing the Gfp-lineage marker detected with Gfp antibody are green. F-G. Sections from adult TM treated Krt5CreERT2;mTmG mice that did not receive CPP, stained for expression of Krt5 (pink in F) and Upk (pink in G). H. A section from a TM treated adult ShhCreERT2;mTmG mouse analyzed 2 weeks after CPP administration stained for expression of Krt5 (pink). I-J. Sections from a TM treated adult Krt5CreERT2;mTmG mouse stained for expression of Krt5 (pink in I) or Upk (pink in J) 2 weeks after CPP treatment. Cells expressing the Gfp-lineage marker detected with Gfp antibody are green K. A graph showing the distribution of lineage tagged cells in the K5-BC and superficial compartments in Krt5CreERT2;mTmG mice exposed to TM on 14, in utero and analyzed at E18 or P31. L A graph showing a comparison of lineage tracing studies in Krt5CreERT2;mTmG and ShhCreERT2;mTmG mice with and without CPP treatment. S-cells are marked with yellow arrowheads, I-cells with purple arrowheads, K5-BCs with green arrowheads. For quantification, a minimum of three independent experiments were performed, and the average ± SEM was plotted. Magnifications: A 20X ; C 40X; B,D 40X, E-J 30X. Scale bars: 50μm. (See also Figure S3).
Figure 4
Figure 4. P-cells are a transient progenitor population in the embryonic urothelium
A-F. Lineage tracing with the Foxa2CreERT2;mTmG line. A. Expression of the Gfp lineage tag (detected with antibody, green) in P-cells stained for expression of Foxa2 cells (pink) in an E12 embryo, 24h after TM exposure on E11. B. Expression of the Gfp lineage tag (detected with antibody, green) in P-cells expressing Upk (pink) in an E12 embryo 24h after TM exposure on E11. C. A section from an E18 Foxa2CreERT2;mTmG embryo exposed to TM on E11 stained for expression of P63 (pink). D. A section from an E18 Foxa2CreERT2;mTmG embryo exposed to Tam at E11 stained for expression of Upk (pink) and P63 (red). E A section from an E18 Foxa2CreERT2;mTmG embryo exposed to Tam on E11stained for expression of Krt5 (pink). F. A section from an E18 Foxa2CreERT2;mTmG embryo exposed to Tam at E11, stained with Krt5 (pink) showing a cluster of lineage-marked cells (detected with Gfp antibody, green). G. Expression of the mCherry lineage tag (green, detected with an antibody directed against Rfp) in P cells in an E12 Upk3aGCE;mCherry embryo exposed to Tamoxifen on E11 and stained for expression of Foxa2 (pink). H. Expression of the mCherry lineage tag (green, detected with an antibody directed against Rfp) in P cells in an E12 Upk3aGCE;mCherry embryo exposed to Tamoxifen on E11 and stained for expression of P63 (pink). I. Expression of the mCherry lineage tag (green, detected with an antibody directed against Rfp) in intermediate and superficial cells in an E18 Upk3aGCE;mCherry embryo exposed to Tamoxifen on E11 and stained for expression of P63 (pink). J. Expression of the mCherry lineage tag (green, detected with an antibody directed against Rfp) in intermediate and superficial cells in an E18 Upk3aGCE;mCherry embryo exposed to Tamoxifen on E11 and stained for expression of Krt5 (pink). Magnifications: A,B, G 20X ; H 40X;C,D 20X;E,20X and F,2X. Scale bars: 50μm.
Figure 5
Figure 5. I-cells are a superficial progenitor population in adults
A. A section showing the urothelium of a Upk3aGCE;mCherry adult that did not receive CPP mCherry detected with an antibody directed against Rfp is shown in green and Edu-expressing cells are pink. B-H Sections from an Upk3aGCE;mCherry adult after 3 rounds of CPP-induced damage and repair. (B): Stained with Edu and mCherry (C) Stained with P63 and mCherry (D) Stained with Krt5 and mCherry. E. A section of an Upk3aGCE;mCherry adult after 1 round of CPP-induced damage and repair, showing the distribution of mCherry expression (green) and Edu (pink). F,G,H, Higher magnification of B,C,D, respectively. For quantification, a minimum of three independent experiments were performed, and the average ± SEM was plotted. Magnifications: A,E 20X; B,C,D 20X and 2x zoomed; F,G,H 40X and 2X zoomed. Scale bars 50uM.
Figure 6
Figure 6. RA-signaling is selectively up-regulated in the embryonic urothelium and in the adult urothelium during regeneration
A. A section showing the urothelium in an E11 RARE-lacZ reporter embryo showing LacZ expression (red) detected with antibody staining. B. A section showing the distribution of RA-responsive cells in the urothelium of an E12 RARE-lacZ reporter (red). C. A section from an E14 RARE-lacZ reporter embryo stained for lacZ expression (red). D. A section from an E12 RARE-lacZ reporter embryo stained for lacZ expression (red) and Foxa2 (green). E. A section from an E14 Up2-Cfp;RARE-lacZ reporter embryo stained for lacZ expression (red) and Up2-Cfp (green). F. In situ hybridization showing expression of Raldh2 in sub-urothelial mesenchyme in an E12 embryo. G. A section from the urothelium of adult RARE-lacZ reporter mouse stained for lacZ expression (red). H. G. A section from the urothelium of adult RARE-lacZ reporter mouse 48h after administration of CPP stained for lacZ expression (red) and Krt5 (green). I. A section from the urothelium of adult RARE-lacZ reporter mouse 48h after administration of CPP, stained for lacZ expression (red) and Upk (green). K. Same section as in (E) showing only the red channel. L. In situ hybridization showing expression of Raldh2 in sub-urothelial stroma in a wild type adult mouse. For quantification, a minimum of three independent experiments were performed, and the average ± SEM was plotted.Magnifications: A –C,F 20X; D,E. Scale bars: 50μm
Figure 7
Figure 7. Retinoids are required for urothelial formation
A. P63 (pink) and Upk (green) staining in an E18 control ShhCre/+ embryo. B. Krt5 (green) and P63 (pink) staining in the urothelium of an E18 control ShhCre/+ embryo. C. Transmission electron microscopy showing the apical surface of an ShhCre/+ embryo. D. A section from an E14 ShhCre/+ control embryo stained with Upk (green) and P63 (pink). E. A section from an E14 ShhCre/+ embryo stained with Foxa2 (pink) and P63 (green). F. P63 (pink) and Upk (green) staining in a section from an E18 ShhCre/+; RaraDN mutant embryo. G. Krt5(green) and P63 (pink) staining in the urothelium of an E18 ShhCre/+; RaraDN mutant embryo. H. Transmission electron microscopy showing the apical surface of an E18 ShhCre/+; RaraDN mutant urothelial cell. I. A section from an E14 ShhCre/+;RaraDN mutant embryo stained with Upk (green) and P63 (pink). J. A section from an E14 ShhCre/+;RaraDN mutant embryo stained with Foxa2 (pink) and P63 (green). K. P63 (pink) staining in an E18 control ShhCreERT2;mTmG embryo exposed to TM on E11 (the Gfp lineage-tag is green). L. P63 (pink) staining in an E18 ShhCreERT2;mTmG;RaraDN mutant embryo exposed to TM on E11 (the Gfp lineage-tag is green). M. P63 (pink) staining in an E18 Upk3aGCE;mCherry control embryo exposed to TM on E11 (mCherry is shown in green). N. P63 (pink) staining in an E18 Upk3aGCE;mCherry;RaraDN mutant embryo exposed to TM on E11 (mCherry is shown in green). For quantification, a minimum of three independent experiments were performed, and the average ± SEM was plotted. Magnifications: A,B,D,E,F,G,I,J 20X; C,H 31,000X; KL, 40X; M,N 20X. Scale bars: 50μm. (See also S4).
Figure 8
Figure 8. Retinoids are required for urothelial regeneration
A. P63 expression in a control ShhCreERT2;mTmG adult that has not received CPP. B. P63 expression (pink) in a ShhCreERT2;mTmG adult analyzed 2 weeks after CPP treatment. C. P63 expression in a mutant ShhCreERT2;mTmG; RaraDN adult that has not received CPP. D. P63 (pink) expression in a CPP-treated ShhCreERT2;mTmG;RaraDN mutant adult analyzed 2 weeks after CPP treatment. E. P63 expression (pink) in a control Upk3aGCE;mCherry adult that has not received CPP (mCherry is shown in green). F. P63 (pink) expression in a CPP-treated Upk3aGCE;mCherry adult analyzed 2 weeks after CPP treatment. mCherry is shown in green. G. P63 (pink) expression in a Upk3aGCE;mCherry;RaraDN mutant adult that did not receive CPP. mCherry is shown in green. H. P63 (pink) expression in a Upk3aGCE;mCherry RaraDN mutant 2 weeks after CPP treatment. mCherry is shown in green. For quantification a minimum of three independent experiments were performed, and the average ± SEM was plotted. Magnifications: A-H 20X. Scale bars 50μm.

References

    1. Bayha E, Jorgensen MC, Serup P, Grapin-Botton A. Retinoic acid signalingorganizes endodermal organ specification along the entire antero-posterior axis. PLoS ONE. 2009;4:e5845. - PMC - PubMed
    1. Blumberg B, Bolado J, Jr., Moreno TA, Kintner C, Evans RM, Papalopulu N. An essential role for retinoid signaling in anteroposterior neural patterning. Development. 1997;124:373–379. - PubMed
    1. Chia I, Grote D, Marcotte M, Batourina E, Mendelsohn C, Bouchard M. Nephric duct insertion is a crucial step in urinary tract maturation that is regulated by a Gata3-Raldh2-Ret molecular network in mice. Development. 2011;138:2089–2097. - PMC - PubMed
    1. Dalgin G, Ward AB, Hao LT, Beattie CE, Nechiporuk A, Prince VE. Zebrafish mnx1 controls cell fate choice in the developing endocrine pancreas. Development. 2011;138:4597–4608. - PMC - PubMed
    1. Damm K, Heyman RA, Umesono K, Evans RM. Functional inhibition of retinoic acid response by dominant negative retinoic acid receptor mutants. Proceedings of the National Academy of Sciences of the United States of America. 1993;90:2989–2993. - PMC - PubMed

Publication types

MeSH terms