. 2013 Sep 9;24(3):331-46.
doi: 10.1016/j.ccr.2013.08.001. Epub 2013 Aug 29.

Mesenchymal differentiation mediated by NF-κB promotes radiation resistance in glioblastoma

Affiliations

Mesenchymal differentiation mediated by NF-κB promotes radiation resistance in glioblastoma

Krishna P L Bhat et al. Cancer Cell. .

Abstract

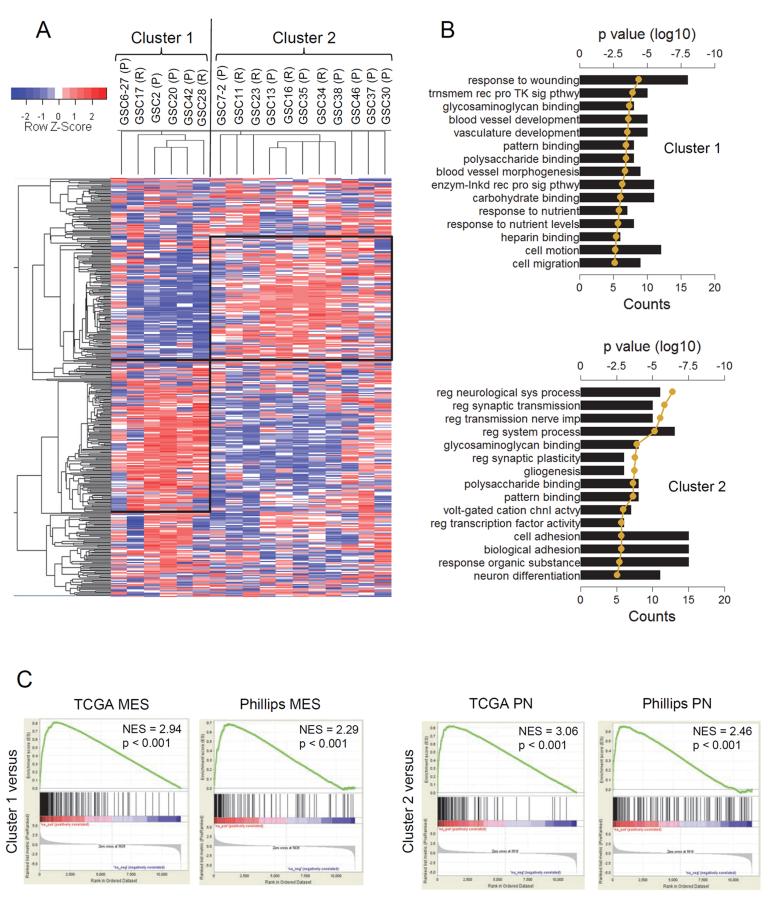
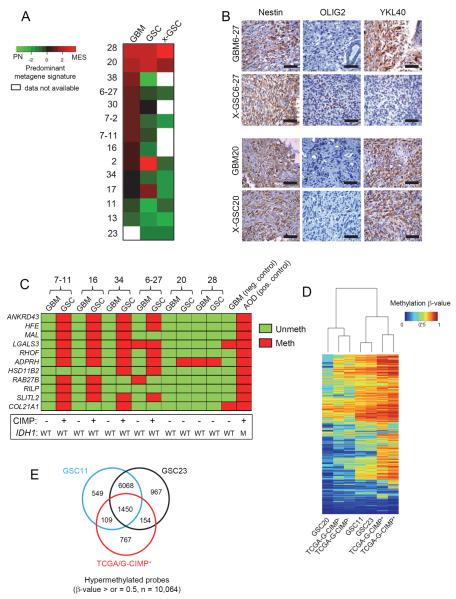
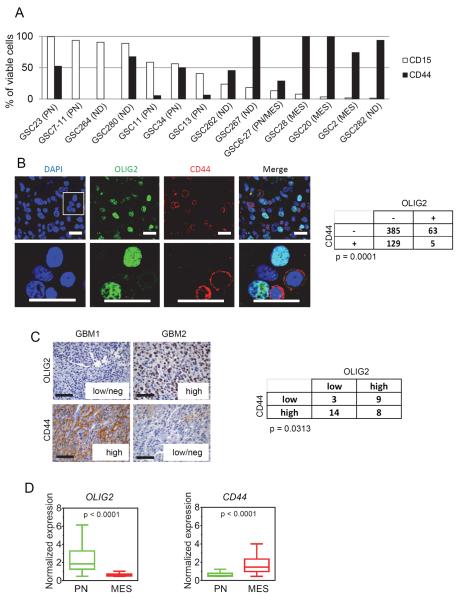
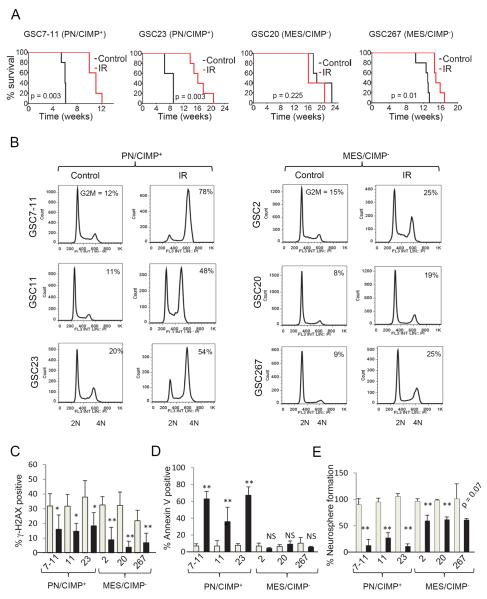
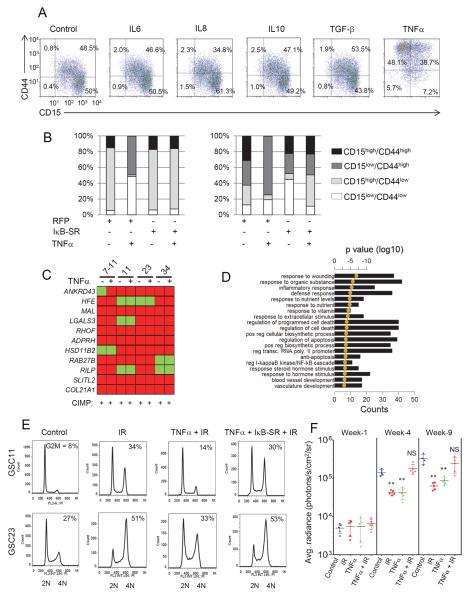
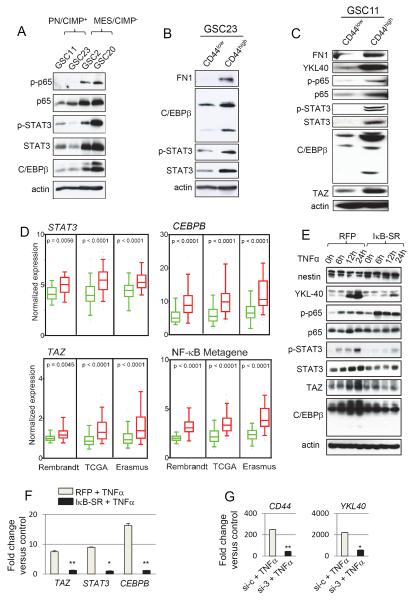
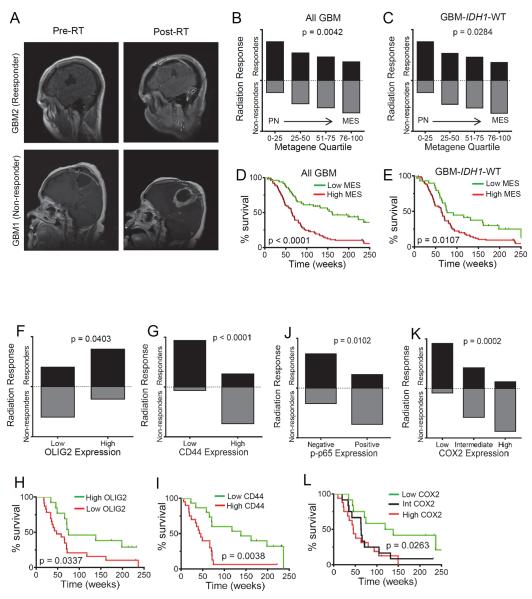
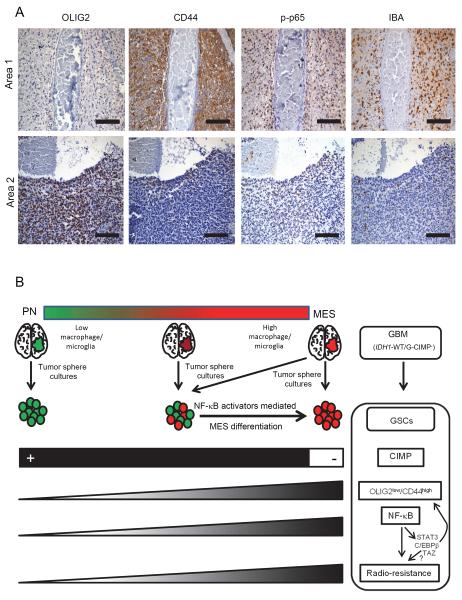
Despite extensive study, few therapeutic targets have been identified for glioblastoma (GBM). Here we show that patient-derived glioma sphere cultures (GSCs) that resemble either the proneural (PN) or mesenchymal (MES) transcriptomal subtypes differ significantly in their biological characteristics. Moreover, we found that a subset of the PN GSCs undergoes differentiation to a MES state in a TNF-α/NF-κB-dependent manner with an associated enrichment of CD44 subpopulations and radioresistant phenotypes. We present data to suggest that the tumor microenvironment cell types such as macrophages/microglia may play an integral role in this process. We further show that the MES signature, CD44 expression, and NF-κB activation correlate with poor radiation response and shorter survival in patients with GBM.


Figures

Figure 1
Figure 1. Patient Derived GSCs Bear Resemblance to PN and MES Signatures
(A) Unsupervised hierarchical analysis of the top 500 highest median absolute deviation genes from expression microarray of seventeen GSCs. Expression data was Z-score corrected for display; relatively lower expression is shown in blue and higher expression is shown in red (see color key). Two large clusters, cluster 1 (128 genes) and cluster 2 (102 genes) were identified (shown as black boxes). The vertical black line identifies the first dendrogram splitting of the GSCs. Primary (P) or recurrent (R) status of the GSCs is indicated. (B) The top twenty gene ontology (GO) terms associated with cluster 1 (left) and cluster 2 (right) from the unsupervised GSC hierarchical cluster analysis. GO terms are ranked by p value. The black bars show the number of genes that is common between the GO term's gene set and the respective cluster gene set. The golden line is the log10 of the p value as determined by DAVID functional analysis. (C) GSEA enrichment plots of GSC cluster 1 high (top row) and cluster 2 high (bottom row) gene lists versus queried gene lists (see Supplemental Experimental Procedures for data source). The normalized enrichment scores (NES) and the p values are shown for each plot. See also Figure S1 and Table S1–S5.
Figure 2
Figure 2. GSCs Differ in the Transcriptome and Epigenetic Profiles When Compared to the Originating Tumor
(A) Heatmap of the predominant signature of initiating GBM, derived GSC, and xenograft for fourteen samples is shown. A PN and MES qRT-PCR based metagene was calculated for each sample and then compared to each other after Z-score correction. Green shades represent a predominantly PN signature, red a MES one, and black a relatively balanced expression of both, as indicated in the figure. (B) IHC analysis of Nestin, OLIG2 and YKL40 expression in patient matched GBM and xenografts of GSCs. Scale Bar: 50 μm. (C) Methylight profiling of GBMs and their derivative GSCs for G-CIMP status. Eleven markers were tested for presence of methylation on their promoters and coded as red if methylated and green if unmethylated. Samples were deduced as G-CIMP if >50% of the loci showed methylation. A GBM and an anaplastic oligodendroglioma (AOD) sample were used as negative and positive controls respectively. The IDH1 and G-CIMP status of all samples is shown below. (D) Heatmap shows the unsupervised clustering of 2612 G-CIMP signature methylation probes based on p values for the indicated cell types. (E) Venn diagram showing the number of hypermethylated probes (β-values of >0.5) in GSCs 11, 23 and TCGA G-CIMP+ tumors. See also Figure S2.
Figure 3
Figure 3. CD44 is Enriched in the MES Subtype and is Inversely Correlated with OLIG2 Expression
(A) CD15 and CD44 of various GSCs were determined by flow cytometry. Bar graph indicates percentage of viable cells that express these markers at the earliest passage tested. ND = not determined. (B) Immunofluorescent staining of OLIG2 (green) and CD44 (red) in human GBM tumors showing a mutually exclusive pattern of staining. Scale bar: 20 μm. The merged image of CD44/OLIG2 is shown on the right against 4',6-diamidino-2-phenylindole (DAPI) stained nuclei (blue). Enlarged inset is shown in the lower panel (scale bar: 20 μm). Quantification of staining in three random fields of three independent tumors and the p value from Chi Square test is shown on the right. (C) Representative IHC images of OLIG2 and CD44 expression in human GBM samples. Scale bar: 50 μm. The table to the right shows the number of tumors expressing OLIG2/CD44. Tumors were classified as low/negative, intermediate, or high depending on the extent of expression in the overall tumors. p value was calculated using Chi Square test. (D) Box plots showing the normalized median expression of OLIG2 and CD44 in TCGA tumors based on Phillips and TCGA classification. Boxes show median 25th and 75th percentile, while whiskers show the 5th and the 95th percentile. p value was determined using a non-parametric Wilcoxon test. See also Figure S3.
Figure 4
Figure 4. PN/CIMP+ and MES/CIMP GSCs Display Differential Sensitivity to Radiation
(A) Kaplan Meier curves showing survival of mice implanted with PN/CIMP+ (7–11 and 23) or MES/CIMP (20 and 267) GSCs at 5 × 10⁵ cells per mice with or without fractioned intracranial radiation (2.5 Gy × 4). t test was used to assess statistical significance. (B) Cell cycle analysis of GSCs treated with 6 Gy IR. The percentage of cells in the G2/M phase is indicated within each cell cycle plot. (C) γ-H2AX foci formation assay. Gray bars indicate number of foci after 6 h irradiation whereas black bars show foci after 24 h. At least 25 nuclei were counted. Error bar indicates +/− SEM. t test was used to assess statistical significant differences. *p < 0.05, **p < 0.005 (D) Percentage of cells that were positive for annexin V staining 96 hours post irradiation is shown as bar graphs. Gray bars indicate percentage of cells in untreated population whereas black bars show percentage of annexin V positive cells exposed to 6 Gy IR. Error bar indicates +/− SD. t test was used for statistical significance. **p < 0.005, NS = not significant (E) Neurosphere formation efficiency was determined by setting the number of spheres formed in control groups at 100% (gray bars) and compared to those exposed to 3 Gy IR (black bars). Error bar indicates +/− SD. t test was used for statistical significance. **p < 0.005. See also Figure S4.
Figure 5
Figure 5. TNFα Mediates MES Differentiation and Radio-Resistance in an NF-κB-Dependent Fashion
(A) FACS analysis of expression of CD15 and CD44 in GSC34 after 96 h treatment with 10 ng/ml of indicated cytokines. Percentage of cells in each quadrant is shown. (B) Expression of CD15 and CD44 after TNFα (96 h, 10 ng/ml) with or without pre-treatment with IκB-SR adenovirus of control RFP adenovirus 24 h prior to TNFα treatment by flow cytometry. Stacked bar shows percentage of CD15/CD44 expressing cells after various treatments. (C) Methylight profiling of GSCs after two weeks of TNFα treatment is shown. (D) The top twenty GO terms associated with 1.5 fold or greater TNFα induced genes in GSC11 ranked by lowest p value. Bar graphs show the number of genes overlapping between the GO category and the query gene list. The golden line is the DAVID functional analysis determined log10 of p values. (E) Cell cycle analysis of GSCs after treatments as indicated. The percentage of cells in the G2/M phase is indicated within each cell cycle plot. (F) Tumor volume measurement of GSC23-pCignal lenti-CMV-luc cells injected intracranially into Foxn1nu mice. Mice were imaged 2–3 weeks after implantation as the first timepoint (denoted as week 1) after which the radiation group received four cycles of 2.5 Gy IR on consecutive days. Mice were subject to intracranial administration of TNFα (2 ng/mice) 72 h prior to irrradiation and once every two weeks thereafter. Horizontal black bar shows average radiance (photons/s/cm2/sr) with various treatments and time points. Error bar indicates +/− SEM. t test was used to assess statistical significance. **p < 0.005. NS = not significant. See also Figure S5.
Figure 6
Figure 6. NF-κB Controls Master TFs of MES Differentiation in GSCs
(A) Western blot analysis of phosphorylated p65 (ser 536), total p65, phosphorylated STAT3 (Tyr 705), STAT3 and C/EBPβ in GSCs. (B) and (C) Western blot analysis using indicated antibodies were performed on GSC23 and 11 sorted for CD44high or CD44low subpopulations. (D) Box plots of normalized expression of STAT3, CEBPB, TAZ, and NF-κB metagene in CD44low (green boxes) or CD44high (red boxes) tumors from multiple datasets as indicated. Boxes show median 25th and 75th percentile, while whiskers represent the 5th and the 95th percentile. Outliers are shown as individual points. p value was determined using a non-parametric Wilcoxon test. For the NF-κB metagene, the average expression of 38 NF-κB family members and targets (see Supplemental Experimental Procedures) was condensed into a metagene and plotted. Wilcoxon signed-rank test was used to test statistical significance. (E) Time course western blot analysis of indicated antibodies after TNFα treatment in GSC11 transduced with RFP or IκB-SR adenovirus 24 h prior to TNFα treatment. (F) qRT-PCR analysis of MES signature master TFs STAT3, CEBPB and TAZ in GSC11 treated with TNFα with or without pre-treatment with RFP or IκBSR adenovirus. Error bar indicates +/− SD. t test was used for statistical significance. *p < 0.05 and **p < 0.005. (G) qRT-PCR analysis of YKL40, and CD44 after knockdown of all three master TFs (STAT3, C/EBPβ and TAZ) in GSC11 is shown. Cells were treated with siRNA 72 h prior to treatment with TNFα for an additional 24 h. Error bar indicates +/− SD. t test was used for statistical significance. *p < 0.05 and **p < 0.005. See also Figure S6.
Figure 7
Figure 7. MES Differentiation, CD44 Levels and NF-κB Activation are Predictive of Radiation Response in GBM
(A) Representative MRI scans of postoperative/pre-RT and post RT responses of patients typically classified as responder or non-responder. (B) Box plots showing the proportion of patients classified as responders or non-responders against the PN/MES metagene quartiles in all newly diagnosed GBM cases (n=149). Chi square test was used to assess statistical significance. (C) Box plot shown for IDH1 WT cases (n=121). (D) Kaplan Meier curves showing survival of newly diagnosed patients based on PN/MES metagene scores. Low MES represents the bottom one third of the cases whereas high MES were the top two thirds. Log rank test was used to assess statistical significance. (E) Kaplan Meier curves showing survival of newly diagnosed GBM-IDH1 WT patients based on PN/MES metagene scores. Bar graph shows the proportion of OLIG2 (F), CD44 (G), p-p65 (J), and COX2 (K) expression in newly diagnosed GBM-IDH1 WT patients classified as radiation responders or non-responders. Proportion of patients that responded/non-responded were compared using Chi Square test. Kaplan Meier curves showing survival of newly diagnosed GBM-IDH1 WT patients based on OLIG2 (H), CD44 (I) and COX2 (L) are shown below. See also Figure S7, Table S6–S8.
Figure 8
Figure 8. Features Associated with MES Differentiation Induced by NF-κB in GBM
(A) Consecutive five micron sections were stained for various markers by IHC. Two independent areas within a same tumor are shown for mutual exclusive expression of OLIG2 from CD44, p-p65 and IBA. Scale bar: 100 μm. (B) Cartoon showing a summary of our findings. We propose that GSCs when isolated from the microenvironment may differ in their molecular signatures from the parental tumor. While GBMs in the extreme ends of PN/MES axis will likely contain (and enrich for) GSCs with similar signatures to the parental tumor, GBMs with intermediate to high MES signatures enrich for PN GSCs that are maintained in a MES state in the human tumor microenvironment (by cell types such as macrophages/microglia). These PN GSCs also tend to be CIMP+ although derived from G-CIMP tumors which lack the IDH1 mutation. MES differentiation, CD44 enrichment, and radio-resistance can be induced in PN/CIMP GSCs by activation of NF-κB and downstream master TFs (STAT3, C/EBPβ, and TAZ). In contrast, MES GSCs are CIMP, predominantly express CD44, are radio-resistant, and exhibit constitutive activation of NF-κB and downstream master TFs. See also Table S9.

Similar articles

Cited by

References

    1. Acosta JC, O'Loghlen A, Banito A, Guijarro MV, Augert A, Raguz S, Fumagalli M, Da Costa M, Brown C, Popov N, et al. Chemokine signaling via the CXCR2 receptor reinforces senescence. Cell. 2008;133:1006–1018. - PubMed
    1. Ben-Neriah Y, Karin M. Inflammation meets cancer, with NF-kappaB as the matchmaker. Nat Immunol. 2011;12:715–723. - PubMed
    1. Bhat KP, Salazar KL, Balasubramaniyan V, Wani K, Heathcock L, Hollingsworth F, James JD, Gumin J, Diefes KL, Kim SH, et al. The transcriptional coactivator TAZ regulates mesenchymal differentiation in malignant glioma. Genes Dev. 2011;25:2594–2609. - PMC - PubMed
    1. Bredel M, Bredel C, Juric D, Duran GE, Yu RX, Harsh GR, Vogel H, Recht LD, Scheck AC, Sikic BI. Tumor necrosis factor-alpha-induced protein 3 as a putative regulator of nuclear factor-kappaB-mediated resistance to O6-alkylating agents in human glioblastomas. J Clin Oncol. 2006;24:274–287. - PubMed
    1. Bredel M, Scholtens DM, Yadav AK, Alvarez AA, Renfrow JJ, Chandler JP, Yu IL, Carro MS, Dai F, Tagge MJ, et al. NFKBIA deletion in glioblastomas. N Engl J Med. 2011;364:627–637. - PMC - PubMed

Publication types

MeSH terms

Substances

Associated data