. 2013 Oct 18:91:108-17.
doi: 10.1016/j.visres.2013.08.005. Epub 2013 Aug 27.

Pooling of first-order inputs in second-order vision

Affiliations

Pooling of first-order inputs in second-order vision

Zachary M Westrick et al. Vision Res. .

Abstract

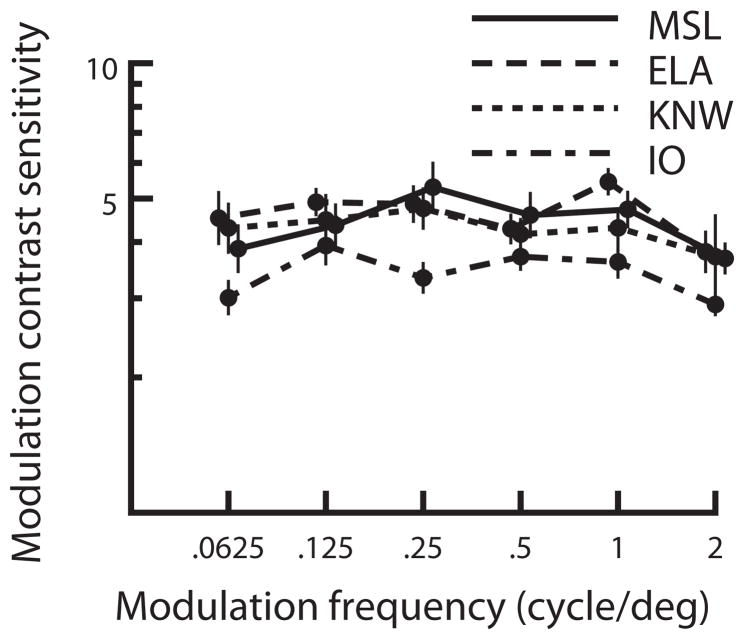
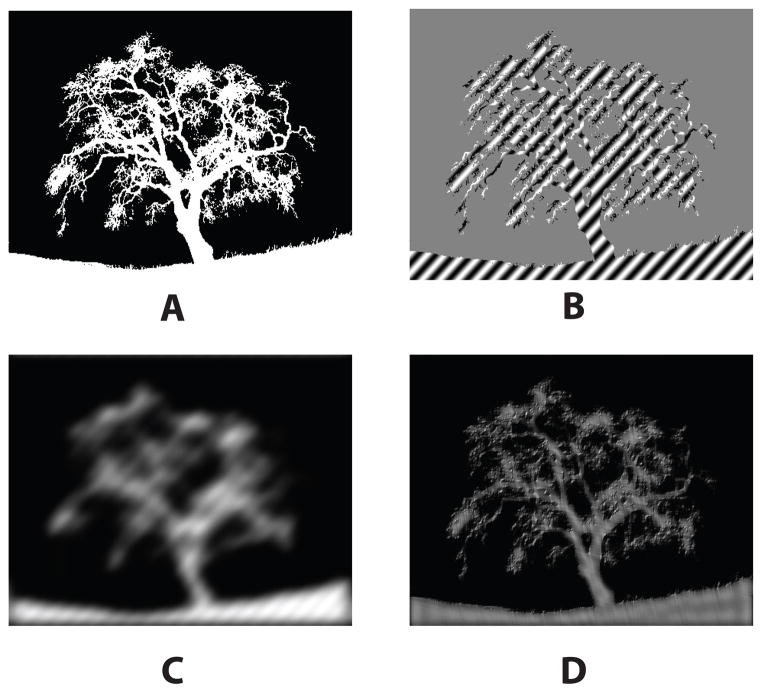
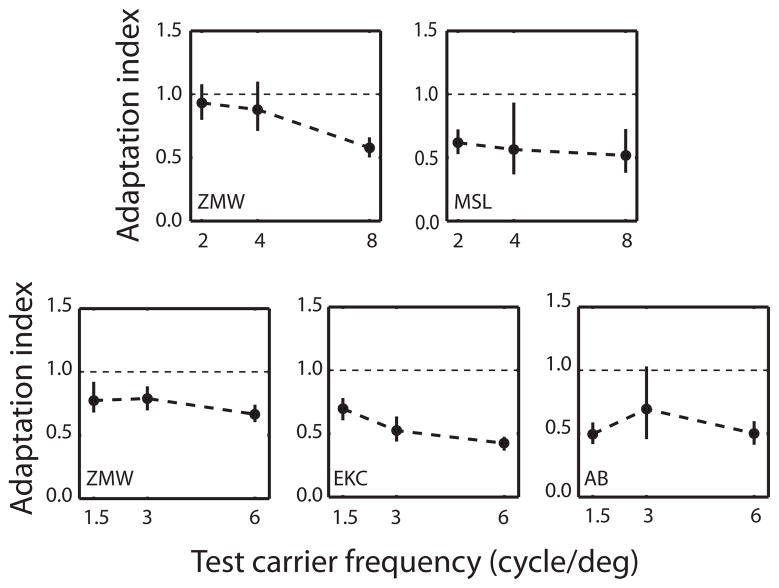
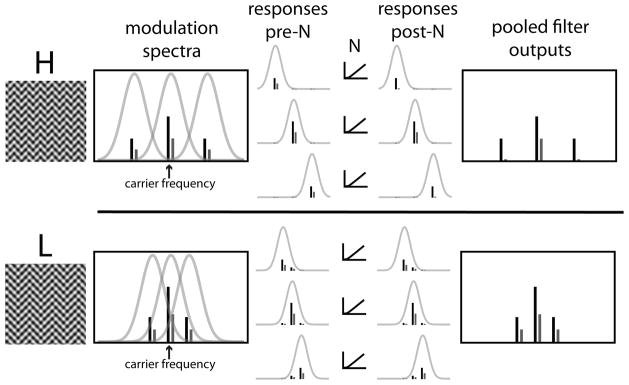
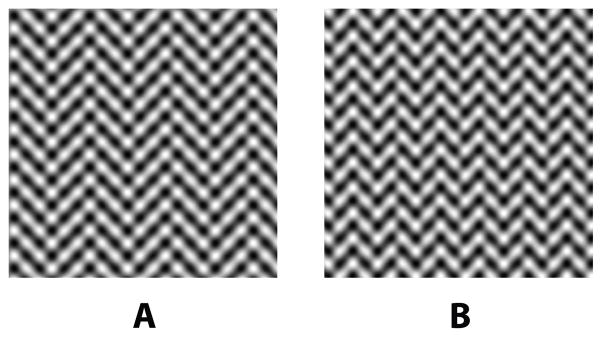
The processing of texture patterns has been characterized by a model that first filters the image to isolate one texture component, then applies a rectifying nonlinearity that converts texture variation into intensity variation, and finally processes the resulting pattern with mechanisms similar to those used in processing luminance-defined images (spatial-frequency- and orientation-tuned filters). This model, known as FRF for filter rectify filter, has the appeal of explaining sensitivity to second-order patterns in terms of mechanisms known to exist for processing first-order patterns. This model implies an unexpected interaction between the first and second stages of filtering; if the first-stage filter consists of narrowband mechanisms tuned to detect the carrier texture, then sensitivity to high-frequency texture modulations should be much lower than is observed in humans. We propose that the human visual system must pool over first-order channels tuned to a wide range of spatial frequencies and orientations to achieve texture demodulation, and provide psychophysical evidence for pooling in a cross-carrier adaptation experiment and in an experiment that measures modulation contrast sensitivity at very low first-order contrast.

Keywords: Second-order vision; Texture.


Figures

Figure 1
Figure 1
Schematic FRF model. The first stage consists of a bank of linear filters selective for one of the image’s carrier textures. Their responses are then rectified, creating a texture-intensity image. Finally, this texture-intensity image is processed by typical spatial-frequency- and orientation-tuned linear filters to detect any texture modulation.
Figure 2
Figure 2
(A) Example contrast-modulated stimulus. (B) A schematic of its Fourier transform. The distance of each sideband from the carrier is equal to the modulation frequency and the orientation of the displacement of these sidebands from the carrier is equal to the modulator orientation. With increasing modulator frequency, the sidebands will fall outside the bandwidth of the hypothetical first-stage filter (shown in (B) by the dotted line). (C) If the first-stage filter pools over many channels, high-frequency modulators will be less attenuated. Shown inset are the spatial filters corresponding to a single channel (B) and the resulting broad-bandwidth pooled channel (C). Note that as tuning bandwidth increases the size of the spatial receptive field becomes smaller, leading to reduced spatial blurring under the FRF model.
Figure 3
Figure 3
Predicted contrast sensitivity functions for three models of second-order processing: a single-channel FRF model, pooling before rectification and pooling after rectification.
Figure 4
Figure 4
Figure from Landy and Oruç (2002) showing nearly flat second-order contrast sensitivity functions for 4 subjects. Carrier frequency is 4 cycle/deg.
Figure 5
Figure 5
Effect of first-stage filtering and rectification. (A) A “first-order” tree. (B) Corresponding second-order tree using a diagonal carrier texture. (C) Filtering and rectification of (B) by a single first-order channel tuned to the carrier with typical bandwidth for V1 results in an extremely blurred tree. (D) Use of a broadband first-order filter produces a much sharper demodulated image. See Fig. 2 for examples of narrowly and broadly tuned first-stage filters.
Figure 6
Figure 6
Stimulus construction of orientation-modulated sine-wave gratings. Stimuli consist of sinusoidal carriers at 45° and 135° modulated in contrast with opposite phase and summed to produce an orientation-modulated image. The square root ensures that local root-mean-square contrast is constant across the image.
Figure 7
Figure 7
Block and trial structure. Before each block, the adapter was displayed for 100 s, with a new adapter with random modulator phase presented every 0.5 s. Each trial consisted of a 4 s top-up adapter followed by two 0.5 s test stimulus intervals, each preceded by a 250 ms blank interval. One test interval, chosen randomly, contained an unmodulated plaid and one contained a modulated grating. Test modulation frequency was always the same as for the adapter, but test carrier frequency could be either the same as the adapter’s (top row) or lower (bottom row), and test modulator orientation could be identical to the adapter or orthogonal. The subject’s task was to indicate which interval contained modulation.
Figure 8
Figure 8
Adaptation indices for all subjects in all conditions. Top row: 8 cycle/deg adapter carrier frequency. Bottom row: 6 cycle/deg adapter carrier frequency. Adaptation indices below one indicate cross-adaptation. Error bars represent 95% confidence intervals computed by bootstrap.
Figure 9
Figure 9
Example spectra for contrast-modulated sine waves at different modulation frequencies along with channels making up a proposed pooled first-stage filter. In the Fourier domain, contrast modulation is made up of energy at the carrier frequency along with two weaker sidebands, offset by an amount equal to the modulation frequency. In the case of contrast modulated gratings, 100% modulation contrast sidebands each have half the amplitude of the carrier. High and low frequency modulation spectra are shown for high (black bars) and low first-order contrast (grey bars). The proposed nonlinearity at the level of individual first-order channels is insensitive to very low contrasts and responds nearly linearly above this point. ‘Responses pre-N′ shows linear responses within each first-order channel, while ‘Responses post-N′ shows responses after application of the nonlinearity. When first-order contrast is high, this nonlinearity has no effect. For high-frequency modulation of low-contrast first-order gratings, this nonlinearity eliminates responses of channels tuned to the modulation sidebands. For low-frequency modulation of low-contrast first-order gratings, first-order channels tuned to the sidebands are sensitive enough to energy at the carrier frequency that their overall responses are not eliminated. As a result, modulation sidebands are lost at low contrast only for high-frequency modulations, leading to a predicted loss of sensitivity to high-frequency modulators at low first-order contrasts.
Figure 10
Figure 10
Example stimuli that share the same carrier frequency but differ in modulation frequency.
Figure 11
Figure 11
Ratio of orientation-discrimination thresholds for high- (1.5 cycle/deg) and low-frequency (0.5 cycle/deg) second-order gratings at three different first-order contrast levels. As first-order contrast is reduced, relative sensitivity to high-frequency second-order gratings is also reduced.
Figure 12
Figure 12
(A) Contrast-modulated white-noise grating. (B) FRF model CSFs in response to contrast modulation of white noise (solid: single-channel model; dashed: early-pooling model). For contrast-modulated white noise, pooling does not flatten the CSF to nearly the same degree as for orientation-modulated stimuli with sinusoidal carriers.

References

    1. Barbot A, Landy MS, Carrasco M. Exogenous attention enhances 2nd-order contrast sensitivity. Vision Research. 2011;51:1086–1098. - PMC - PubMed
    1. Barlow HB, Kaushal TP, Hawken M, Parker AJ. Human contrast discrimination and the threshold of cortical neurons. Journal of the Optical Society of America A. 1987;4:2366– 2371. - PubMed
    1. Bergen JR, Landy MS. Computational modeling of visual texture segregation. In: Landy MS, Movshon AJ, editors. Computational Models of Visual Processing. Cambridge, Mass: MIT Press; 1991. pp. 253–271.
    1. Blakemore C, Campbell FW. On the existence of neurones in the human visual system selectively sensitive to the orientation and size of retinal images. Journal of Physiology. 1969;203:237–260. - PMC - PubMed
    1. Dakin SC, Mareschal I. Sensitivity to contrast modulation depends on carrier spatial frequency and orientation. Vision Research. 2000;40:311–329. - PubMed

Publication types