. 2013 Sep 12;4(5):959-73.
doi: 10.1016/j.celrep.2013.07.043. Epub 2013 Aug 29.

Extensive cooperation of immune master regulators IRF3 and NFκB in RNA Pol II recruitment and pause release in human innate antiviral transcription

Affiliations

Extensive cooperation of immune master regulators IRF3 and NFκB in RNA Pol II recruitment and pause release in human innate antiviral transcription

Jonathan E Freaney et al. Cell Rep. .

Abstract

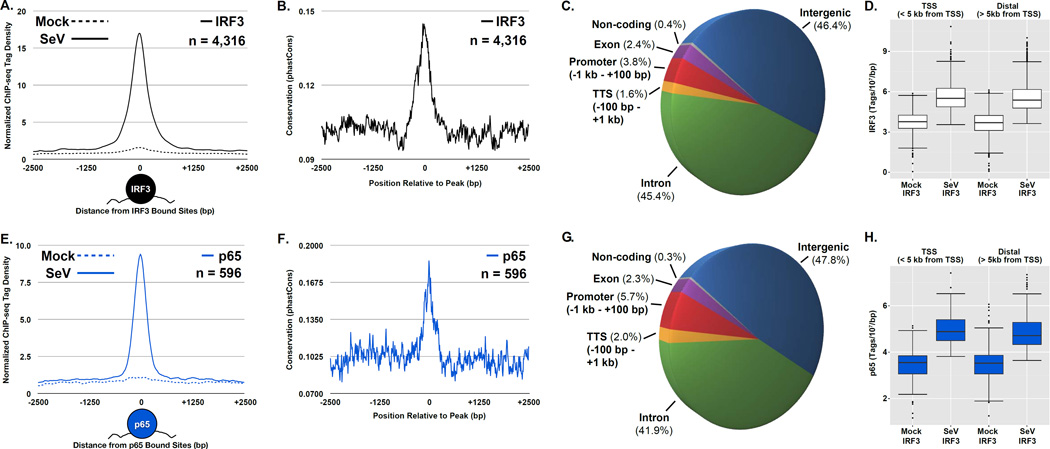
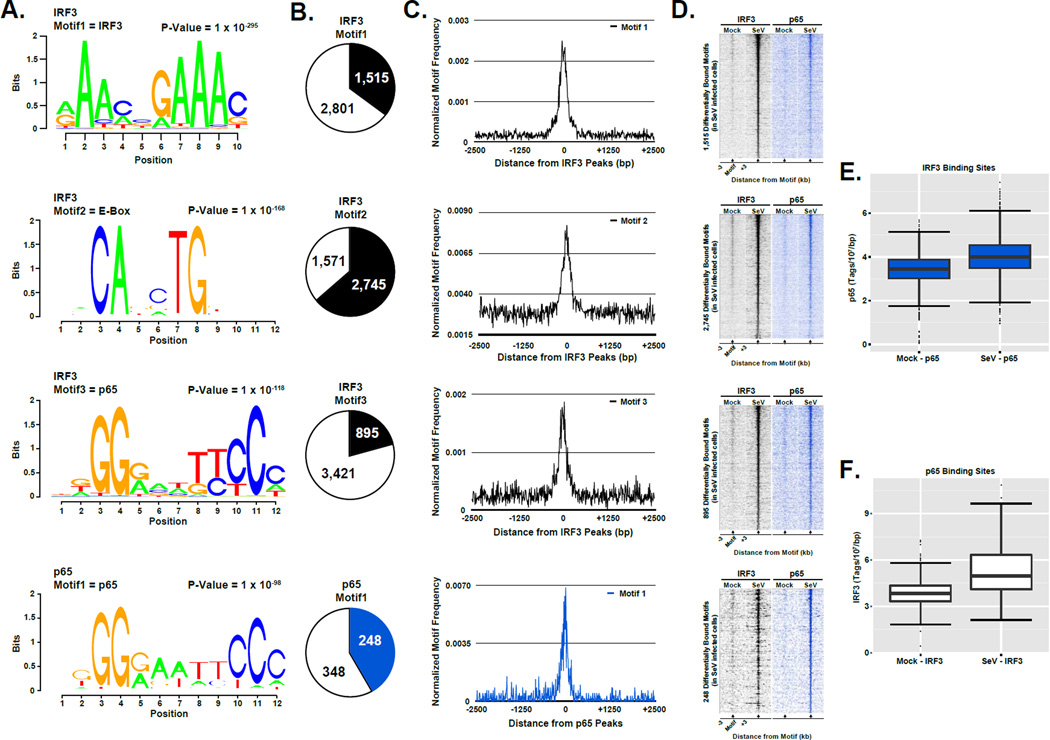
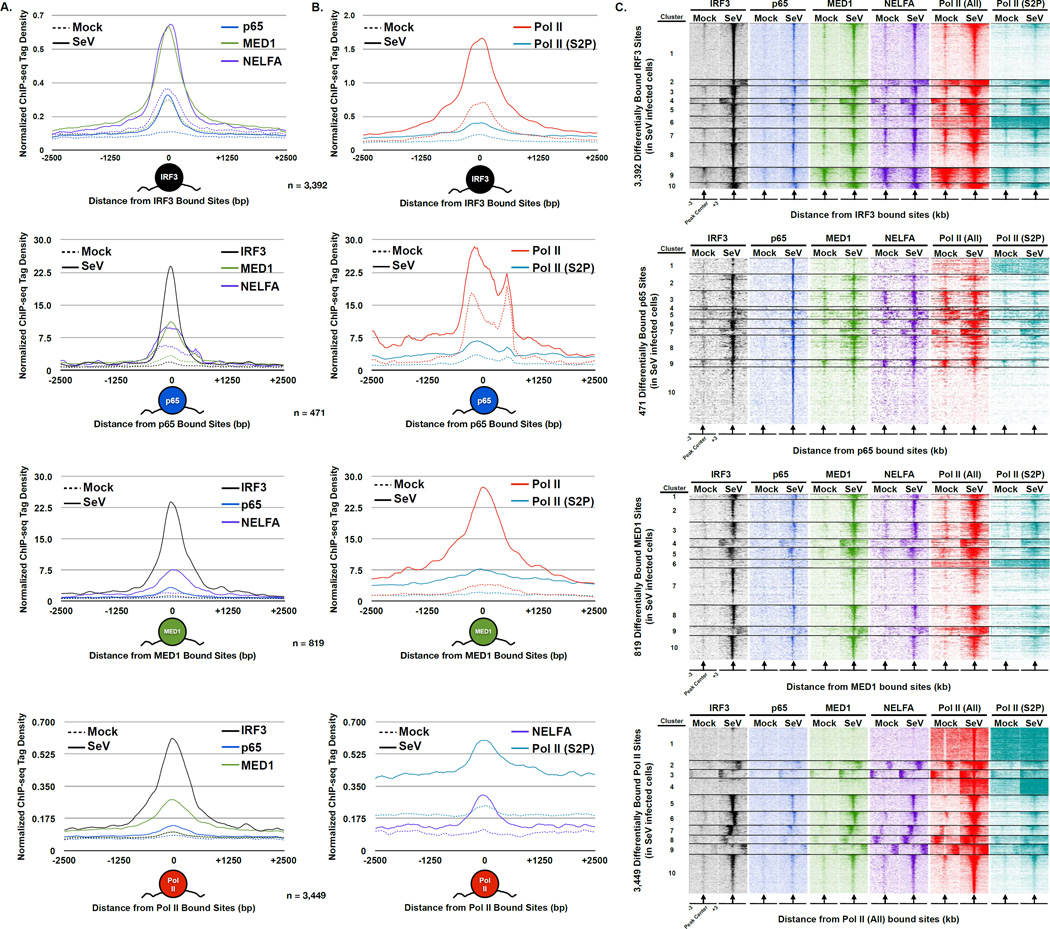
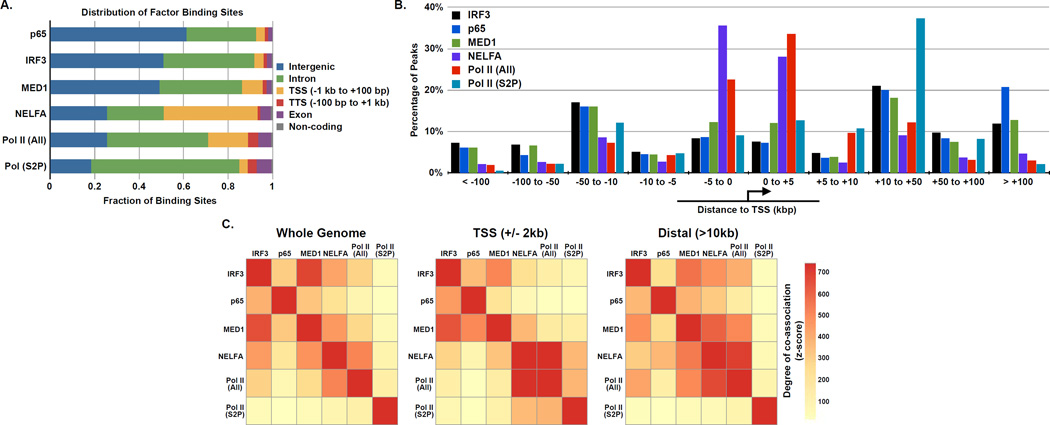
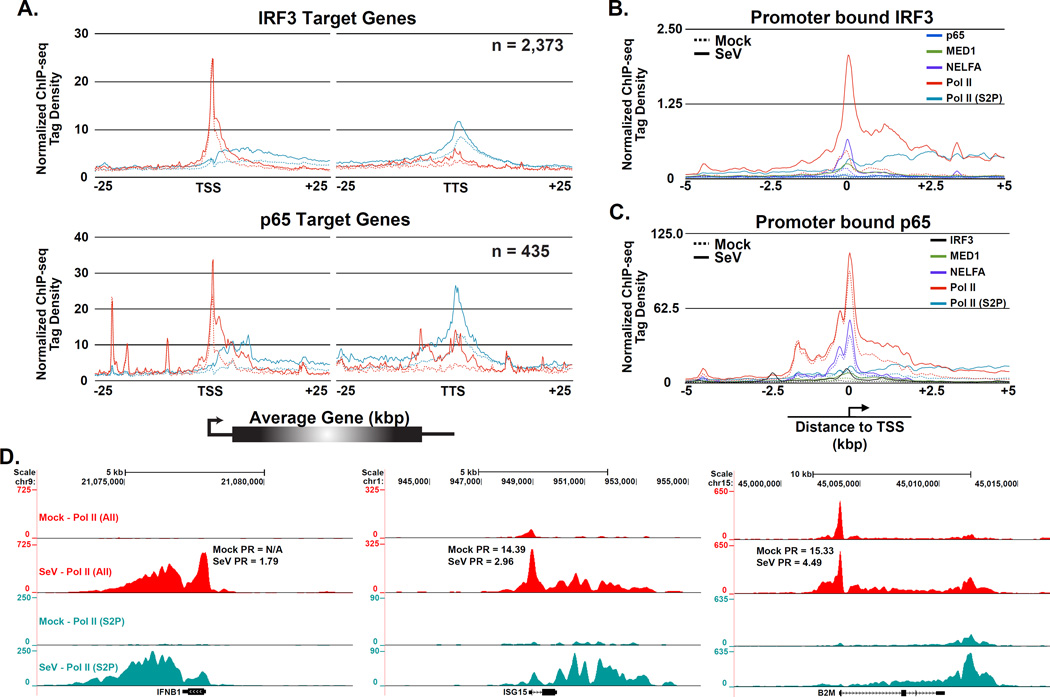
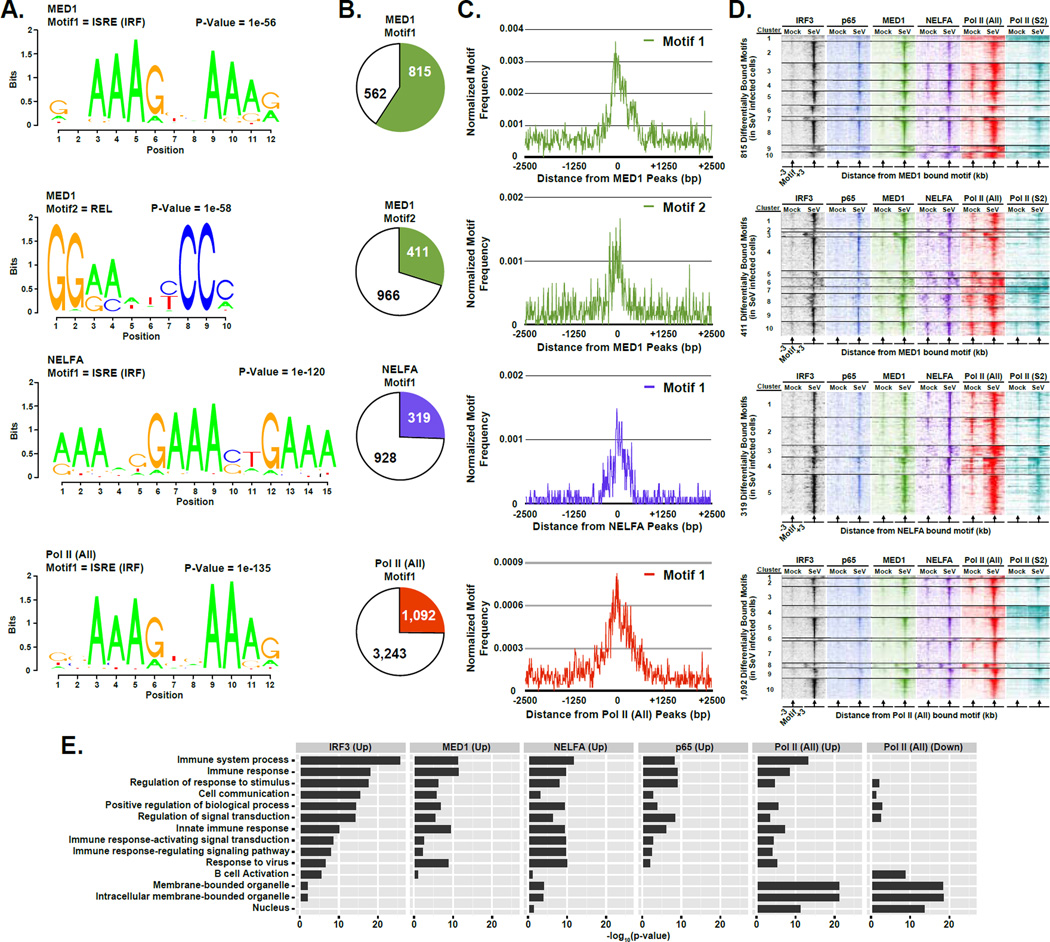
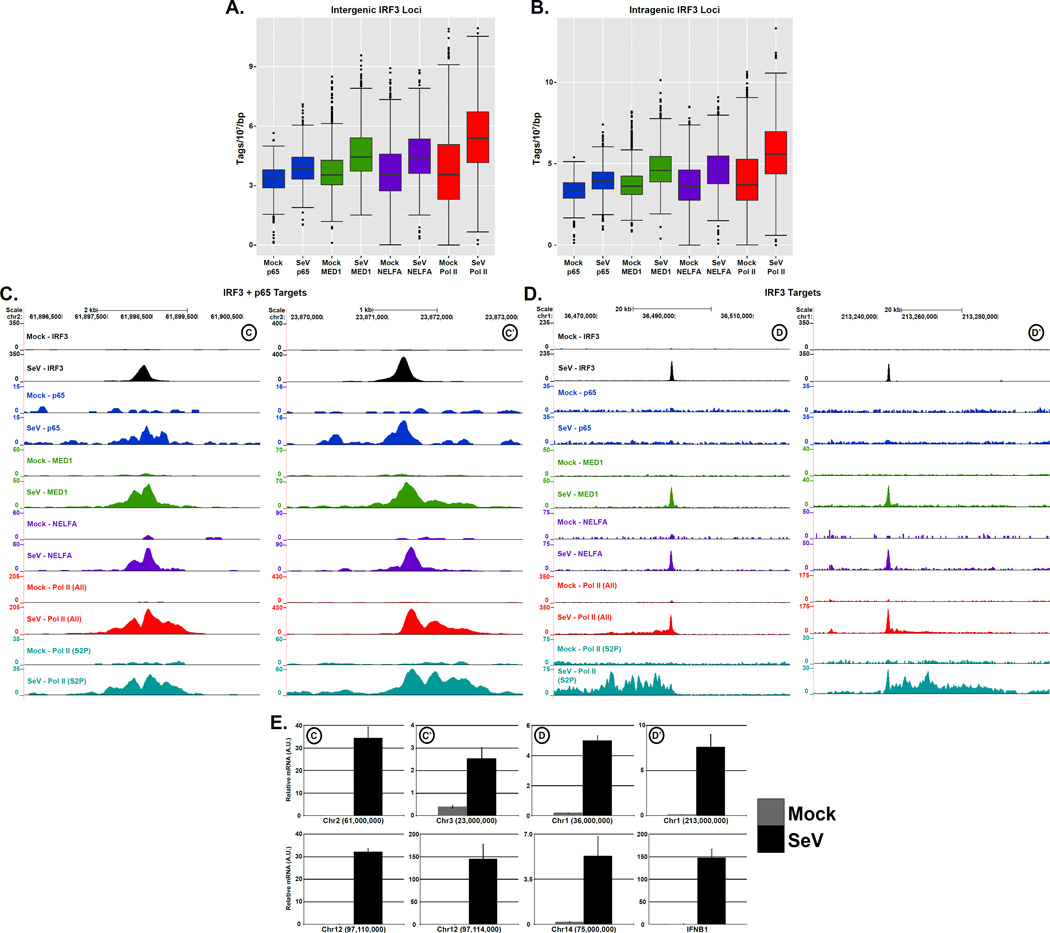
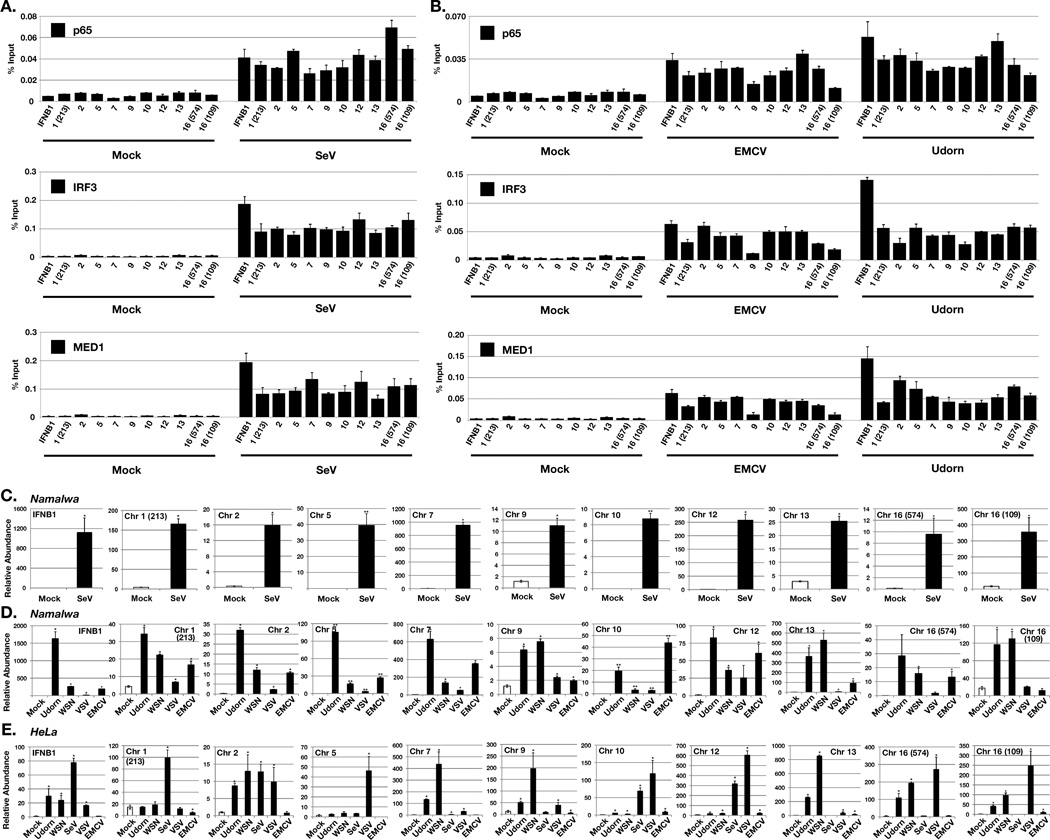
Transcription factors interferon regulatory factor 3 (IRF3) and nuclear factor κB (NFκB) are activated by external stimuli, including virus infection, to translocate to the nucleus and bind genomic targets important for immunity and inflammation. To investigate RNA polymerase II (Pol II) recruitment and elongation in the human antiviral gene regulatory network, a comprehensive genome-wide analysis was conducted during the initial phase of virus infection. Results reveal extensive integration of IRF3 and NFκB with Pol II and associated machinery and implicate partners for antiviral transcription. Analysis indicates that both de novo polymerase recruitment and stimulated release of paused polymerase work together to control virus-induced gene activation. In addition to known messenger-RNA-encoding loci, IRF3 and NFκB stimulate transcription at regions not previously associated with antiviral transcription, including abundant unannotated loci that encode novel virus-inducible RNAs (nviRNAs). These nviRNAs are widely induced by virus infections in diverse cell types and represent a previously overlooked cellular response to virus infection.


Figures

Figure 1
Figure 1. Virus activation of IRF3 and p65/RELA leads to widespread genome occupancy, see also Figure S2
(A & E) Plot of the mean IRF3 (A) or p65/RELA (E) sequencing tag density at steady state (dashed) and following virus infection (solid) for 4,316 or 596 genomic loci that exhibit ≥ 2-fold increase in occupancy following Sendai infection, respectively (p-value < 1 × 10⁻⁵). ChIP-seq enrichment signals are grouped into 10 bp bins and graph illustrates 2.5 kb from the peak center. Graphical representation of factor binding displayed under the plot. (B & F)Plot of the mean conservation scores at the differentially occupied IRF3 (B) or p65/RELA (F) regions defined in (A). Conservation score (grouped into 10 bp bins) represents the probability that a DNA sequence lies within a conserved element across all vertebrates (Siepel et al., 2005). (C & G) Pie chart illustrating the annotation distribution of the differentially bound IRF3 (C) or p65/RELA (G) regions described in (A). Binding sites are mapped to one of six annotation categories: Promoter (−1kb to +100bp), TTS (−100bp to +1 kb), exon, intergenic, intron, and non-coding, with the percentage of sites corresponding to each category displayed in parentheses near the label. (D & H) Boxplots of IRF3 (D) and p65/RELA (H) sequence reads ±1 kb centered at regions defined in (A), which are divided into TSS (< 5 kb from TSS) and distal (> 5 kb from TSS) regions. Changes between mean levels are significant for both IRF3 and p65/RELA (Welch’s two-tailed t test) at TSSs (p-value < 2.2 × 10⁻¹⁶) and distal regions (p-value < 2.2 × 10⁻¹⁶).
Figure 2
Figure 2. Enriched sequence motifs demonstrate IRF3 and p65/RELA co-occupancy and identify new potential regulatory partners, see also Figure S3
(A) Graphical representations of the most frequent DNA sequence motifs identified within the 4,316 differentially occupied IRF3 or 596 p65/RELA regions determined by the de novo motif discovery algorithm in the software suite HOMER (Heinz et al., 2010). Each DNA logo represents the information content/bp by height, with the p-value indicating statistical significance for the motif enrichment. P-values and the representative motif name found in the databases (JASPAR, Transfac, HOMER) are displayed above their corresponding motif. (B) Pie charts representing the frequency of each motif at the regions defined in (A) (± 100 bp from each peak center). Colored sections indicate the fraction of all differentially bound IRF3 (black) or p65/RELA (blue) genomic sites that contain at least one match to the indicated DNA sequence motif. The number of regions in which a match is present or absent is indicated. (C) Plot of the mean motif density at the regions defined in (A) within 2.5 kb of the peak center. Motif density signals are grouped into 10 bp bins. (D) Heatmap representation of IRF3 (black) and p65/RELA (blue) occupancy levels at the differentially occupied loci defined in (A) that encompasses the identified motif. Data are organized to illustrate 3 kb surrounding the motif center. Occupancy levels are rank ordered from most to least occupied according to the indicated factor. (E & F) Boxplots of p65/RELA (E) and IRF3 (F) sequence reads ±1 kb centered on the regions defined in (A). Changes between mean occupancy levels are significant for both p65/RELA (p-value < 2.2 × 10⁻¹⁶) and IRF3 (p-value < 2.2 × 10⁻¹⁶; Welch’s two-tailed t test)
Figure 3
Figure 3. Coordinated de novo assembly of Pol II and general transcription machinery with IRF3 and p65/RELA
(A) Plot of the mean IRF3 (black), p65/RELA (blue), MED1 (green), and NELFA (purple) sequence tag density at steady state (dashed lines) and following Sendai virus infection (solid lines). Only loci that exhibit ≥ 4-fold increase in occupancy following infection were included (p-value < 1 × 10⁻⁵); for IRF3 (n = 3,392), p65/RELA (n = 471), MED1 (n = 819), or Pol II (All; n = 3,449). ChIP-seq enrichment signals are grouped into 10 bp bins and graphs illustrate ± 2.5 kb. Graphical representation of bound factor displayed under plot. (B) Plot of the mean NELFA (purple), Pol II (All; red), and Pol II (S2P; teal) sequence tag density at steady state (dashed) and following Sendai virus infection (solid) at differentially bound loci defined in (A). Graphical representation of bound factor displayed under plot. (C) Heatmap representation of IRF3 (black), p65/RELA (blue), MED1 (green), NELFA (purple), Pol II (All; red), and Pol II (S2P; teal) occupancy levels at the differentially occupied loci defined in (A). Occupancy levels are rank ordered from most to least occupied according to the indicated factor and then divided into 10 sections by k-means clustering analysis. 3 kb surrounding the peak center (arrow) are illustrated.
Figure 4
Figure 4. Genome-wide occupancy and co-localization of virus induced transcription factors with general transcription machinery
(A) The distribution of genomic sites bound by IRF3, p65/RELA, MED1, NELFA, Pol II (All), and Pol II (S2P) in Sendai virus infected cells. (B) Distribution of virus-induced factor binding sites relative to the nearest annotated TSS. (C) Graphical representation of the co-association of virus-induced factors. The color strength represents the extent of association from red (strongest) to yellow (weakest). Left: whole genome analysis reveals factors have nonrandom associations with each other. Oriented analysis of promoter proximal (i.e., within 2 kb from the nearest TSS) or distal associations (i.e. > 10 kb from the nearest TSS) reveals more specific relationships (Center and Right, respectively).
Figure 5
Figure 5. Activated IRF3 participates in diverse Pol II regulatory paradigms, see also Figure S4
(A) Pol II pause release is a general feature of virus-induced gene expression. Plot of mean Pol II (All; red) and Pol II (S2P; teal) sequence tag density at steady state (dashed lines) and following Sendai virus infection (solid lines). Data are displayed in a 50 kb window surrounding the TSSs and TTSs of all IRF3 (top) or p65/RELA (bottom) target genes that exhibit ≥ 4-fold increase in factor occupancy following Sendai virus infection (p-value < 1 × 10⁻⁵). ChIP-seq enrichment signals are grouped into 150 bp bins. (B & C) De novo Pol II recruitment to IRF3 (B) and p65/RELA (C) target promoters. Plot of mean IRF3 (black), p65/RELA (blue), MED1 (green), NELFA (purple), Pol II (All; red), and Pol II (S2P; teal) sequence tag density at steady state (dashed lines) and following Sendai virus infection (solid lines). Data are displayed in a 10 kb window surrounding the TSSs of 200 promoters containing the greatest increases in IRF3 (B) or p65/RELA (C) occupancy after virus infection. ChIP enrichment signals are grouped into 25 bp bins. (D) Gene browser views of specific examples of virus-dependent recruitment of transcriptional machinery with distinct Pol II regulatory mechanisms. Displayed are the virus induced Ifnb1 (left), Isg15 (middle), and B2m (right) genes with their corresponding PR values.
Figure 6
Figure 6. IRF3 acts as a master regulator of innate immunity activated transcriptional networks
(A) Graphical representations of the most frequent DNA sequence motifs identified by HOMER within the 1,377 MED1-, 1,247 NELFA-, or 4,335 Pol II (All)-bound regions with ≥ 2-fold occupancy increase following virus infection (p-value < 1 × 10⁻⁵). Each DNA logo represents the information content/bp by height, with p-value indicating statistical significance for the motif enrichment. P-values and the representative motif name found in the databases (JASPAR, Transfac, HOMER) are displayed above their corresponding motif. (B) Pie charts representing the genomic DNA sequences of the bound regions described in (A) (± 100 bp from each peak center) scanned for matches to each of the motifs. Pie charts representing the distribution of motifs present in differentially bound MED1, NELFA, or Pol II (All) peaks. Colored sections indicate the fraction of bound MED1, NELFA, or Pol II (All) genomic sites that contain at least one match to the indicated DNA sequence motif. The number of regions in which a match is present or absent is indicated. (C) Plot of the mean motif density at bound regions described in (A) within 2.5 kb of the peak center. Motif density signals are grouped into 10 bp bins. (D) Heatmap representation of IRF3 (black), p65/RELA (blue), MED1 (green), NELFA (purple), Pol II (All; red), and Pol II (S2P; teal) occupancy levels at the differentially occupied loci defined in (A) that encompasses the identified motif. Data are organized to illustrate 3 kb surrounding the motif center. Occupancy levels are rank ordered from most to least occupied according to the indicated factor and divided into 5 or 10 sections by k-means clustering analysis (E) Enrichment of gene ontology (GO) categories among genes nearest IRF3, p65/RELA, MED1, NELFA, or Pol II (All) bound regions demonstrating ≥ 4-fold increase or decease (as noted) in occupancy following Sendai virus infection (p-value < 1 × 10⁻⁵). Representative GO categories are shown; the complete set of enriched GO categories is listed in Supplemental Table 5.
Figure 7
Figure 7. Virus-activated IRF3 and p65/RELA initiate transcription at novel genomic locations, see also Figure S5
(A & B) Boxplots of indicated sequence reads ±1 kb centered at IRF3 intergenic (A) or intragenic (B) regions demonstrating ≥ 4-fold increase in occupancy following SeV infection (p-value < 1 × 10 −5). Changes between mean levels are significant for all factors (Welch’s two-tailed t test) at both intergenic (p-value < 2.2 × 10⁻¹⁶) and intragenic sites (p-value < 2.2 × 10⁻¹⁶). (C & D) Examples of virus-dependent occupancy of IRF3+p65/RELA (C) or IRF3 (D) targets at unannotated loci. The IRF3, p65/RELA, MED1, NELFA, Pol II (All), and Pol II (S2P) occupancy at basal state and 4 h.p.i. are illustrated in genome browser views of virus-induced regions in chromosome 1, 2, and 3. (E) Induction of nviRNAs by Sendai virus infection. Cells were mock infected or infected (5 pfu/cell), and 5 × 10⁶ cells were harvested for RNA isolation, and random-primed RT-PCR was performed with primers for the indicated locus and GAPDH for normalization. Error bars denote standard deviation for triplicate PCR reactions. The top 4 graphs illustrate loci from panels C & D, and the bottom 4 graphs show additional regions, including those displayed in Figure S6 , and Ifnb1 as a control.
Figure 8
Figure 8. Novel sites of virus-induced transcription factor recruitment result in novel innate antiviral RNA transcription
(A & B) Namalwa cells were infected with (A) Sendai virus, (B) EMCV, or influenza A/Udorn/72 or mock infected for 10 hours and analyzed by ChIP (IRF3, p65/RELA, and MED1). Numbers on the x-axis refer to the nviRNA locus chromosome number, with numbers in parentheses to distinguish loci that are located on the same chromosome. Error bars denote standard deviation for triplicate PCR reactions. (C, D & E) nviRNA induction by Sendai virus, influenza A/Udorn/72 or A/WSN/33, VSV, and EMCV infection. (C & D) Namalwa and (E) HeLa cells were mock infected or infected (5 pfu/cell), and 5 × 10⁶ cells were harvested 10 h.p.i. for RNA isolation, and RT-PCR was performed with primers for the indicated nviRNA locus and GAPDH for normalization. Error bars denote standard deviation for triplicate PCR reactions. * indicates p≤0.05; ** indicates RNA was not detected in mock-infected cells.

References

    1. Adelman K, Kennedy MA, Nechaev S, Gilchrist DA, Muse GW, Chinenov Y, Rogatsky I. Immediate mediators of the inflammatory response are poised for gene activation through RNA polymerase II stalling. Proc Natl Acad Sci U S A. 2009;106:18207–18212. - PMC - PubMed
    1. Adelman K, Lis JT. Promoter-proximal pausing of RNA polymerase II: emerging roles in metazoans. Nat Rev Genet. 2012;13:720–731. - PMC - PubMed
    1. Agalioti T, Lomvardas S, Parekh B, Yie J, Maniatis T, Thanos D. Ordered recruitment of chromatin modifying and general transcription factors to the IFN-beta promoter. Cell. 2000;103:667–678. - PubMed
    1. Au WC, Moore PA, Lowther W, Juang YT, Pitha PM. Identification of a member of the interferon regulatory factor family that binds to the interferon-stimulated response element and activates expression of interferon-induced genes. Proc Natl Acad Sci U S A. 1995;92:11657–11661. - PMC - PubMed
    1. Chen FE, Huang DB, Chen YQ, Ghosh G. Crystal structure of p50/p65 heterodimer of transcription factor NF-kappaB bound to DNA. Nature. 1998;391:410–413. - PubMed

Publication types

MeSH terms