. 2013 Sep 12;4(5):1010-21.
doi: 10.1016/j.celrep.2013.07.039. Epub 2013 Aug 29.

Preconfigured, skewed distribution of firing rates in the hippocampus and entorhinal cortex

Affiliations

Preconfigured, skewed distribution of firing rates in the hippocampus and entorhinal cortex

Kenji Mizuseki et al. Cell Rep. .

Abstract

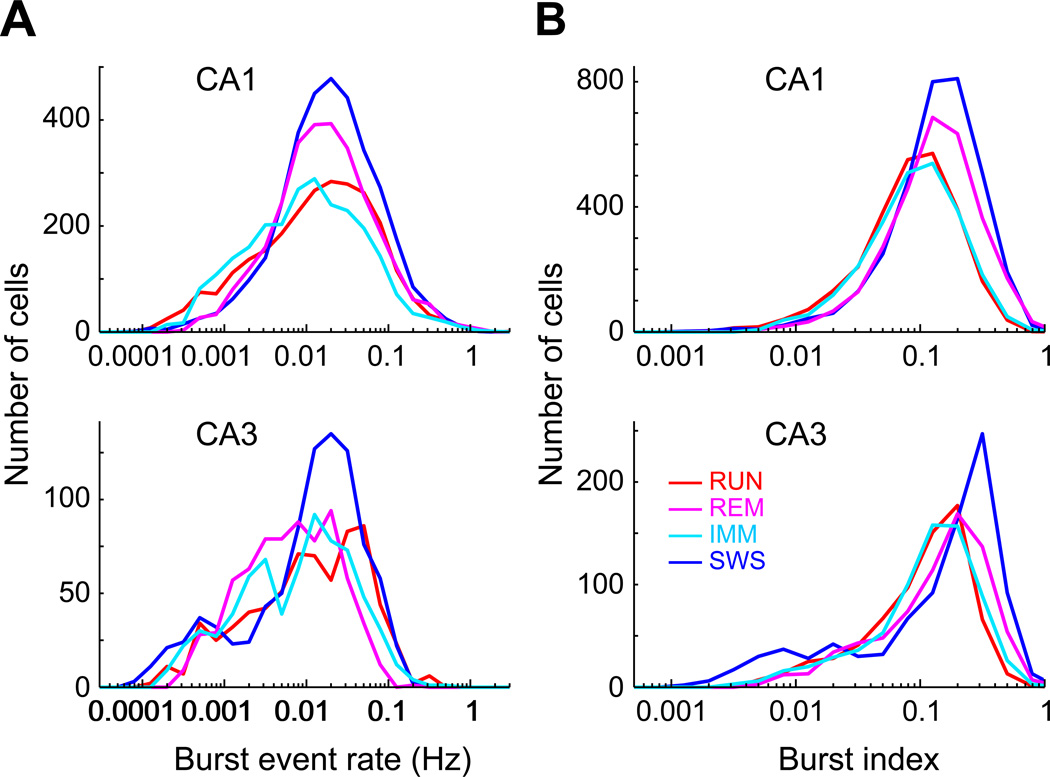
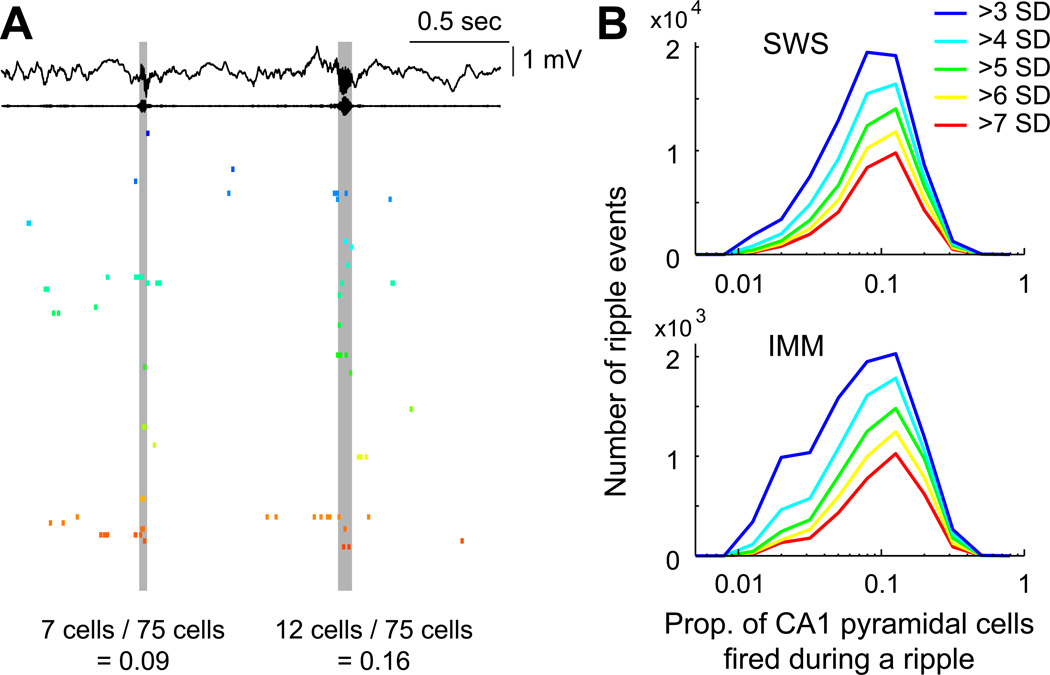
Despite the importance of the discharge frequency in neuronal communication, little is known about the firing-rate patterns of cortical populations. Using large-scale recordings from multiple layers of the entorhinal-hippocampal loop, we found that the firing rates of principal neurons showed a lognormal-like distribution in all brain states. Mean and peak rates within place fields of hippocampal neurons were also strongly skewed. Importantly, firing rates of the same neurons showed reliable correlations in different brain states and testing situations, as well as across familiar and novel environments. The fraction of neurons that participated in population oscillations displayed a lognormal pattern. Such skewed firing rates of individual neurons may be due to a skewed distribution of synaptic weights, which is supported by our observation of a lognormal distribution of the efficacy of spike transfer from principal neurons to interneurons. The persistent skewed distribution of firing rates implies that a preconfigured, highly active minority dominates information transmission in cortical networks.


Figures

Figure 1
Figure 1. Lognormal firing rate distribution of principal cells
(A) LFP and spiking activity of CA1 and EC neurons. Dots above the CA1 LFP during SWS represent ripple oscillations. Note trains of spikes followed by long silence periods in the waking rat and strong population synchrony during ripples. Colored ticks, principal neurons. Gray and black ticks (i), interneurons. (B) Distribution of firing rates of individual CA1 pyramidal cells in different brain states. Note log × axis. Distribution during RUN extends to both left and right relative to SWS. Dots, data; Lines, lognormal fit. (C) Lorenz plots of the distribution of firing rates. Inset: Illustration of the Gini coefficient. Gini coefficient is determined by dividing A (the area between the line of equity and the Lorenz curve) by the areas marked with A and B. (D) Gini coefficients in different hippocampal regions and EC layers in different brain states (mean ± S.E.M). Brackets indicate significant differences (p<0.05; ANOVA, followed by Tukey’s test). (B) to (D) Same color codes for brain states are used. See also Figure S1.
Figure 2
Figure 2. Spike bursts of principal cells in different brain states
(A) Distribution of burst event rate of individual CA1 and CA3 pyramidal cells in different brain states (3 spikes or more at ≤8 ms intervals). (B) Distribution of burst index (number of spikes in bursts divided by number of all spikes) of individual CA1 and CA3 pyramidal cells in different brain states. See also Figure S2.
Figure 3
Figure 3. Distribution of firing rates in place cells
(A) Distribution of mean within-field firing rates of CA1 and CA3 pyramidal cells on the square maze. (B) Distribution of peak firing rates in field. R’s in panels, correlation coefficients between session (RUN) firing rate and mean within-field rate or peak rate. Place fields were defined by >10% peak firing rate and spatial coherence > 0.7. See also Figure S3.
Figure 4
Figure 4. Firing rates are correlated with spike behavioral measures
(A) Relationship between log firing rate and stability index (pixel-by-pixel correlation of rate between the first and second half of a session in the square maze). (B) Relationship between log firing rate and spatial coherence. (C) Relationship between log firing rate and information rate. Black circles, place cells (10%, 0.7 coherence criteria). Gray circles, other neurons. Color lines indicate median values for original and downsampled rates. Only medians are shown for downsampled rates. See also Figure S4.
Figure 5
Figure 5. Skewed distribution of the magnitude of population synchrony during ripples
(A) Wide-band and ripple band (140–230 Hz) filtered LFP (top) and spiking activity of simultaneously recorded 75 CA1 pyramidal cells. Two ripple events with relatively low (0.09) and high (0.16) fraction of neurons firing synchronously during ripple. (B) Distribution of synchrony of CA1 pyramidal cells’ firing during ripples using various ripple detection thresholds (from small, >3 SD to large, >7 SD) during SWS and IMM. See also Figure S5.
Figure 6
Figure 6. Preserved firing rates of principal neurons across brain states and distinct environments
(A) Comparison of firing rates of the same neurons during SWS and REM in different hippocampal regions and EC layers. (B) Comparison of firing rates of the same neurons in different mazes. (C) Comparison of burst index in different mazes. (D) Comparison of firing rates during left and right runs on the linear track (‘global remapping’). (E) Firing rate comparison between RUN in familiar maze and SWS in the home cage either before or after the maze session. (F) Comparison of firing rate of the same neurons in familiar and novel mazes. (G) Comparison between firing rates during exploration of a novel maze (RUN) and SWS in the home cage either before or after the maze session. (A) to (G), each dot represents a single principal neuron. R-values are correlation coefficients of log firing rates. All correlations were significant (p < 0.00001). See also Figure S6
Figure 7
Figure 7. Spike transmission probability distributions in different brain states
(A) Monosynaptic drive of a putative interneuron by a pyramidal cell. Left: Superimposed filtered waveforms (800 Hz – 5 kHz) of a pyramidal cell (pyr) and an interneuron (int) triggered by a spiking of pyramidal cell. The two neurons were recorded from different silicon probe shanks. Right: Three example cross-correlograms showing short-latency, putative monosynaptic interactions between pyramidal-interneuron pairs (recorded from two different electrodes). The first example corresponds to the left filtered waveforms. Dashed red lines indicate 0.1% and 99.9% global confidence intervals estimated by spike jittering on a uniform interval of [±5,5] ms (Fujisawa et al., 2008), blue, mean. Note different magnitude probability scales. Bottom row: shuffling corrected histograms of the same neuron pairs. (B) Distribution of spike transmission probability values (note log scale) between CA1 pyramidal cells and putative interneurons in different brain states. Circled numbers indicate the probability values shown in panel A. (C) Comparison of spike transmission probability between RUN and SWS. Note larger values during RUN. Each dot represents single cell pair. (D) Spike transmission probability between principal cells and putative interneurons in the CA1, CA3 regions and entorhinal cortex (neuron pairs from EC layers were combined) in different brain states. Median, lower and upper quartiles are shown. Brackets indicate significant differences (P < 0.05, Kruskal-Wallis ANOVA, followed by Tukey’s honestly significant difference test). See also Figure S7.

References

    1. Arellano JI, Benavides-Piccione R, Defelipe J, Yuste R. Ultrastructure of dendritic spines: correlation between synaptic and spine morphologies. Front Neurosci. 2007;1:131–143. - PMC - PubMed
    1. Barth AL, Poulet JF. Experimental evidence for sparse firing in the neocortex. Trends Neurosci. 2012;35:345–355. - PubMed
    1. Bartho P, Hirase H, Monconduit L, Zugaro M, Harris KD, Buzsaki G. Characterization of neocortical principal cells and interneurons by network interactions and extracellular features. J. Neurophysiol. 2004;92:600–608. - PubMed
    1. Buzsaki G, Horvath Z, Urioste R, Hetke J, Wise K. High-frequency network oscillation in the hippocampus. Science. 1992;256:1025–1027. - PubMed
    1. Csicsvari J, Hirase H, Czurko A, Mamiya A, Buzsaki G. Oscillatory coupling of hippocampal pyramidal cells and interneurons in the behaving Rat. J. Neurosci. 1999;19:274–287. - PMC - PubMed

Publication types