. 2013 Oct 11;587(20):3327-34.
doi: 10.1016/j.febslet.2013.08.022. Epub 2013 Aug 28.

Modeling the estrogen receptor to growth factor receptor signaling switch in human breast cancer cells

Affiliations

Modeling the estrogen receptor to growth factor receptor signaling switch in human breast cancer cells

Chun Chen et al. FEBS Lett. .

Abstract

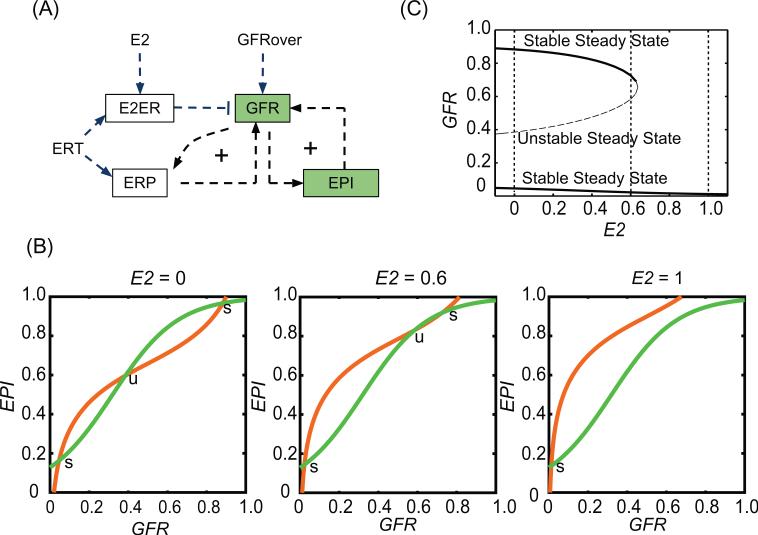
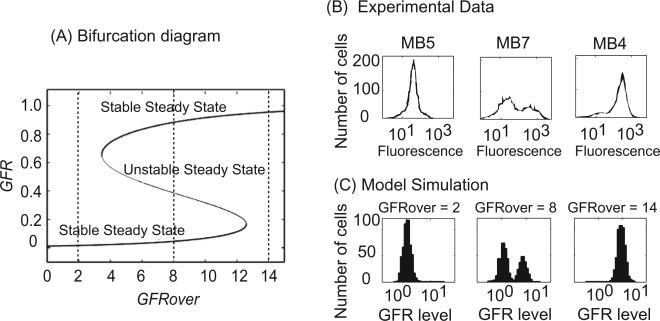
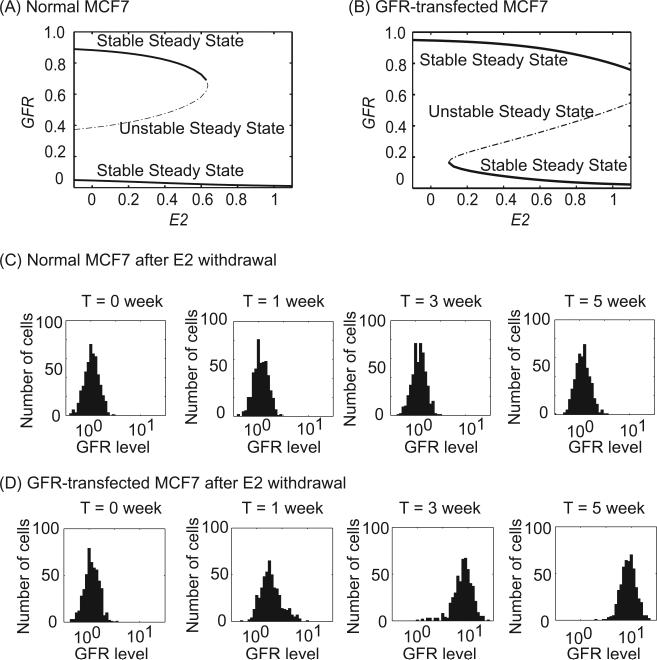
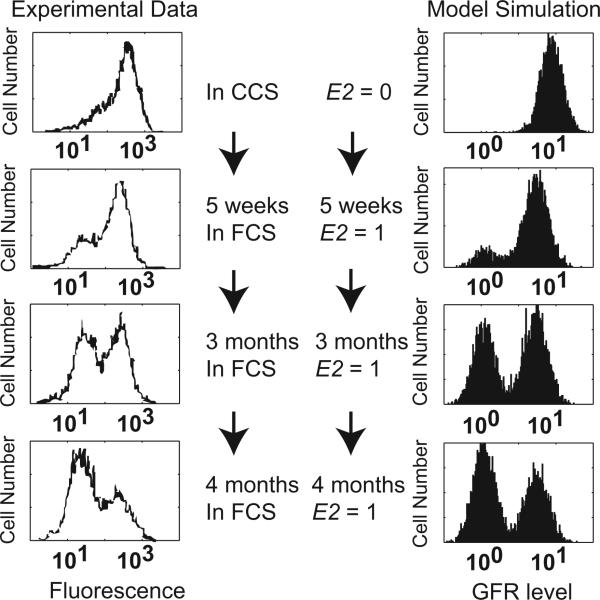
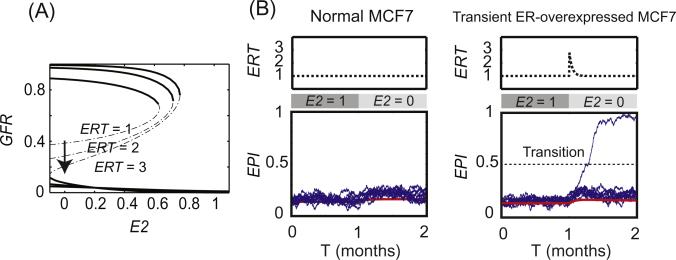
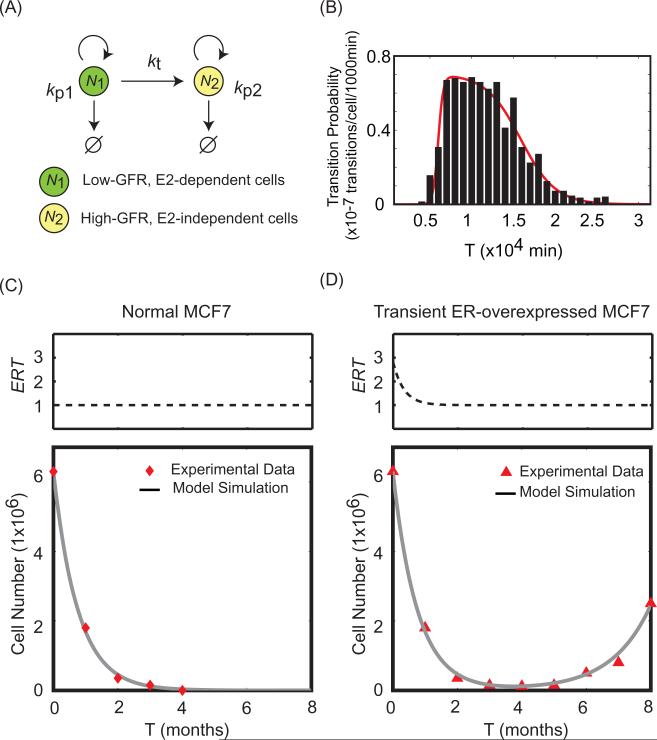
Breast cancer cells develop resistance to endocrine therapies by shifting between estrogen receptor (ER)-regulated and growth factor receptor (GFR)-regulated survival signaling pathways. To study this switch, we propose a mathematical model of crosstalk between these pathways. The model explains why MCF7 sub-clones transfected with HER2 or EGFR show three GFR-distribution patterns, and why the bimodal distribution pattern can be reversibly modulated by estrogen. The model illustrates how transient overexpression of ER activates GFR signaling and promotes estrogen-independent growth. Understanding this survival-signaling switch can help in the design of future therapies to overcome resistance in breast cancer.

Keywords: 17β-estradiol; AKT; Breast cancer; CCS; CSC; E2; E2-bound estrogen receptor; E2:ER; EGFR; ER; ER-P; Endocrine resistance; Estrogen receptor signaling; FCS; GFR; Growth factor receptor signaling; HER2; MAPK; Mathematical modeling; NFκB; PI3K; a serine/threonine-specific protein kinase, also known as Protein Kinase B (PKB); cancer stem cell; charcoal-stripped fetal-calf serum; epidermal growth factor receptor; estrogen receptor; fetal calf serum; growth factor receptor; human epidermal growth factor receptor-2; mTOR; mammalian target of rapamycin; mitogen activated protein kinases; nuclear factor kappa-light-chain-enhancer of activated B cells; phosphatidylinositide 3-kinases; phosphorylated estrogen receptor.


Figures

Fig. 1
Fig. 1
A model of the crosstalk between ER and GFR pathways exhibits bistable switching properties. (A) Influence diagram of the model. E2, estrogen level; ERT, total ERα level; E2ER, estrogen-dependent E2:ER complex; ERP, phosphorylated ER; GFR, growth factor receptor; EPI, epigenetic components in GFR pathway; GFRover, number of extra GFR gene copies. (B) Nullclines of the system at different E2 levels. s, stable steady state; u, unstable steady state. (C) Bifurcation diagram of GFR, with E2 as the bifurcation parameter. The curves trace the steady state level of GFR as a function of E2 level. For a given value of E2, a cell may express a low or high value of GFR (upper and lower solid lines; the middle dashed line indicates a branch of unstable steady states).
Fig. 2
Fig. 2
Three distribution patterns of GFR are exhibited in GFR-transfected MCF7. (A) Signal–response curve for GFR as a function of GFRover. The steady-state value of GFR is plotted as a function of GFRover (from 0 to 14). For intermediate values of GFRover, a cell may express either a low or high level of GFR (upper and lower solid lines; the middle dashed line indicates a branch of unstable steady states). (B) Different HER2 distribution patterns in HER2-overexpressed MCF7 sub-clones. Sub-clones MB5, MB7 and MB4 represent three typical distribution patterns of HER2 observed in experiment. Experimental data are adapted from [43]. (C) Distribution of GFR in 500 cells that are stochastically simulated at different values of GFRover (2, 8, and 14) for four months by starting from random initial conditions. GFR level = 10GFR in these histograms.
Fig. 3
Fig. 3
E2 withdrawal turns on GFR in GFR-transfected but not in normal MCF7 cells. (A, B) Bifurcation diagrams of GFR with E2 as bifurcation parameter in normal MCF7 cells (GFRover = 0) and in GFR-transfected MCF7 cells (GFRover = 5). (C, D) Temporal evolutions of GFR distribution under E2-withdrawal conditions for normal MCF7 cells (GFRover = 0) and for GFR-transfected MCF7 cells (GFRover = 5). In each case, 500 cells were simulated over the course of five weeks. GFR level = 10GFR in these histograms.
Fig. 4
Fig. 4
GFR bimodal distribution is reversibly controlled by different E2 levels. Left panel, experimental data adapted from [43]. The MB8 sub-clone of GFR-transfected MCF7 cells showing a bimodal HER2 distribution was treated with a series of E2 conditions: CCS, without E2, for 5 weeks; FCS, with E2, for 5 weeks, 3 months and 4 months. Right panel, model simulations, showing the distribution of GFR level in 5000 GFR-transfected MCF7 cells (GFRover = 5) under the same conditions as the experiments. GFR level = 10GFR in these histograms.
Fig. 5
Fig. 5
ER overexpression increases the probability of a survival-signaling switch. (A) Bifurcation diagram of GFR with E2 as bifurcation parameter at different ER levels (ERT = 1, 2 and 3). (B) Transient ER overexpression opens a time window for transitions from low to high GFR levels. Left panel, normal MCF7 cells show no transitions in stochastic simulations of 10000 cells (20 cells are plotted for illustration). Right panel, 80 transitions are observed within a short time window during transient ER overexpression in MCF7 cells (20 cells and one example of a transition are plotted for illustration). The pulse of ER overexpression is simulated by Eq. (1) in the manuscript. Red line, trace of a deterministic simulation; blue lines, traces of 20 stochastic simulations; the horizontal dotted line shows the threshold we set to score transitions (EPI = 0.5).
Fig. 6
Fig. 6
A population growth model shows the effects of transient ER overexpression. (A) Schematic representation of the population growth model. kp1, kp2 = (specific birth rate – specific death rate) for cell populations N1 and N2, respectively. kt = rate at which low-GFR cells switch to high-GFR cells. (B) Transition probability of MCF7 cells that transiently overexpress ER according to the survival-signaling switch model described in Fig. 5. Black bars, percentages of cells having transitions in given time intervals (1000 min); Red line, fitted curve showing how kt varies with time in ER-overexpressed MCF7 cells. (C) Experimental data (red diamonds) and simulation results (grey line) for the dynamics of total cell number in normal MCF7 cells after E2 depletion. (D) Experimental data (red triangles) and simulation results (grey line) for the dynamics of total cell number in transient ER-overexpressed MCF7 cells after E2 depletion. The pulse of ER overexpression is simulated by Eq. (1). Experimental data are adapted from [42].

References

    1. Alberts B. Garland Science. 4th ed xxxiv. New York: 2002. Molecular biology of the cell; p. 1548.
    1. Dickson RB, Lippman ME. Growth factors in breast cancer. Endocr. Rev. 1995;16(5):559–589. - PubMed
    1. Rimawi MF, Osborne CK. Breast cancer blocking both driver and escape pathways improves outcomes. Nature Reviews: Clinical Oncology. 2012;9(3):133–134. - PubMed
    1. Patani N, Martin LA, Dowsett M. Biomarkers for the clinical management of breast cancer: international perspective. Int. J. Cancer. 2013;133(1):1–13. - PubMed
    1. Musgrove EA, Sutherland RL. Biological determinants of endocrine resistance in breast cancer. Nat. Rev. Cancer. 2009;9(9):631–643. - PubMed

Publication types