. 2013 Oct;16(10):1484-91.
doi: 10.1038/nn.3509. Epub 2013 Sep 1.

Prefrontal neurons transmit signals to parietal neurons that reflect executive control of cognition

Affiliations

Prefrontal neurons transmit signals to parietal neurons that reflect executive control of cognition

David A Crowe et al. Nat Neurosci. 2013 Oct.

Abstract

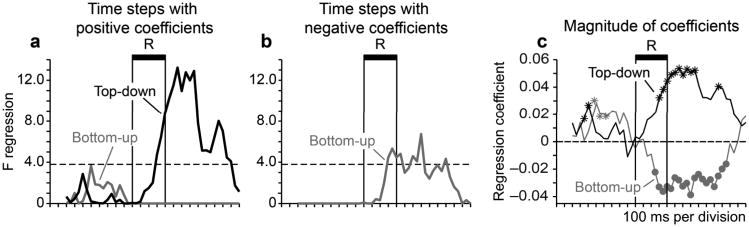
Prefrontal cortex influences behavior largely through its connections with other association cortices; however, the nature of the information conveyed by prefrontal output signals and what effect these signals have on computations performed by target structures is largely unknown. To address these questions, we simultaneously recorded the activity of neurons in prefrontal and posterior parietal cortices of monkeys performing a rule-based spatial categorization task. Parietal cortex receives direct prefrontal input, and parietal neurons, like their prefrontal counterparts, exhibit signals that reflect rule-based cognitive processing in this task. By analyzing rapid fluctuations in the cognitive information encoded by activity in the two areas, we obtained evidence that signals reflecting rule-dependent categories were selectively transmitted in a top-down direction from prefrontal to parietal neurons, suggesting that prefrontal output is important for the executive control of distributed cognitive processing.


Figures

Figure 1
Figure 1. Dynamic Spatial Categorization (DYSC) task, behavioral performance, and network representation of spatial categories
a, Stimulus sequence on a trial employing the horizontal (left/right) categorization rule. b, Stimulus sequence on a trial employing the vertical (above/below) categorization rule. c, d, Division of the circular sample array into horizontal categories under the horizontal rule (c) and vertical categories under the vertical rule (d). e, Proportion correct performance (black) and mean reaction time (gray) of Monkey 1 (solid lines) and Monkey 2 (dashed lines) under the horizontal and vertical categorization rules (error bars indicate ± s.e.). Response accuracy was significantly lower for vertical relative to horizontal categorization, both in Monkey 1 (z-test of proportions; n = 2506, z = 7.48, p < 0.0001) and Monkey 2 (n = 8988, z = 11.67, p < 0.0001). Responses were also significantly slower for vertical relative to horizontal categorization, both in Monkey 1 (2-tailed unpaired t-test; n = 1037, t = 2.04, p < 0.05), and Monkey 2 (n = 3536, t = 6.67, p < 0.0001). f–i Accuracy of decoding spatial categories based on the activity of neuronal ensembles (f, h) or neuronal populations (g, i) in prefrontal cortex (black) and posterior parietal cortex (gray). Black filled circles indicate time bins for which the proportion of correctly decoded trials in prefrontal cortex significantly exceeded that in parietal cortex (z-test of proportions, p < 0.05; n = 888, 124, 1294, 190 observations per bin for panels f, g, h, i). Gray filled circles indicate the converse. f, g, Accuracy of decoding vertical categories based on the activity of neural ensembles (f; n = 5 parietal and prefrontal ensembles, 74 trials per ensemble) or neural populations (g; n = 14 prefrontal and 18 parietal neurons, 74 trials).h, i, Accuracy of decoding horizontal categories based on the activity of neural ensembles (h; n = 6 ensembles in each area, 74 trials per ensemble) or neural populations (i; n = 16 prefrontal and 15 parietal neurons, 74 trials).
Figure 2
Figure 2. The transmission analysis applied to hypothetical ensembles containing two category-selective neurons in prefrontal and parietal cortex
a, b, Each open circle (numbered) illustrates the activity state of the prefrontal (a) and parietal (b) ensemble in a single 50 ms time bin as a point in a two-dimensional rate space (with the firing rates observed in neurons 1 and 2 plotted along the vertical and horizontal axes). Arrows connecting successive open circles illustrate the trajectory of each ensemble through its rate space over a short time span. Black filled circles indicate the mean firing rate observed in neurons 1 and 2 on ‘Above’ and ‘Below’ spatial category trials in the training data. Gray shading around each black circle represents the modeled Gaussian density of two-neuron activity patterns within each spatial category. Dashed lines (labeled a–d) indicate distances in the rate space between activity patterns observed in each time bin on a single trial and the mean activity pattern based on the training data associated with the correct category for this trial (the correct category is ‘Below’). c, d, Posterior probabilities associated with decoding the correct spatial category (‘Below’ on this trial) based on the activity pattern in each time bin in the prefrontal ensemble (c) and the parietal ensemble (d). Lower case letters associate posterior probabilities with corresponding distances in the rate space above (a, b).
Figure 3
Figure 3. Lag 1 transmission of category signals between prefrontal and parietal neurons
Red and blue functions plot the time-varying F-statistic obtained by regressing the residual posterior probabilities within a sliding window in one cortical area on the corresponding probabilities in the other area shifted earlier by one 50 ms time bin. The dashed horizontal line indicates significance for the F-statistic (p < 0.05). a, Top-down (red) and bottom-up (blue) transmission of vertical category signals. Black circles mark time bins in which the difference between top-down and bottom-up F values was significant (p <0.05) in a permutation test randomly shuffling neurons across cortical areas and repeating the analysis. Ensembles containing at least two vertical category-selective neurons in parietal and prefrontal cortex were included (n = 10 ensembles, 32 neurons. Parietal: 5 ensembles, 18 neurons. Prefrontal: 5 ensembles, 14 neurons). Regression results at each point are based on 4440 observations (posterior probabilities). Black and gray functions plot the mean posterior probability associated with the correct category when decoding was based on the activity of the prefrontal ensembles (‘PFC’; black line) and parietal ensembles (‘PAR’, gray line) included in the transmission analysis. The black horizontal bar above each panel (labeled ‘R’) indicates the duration of the rule cue. b, Top-down and bottom-up transmission of neural signals encoding horizontal categories (n = 12 ensembles, 31 neurons. Parietal: 6 ensembles, 15 neurons. Prefrontal: 6 ensembles, 16 neurons). Regression results at each point are based on 5250 observations (posterior probabilities).
Figure 4
Figure 4. Dependence of lag 1 transmission on the simultaneity of neuronal activity recorded in parietal and prefrontal cortex
Dashed and solid purple lines indicate the mean and 95% confidence interval of a bootstrap distribution of F statistics obtained in the transmission analyses after shuffling trials (100 iterations) to break the simultaneity of neural activity in parietal and prefrontal cortex. Horizontal dashed black line indicates the threshold for significance (p < 0.05) of the F-statistic. a, b, Top-down transmission of vertical (a) and horizontal (b) category signals based on decoded posterior probabilities (solid red lines) and mean ensemble firing rate (dashed red lines). c, d, Bottom-up transmission of vertical (c) and horizontal (d) category signals based on decoded posterior probabilities (solid blue lines) and mean ensemble firing rate (dashed blue lines).
Figure 5
Figure 5. Sign of top-down and bottom-up interactions at lag 1
Top-down (black) and bottom-up (gray) transmission of vertical category signals between ensembles containing a minimum of two vertical category-selective neurons in both prefrontal and parietal cortex (sample sizes are as described in the legend of Figure 3.) a, b, F-statistics were divided into separate time courses on the basis of whether the sign of the associated regression coefficient was positive (a) or negative (b) at each time step. c, Magnitude and sign of the regression coefficient associated with top-down (black) and bottom-up (gray) transmission of vertical category signals at each time step. Significance of regression coefficients was evaluated in a permutation test shuffling posterior probabilities within ensembles across trials to break the simultaneity of recording (500 iterations). We evaluated the significance at p < 0.05 (two-tailed). Asterisks indicate time bins in which the regression coefficient was significantly greater than the 97.5th percentile of the distribution of coefficients from the shuffled data. Circles indicate values lower than the 2.5th percentile.
Figure 6
Figure 6. Significance and sign of transmission as a function of the lag between vertical category signals in prefrontal and parietal cortex
a, b, Time courses plot the F-statistic associated with top-down (a) and bottom-up (b) transmission of vertical category signals at a range of time delays between cortical areas, expressed as a number of 50 ms time bins, ranging from lag 0 to lag 8 (400 ms). c, d, The sign and magnitude of the mean significant regression coefficients averaged over the rule and subsequent delay periods obtained in the analysis of top-down (c) and bottom-up (d) transmission. Open circles indicate individual coefficients contributing to each average. Bars marked by an asterisk indicate that the corresponding mean coefficient was significantly different from 0 (sign test, p < 0.05). Lags with no bars indicate absence of any significant F statistics in the transmission time course at those lags. Transmission analyses were based on ensembles containing a minimum of two vertical category-selective neurons (sample characteristics are as described in the legend of Figure 3).
Figure 7
Figure 7. Network transmission of vertical category signals is modulated by behavioral performance
Influence of recent reward on the strength of vertical category signal transmission. For each trial under the vertical categorization rule, we computed the proportion of the previous 10 trials that had been rewarded under the vertical categorization rule. We then divided trials into high and low recent reward groups on the basis of whether the proportion of recent reward on the vertical rule was above or below the median value over all trials (0.4). a, Time courses (with shading) compare F statistics associated with top-down transmission of vertical category signals on high recent reward trials and low recent reward trials. Filled black circles indicate time bins in which the difference between reward conditions was significant (p < 0.05) in a permutation test repeating the transmission analysis after randomly shuffling trials across reward condition (100 iterations). Black (‘PFC’) and gray (‘PAR’) time courses illustrate the mean posterior probability obtained from ensemble decoding in prefrontal and parietal cortex on high recent reward (solid lines) and low recent reward (dashed lines) trials. b, Time courses (with shading) illustrate F statistics associated with bottom-up transmission of vertical category signals on high recent reward trials and low recent reward trials (conventions as in panel a). Transmission analyses were based on ensembles containing a minimum of two vertical category-selective neurons (sample sizes are as described in the legend of Figure 3).

Comment in

References

    1. Medalla M, Barbas H. Diversity of laminar connections linking periarcuate and lateral intraparietal areas depends on cortical structure. Eur J Neurosci. 2006;23:161–179. - PubMed
    1. Schwartz ML, Goldman-Rakic PS. Callosal and intrahemispheric connectivity of the prefrontal association cortex in rhesus monkey: relation between intraparietal and principal sulcal cortex. J Comp Neurol. 1984;226:403–420. - PubMed
    1. Cavada C, Goldman-Rakic PS. Posterior parietal cortex in rhesus monkey: II. Evidence for segregated corticocortical networks linking sensory and limbic areas with the frontal lobe. J Comp Neurol. 1989;287:422–445. - PubMed
    1. Andersen RA, Asanuma C, Essick G, Siegel RM. Corticocortical connections of anatomically and physiologically defined subdivisions within the inferior parietal lobule. J Comp Neurol. 1990;296:65–113. - PubMed
    1. Goldman-Rakic PS. Circuitry of primate prefrontal cortex and regulation of behavior by representational memory. In: Mountcastle VB, Plum F, Geiger SR, editors. Handbook of Physiology The Nervous System Higher Functions of the Brain. Am. Physiol. Soc.; Bethesda, MD: 1987. pp. 373–417.

Publication types