. 2013 Oct;45(10):1198-206.
doi: 10.1038/ng.2746. Epub 2013 Sep 1.

Epigenetic memory at embryonic enhancers identified in DNA methylation maps from adult mouse tissues

Affiliations

Epigenetic memory at embryonic enhancers identified in DNA methylation maps from adult mouse tissues

Gary C Hon et al. Nat Genet. 2013 Oct.

Abstract

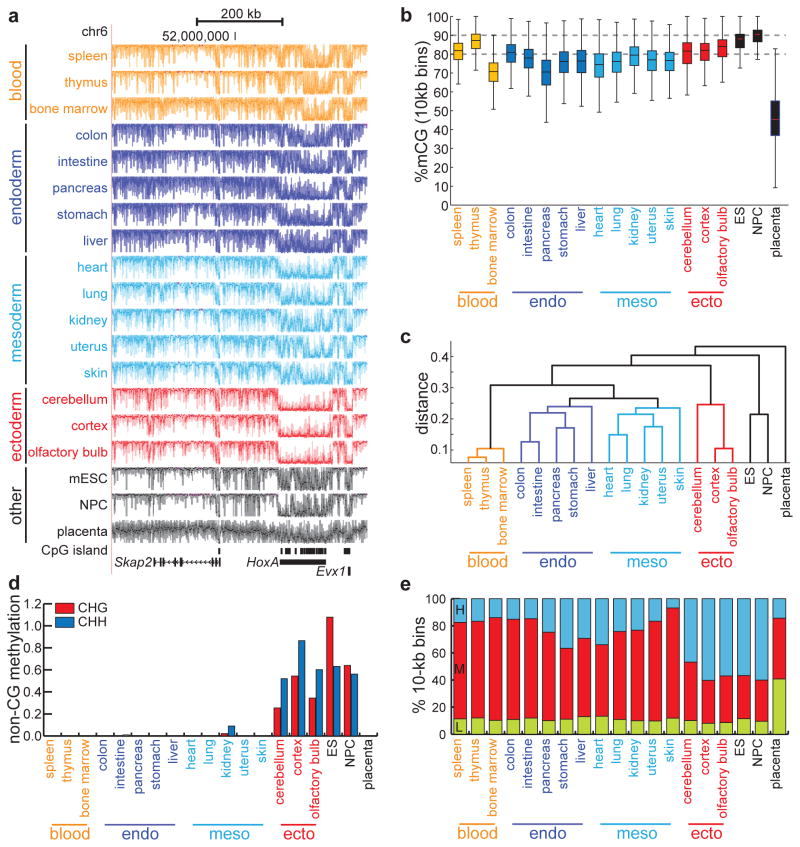
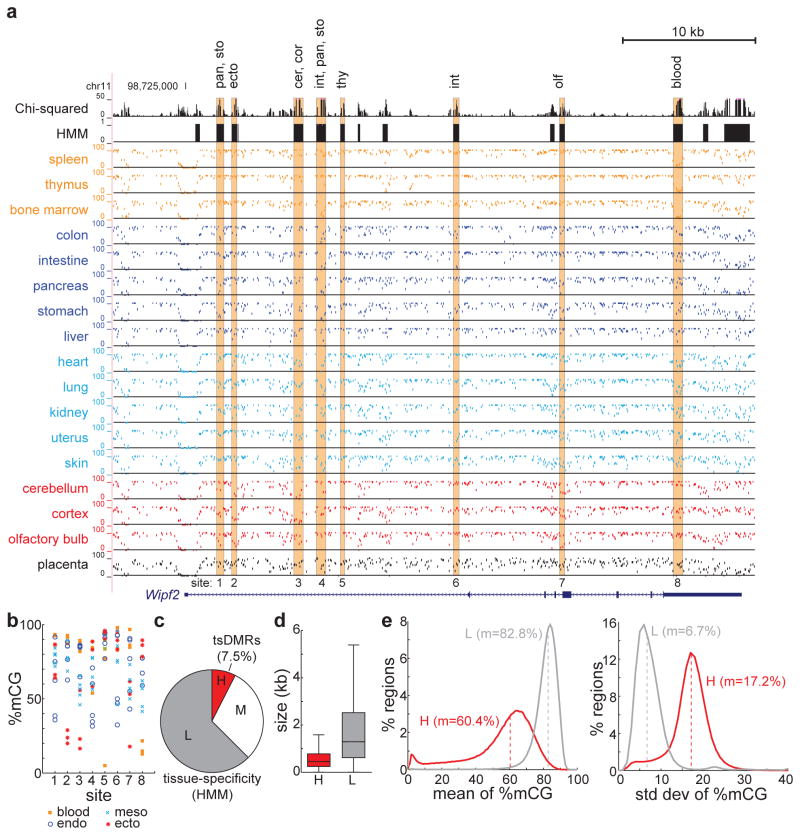
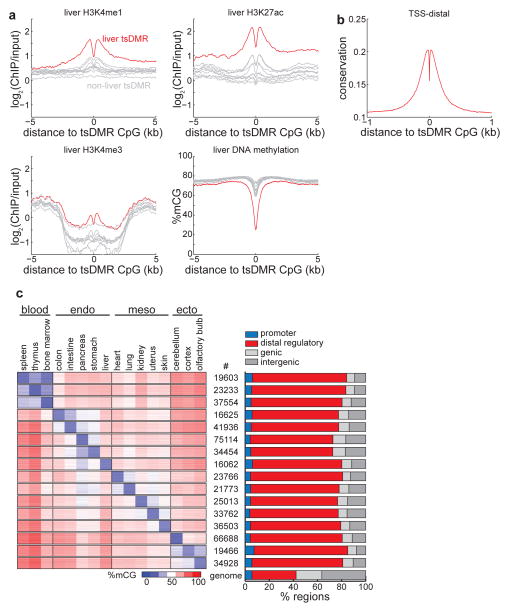
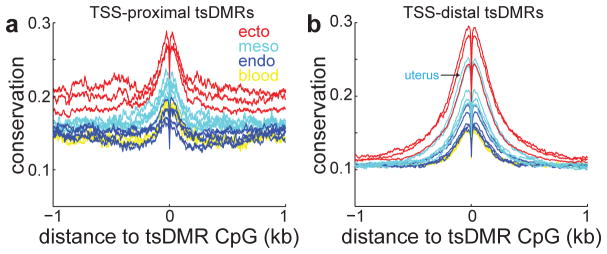
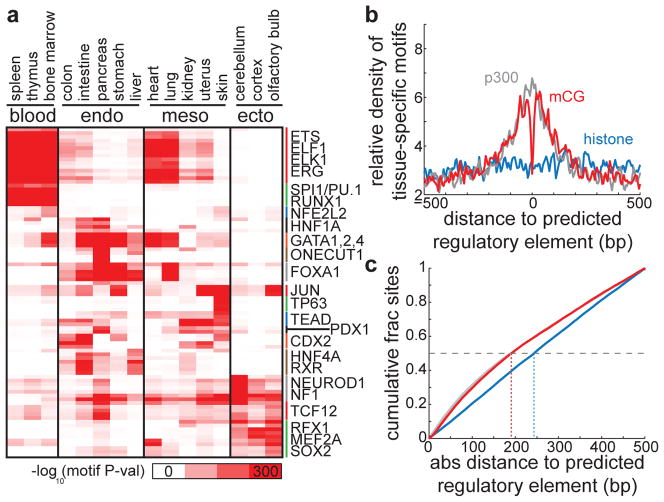
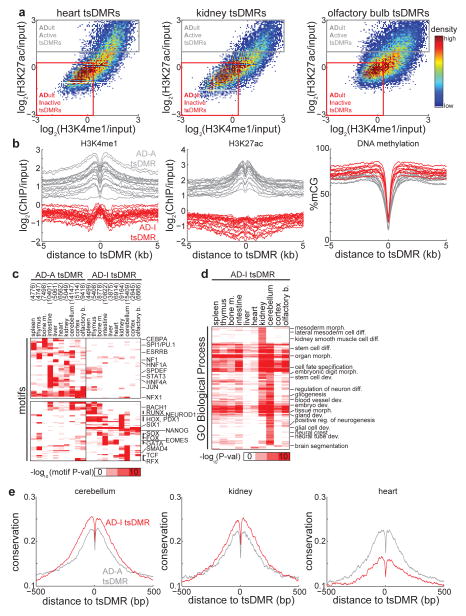
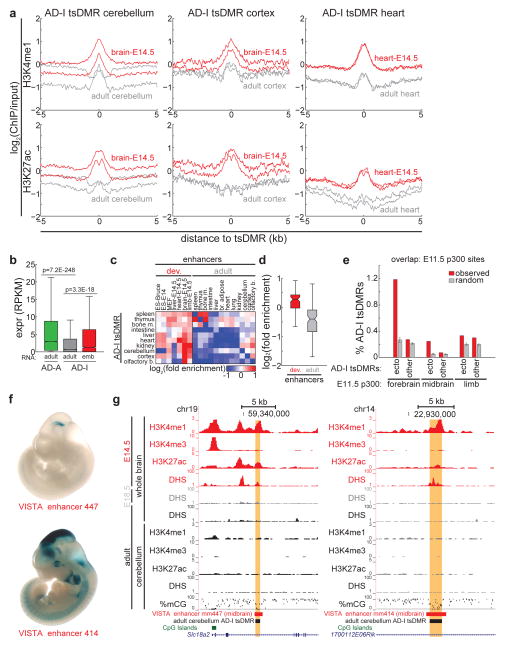
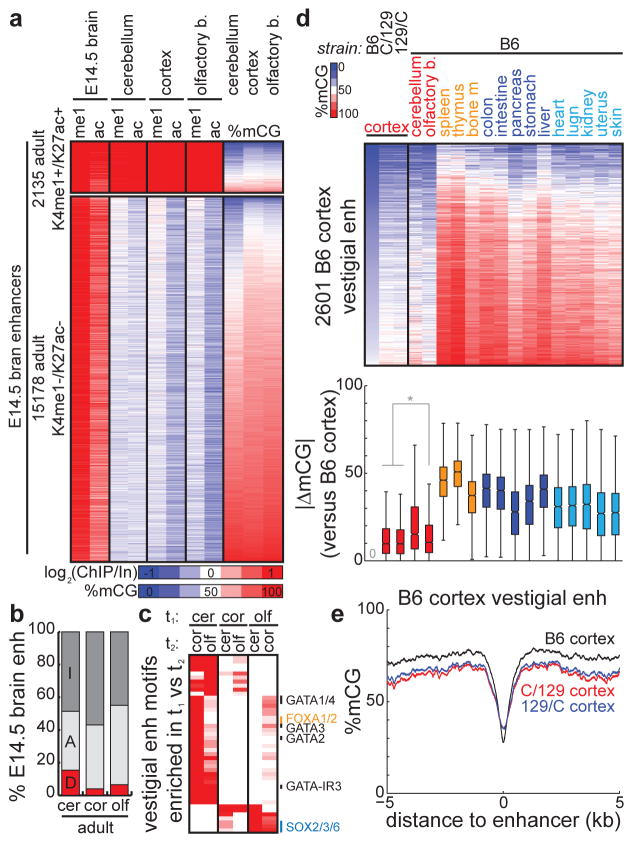
Mammalian development requires cytosine methylation, a heritable epigenetic mark of cellular memory believed to maintain a cell's unique gene expression pattern. However, it remains unclear how dynamic DNA methylation relates to cell type-specific gene expression and animal development. Here, by mapping base-resolution methylomes in 17 adult mouse tissues at shallow coverage, we identify 302,864 tissue-specific differentially methylated regions (tsDMRs) and estimate that >6.7% of the mouse genome is variably methylated. Supporting a prominent role for DNA methylation in gene regulation, most tsDMRs occur at distal cis-regulatory elements. Unexpectedly, some tsDMRs mark enhancers that are dormant in adult tissues but active in embryonic development. These 'vestigial' enhancers are hypomethylated and lack active histone modifications in adult tissues but nevertheless exhibit activity during embryonic development. Our results provide new insights into the role of DNA methylation at tissue-specific enhancers and suggest that epigenetic memory of embryonic development may be retained in adult tissues.


Conflict of interest statement

Competing financial interests

The authors declare no competing financial interests.

Figures

Figure 1
Figure 1. Distinct tissue-specific methylomes
(a) UCSC Genome Browser snapshot of DNA methylomes, derived from tissues of a single mouse, near the HoxA locus. Each track spans %mCG values between 0% and 100%. Tracks are colored by tissue type, as determined by the clustering in (c). (b) Boxplots of the %mCG distributions for each tissue, calculated from non-overlapping 10-kb bins spanning the mouse genome. Boxplot edges indicate the 25th and 75th percentiles, and whiskers indicate non-outlier extremes. (c) Dendrogram constructed from 1-kb regions exhibiting significant tissue-specific methylation (p = 0.001, χ2 test). Distance is measured as 1 − Pearson correlation coefficient. (d) Global abundance of methylation in non-CG context, expressed as the difference between the fraction of non-CG cytosines that are methylated and the bisulfite non-conversion rate. (e) Abundance of large domains bearing low (L), medium (M), or high (H) methylation, as determined by hidden Markov models independently trained on each tissue.
Figure 2
Figure 2. Identification of tissue-specific methylated regions
(a) UCSC Genome Browser snapshot of tsDMRs identified by HMM segmentation of the Chi-squared statistic for methylation variation (top two tracks). The tissue-specificity of highlighted tsDMRs is indicated above. (b) Quantification of DNA methylation abundance at tsDMRs from (a). (c) A hidden Markov model was used to segment the mouse genome into regions of low (L, grey), medium (M, white), and high (H, red) tissue-specificity of DNA methylation. Shown is the fraction of the genome spanned by these regions, with the H group denoting tsDMRs. (d) The size distribution of tsDMRs (H, red) and non-tsDMRs (L, grey). Boxplot edges indicate the 25th and 75th percentiles, and whiskers indicate non-outlier extremes. (e) The distribution of average (left) and standard deviation (right) of %mCG, for tsDMRs (H, red) and non-tsDMRs (L, grey). Dashed lines indicate the median, m.
Figure 3
Figure 3. Tissue-specific methylated regions are predominantly regulatory elements
(a) Enrichment of H3K4me1 (top left), H3K4me3 (bottom left), H3K27ac (top right), and DNA methylation (bottom right) in liver cells for liver tsDMRs (red) and tsDMRs identified in other tissues (grey). Bone marrow is immediately below liver in the H3K4me3 plot. (b) Average PhastCons conservation scores relative to tsDMRs. Higher values indicate more conservation. (c) (left) Heatmap representing the abundance of DNA methylation for tsDMRs in all tissues. Each row indicates a tsDMR, which are grouped into horizontal blocks that represent the tsDMRs of a tissue, with the number of elements in the block displayed in the middle. A given tsDMR may appear more than one block. (right) The percentage of tsDMRs in each block within 500bp of promoters, distal regulatory elements (enhancers and CTCF binding sites), genic regions, and intergenic regions. The genome-wide average is indicated below.
Figure 4
Figure 4. Tissue-specific conservation of regulatory elements
Average PhastCons conservation scores relative to tsDMRs that are (a) proximal (within 2.5-kb) or (b) distal (beyond 2.5-kb) to annotated transcription start sites (TSS). Higher values indicate more conservation.
Figure 5
Figure 5. Transcription factor binding motif enrichment near tsDMRs
(a) Heatmap representing the enrichment of transcription factor binding motifs for the tsDMRs identified in each tissue. Each row represents a motif, and the corresponding transcription factors for selected motifs are labeled on the right. (b) Predicted regulatory elements in heart (p300 binding sites (grey), chromatin-predicted enhancers (blue), tsDMRs (red)) were overlapped, and the density of known tissue-specific motifs (EWS, FOXO1, GATA4, JUN, MEF2A, NF1, SOX6, STAT3, TEAD4) relative to these aligned intersected sites is displayed. (c) The cumulative density of graphs in (b) with respect to the absolute distance to the predicted regulatory element. The horizontal dashed line indicates 50% cumulative density, and vertical dotted lines indicate the resolution in base pairs of each set of predicted regulatory elements to achieve 50% cumulative density.
Figure 6
Figure 6. Adult tissue-inactive (AD-I) tsDMRs demonstrate features of dormant enhancers
(a) Heatmap representing the density of H3K4me1 and H3K27ac relative at all tsDMRs identified in heart (left), kidney (middle), and olfactory bulb (right). Also indicated are adult tissue-active (AD-A, grey) tsDMRs and adult tissue-inactive (AD-I, red) tsDMRs. (b) AD-A and AD-I tsDMRs were identified for 10 tissues where histone modification data are publicly available (spleen, thymus, bone marrow, intestine, liver, heart, kidney, cerebellum, cortex, olfactory bulb). Shown are the average profiles of H3K4me1 (left), H3K27ac (middle), and DNA methylation (right). Each curve represents the average over a tissue/replicate pair. (c) Heatmap representing the enrichment of transcription factor binding motifs for the AD-I and AD-A tsDMRs of each tissue. Each row represents a motif, and the several rows are labeled on the right. The number of AD-A and AD-I tsDMRs is indicated in parentheses. (d) Heatmap representing the enrichment of GO biological process terms obtained by running the GREAT tool on AD-I tsDMRs. (e) Average PhastCons conservation scores for AD-A (grey) and AD-I (red) tsDMRs identified in cerebellum (left), kidney (middle), and heart (right). Higher values indicate more conservation.
Figure 7
Figure 7. AD-I tsDMRs are active during development
(a) For AD-I tsDMRs identified in adult cerebellum (left), adult cortex (middle), and adult heart (right), shown is the average enrichment of H3K4me1 (top) and H3K27ac (bottom) in adult tissue (grey) and embryonic day 14.5 tissue (red). Two biological replicates for each sample are shown. (b) AD-A and AD-I tsDMRs were associated with genes within 50-kb. Shown is the distribution of expression for genes associated with AD-A tsDMRs (green) and AD-I tsDMRs (grey) in respective adult tissue. For AD-I tsDMRs for which RNA-Seq data exist at earlier developmental timepoints (cerebellum/cortex/olfactory bulb: brain E14.5; heart: heart E14.5; liver: liver E14.5), also shown is the distribution of expression of AD-I tsDMR-associated genes in developmental tissue (red). P-values, Wilcoxon. (c) Heatmap of the overlap enrichment of AD-I tsDMRs with enhancers predicted in developing embryos (left) and adult cells (right). Enrichment is determined relative to sets of random AD-I tsDMRs. (d) Boxplots of overlap enrichment from (C) of AD-I tsDMRs with enhancers predicted in cells in developing or adult cells. (e) Overlap of p300 binding sites identified in embyronic forebrain, midbrain, and limb with AD-I tsDMRs (red) identified in ectodermal tissue (cerebellum, cortex, olfactory bulb) and all other tissue. As a comparison, overlap was also performed against random sets of AD-I tsDMRs (grey). Error bars indicate standard deviation. (f) In vivo reporter assays of enhancer activity for VISTA enhancers mm447 and mm414, as obtained from the VISTA enhancer browser. (g) UCSC Genome Browser snapshot of AD-I tsDMRs identified in cerebellum (highlighted), which overlaps with an in vivo validated enhancer active in developing mouse midbrain. Also shown are active histone modifications (H3K4me1, H3K4me3, H3K27ac) and DNase I hypersensitivity in developing mouse brains (E14.5, E18.5, adult) and cerebellum. For all boxplots, edges indicate the 25th and 75th percentiles, and whiskers indicate non-outlier extremes.
Figure 8
Figure 8. Vestigial enhancers across development and strain
(a) Heatmaps representing the enrichment of chromatin (me1 = H3K4me1, ac = H3K27ac) at predicted enhancers with active chromatin in E14.5 mouse brain that consistently (top) retain or (bottom) lose active chromatin in all adult brain tissue (cerebellum, cortex, olfactory bulb). The DNA methylation status in adult tissues is indicated on the right. (b) The percentage of E14.5 mouse brain enhancers belonging to various epigenetic states in adult brain tissue (cerebellum, cortex, olfactory bulb). E14.5 enhancers were overlapped with adult enhancers (A, light grey) and the remainder were overlapped with adult tsDMRs (D, red). The remaining fraction is labeled as inactive (I, dark grey). (c) Heatmap comparing the enrichment of transcription factor binding motifs for vestigial enhancers in brain tissue t1 with those in brain tissue t2. Each row represents a motif, and the several rows are labeled on the right. (d) (top) Heatmap of the DNA methylation status for various tissues and mouse strains, centered at vestigial enhancers identified in B6 mouse cortex. (bottom) Boxplots comparing B6 cortex vestigial enhancer methylation with that of each tissue/strain. Distance is measured as the absolute difference in methylation of each vestigial enhancer between two tissues. Boxplot edges indicate the 25th and 75th percentiles, and whiskers indicate non-outlier extremes. * indicates p < 1E-3 by Wilcoxon. (e) Average profiles of DNA methylation for cortical tissue from B6, C/129, and 129/C mice, centered at B6 cortex vestigial enhancers.

References

    1. Feng S, Jacobsen SE, Reik W. Epigenetic reprogramming in plant and animal development. Science. 2010;330:622–7. - PMC - PubMed
    1. Jones PA. Functions of DNA methylation: islands, start sites, gene bodies and beyond. Nat Rev Genet. 2012;13:484–92. - PubMed
    1. Bird A. DNA methylation patterns and epigenetic memory. Genes Dev. 2002;16:6–21. - PubMed
    1. Bonasio R, Tu S, Reinberg D. Molecular signals of epigenetic states. Science. 2010;330:612–6. - PMC - PubMed
    1. Okano M, Li E. Genetic analyses of DNA methyltransferase genes in mouse model system. J Nutr. 2002;132:2462S–2465S. - PubMed

Publication types

Associated data