

Comparative Study
doi: 10.1038/nmeth.2633.
Epub 2013 Sep 1.
Absolute quantification by droplet digital PCR versus analog real-time PCR
Affiliations
- PMID: 23995387
- PMCID: PMC4118677
- DOI: 10.1038/nmeth.2633
Item in Clipboard
Comparative Study
Absolute quantification by droplet digital PCR versus analog real-time PCR
Nat Methods.
2013 Oct.
Abstract
Nanoliter-sized droplet technology paired with digital PCR (ddPCR) holds promise for highly precise, absolute nucleic acid quantification. Our comparison of microRNA quantification by ddPCR and real-time PCR revealed greater precision (coefficients of variation decreased 37-86%) and improved day-to-day reproducibility (by a factor of seven) of ddPCR but with comparable sensitivity. When we applied ddPCR to serum microRNA biomarker analysis, this translated to superior diagnostic performance for identifying individuals with cancer.
Figures
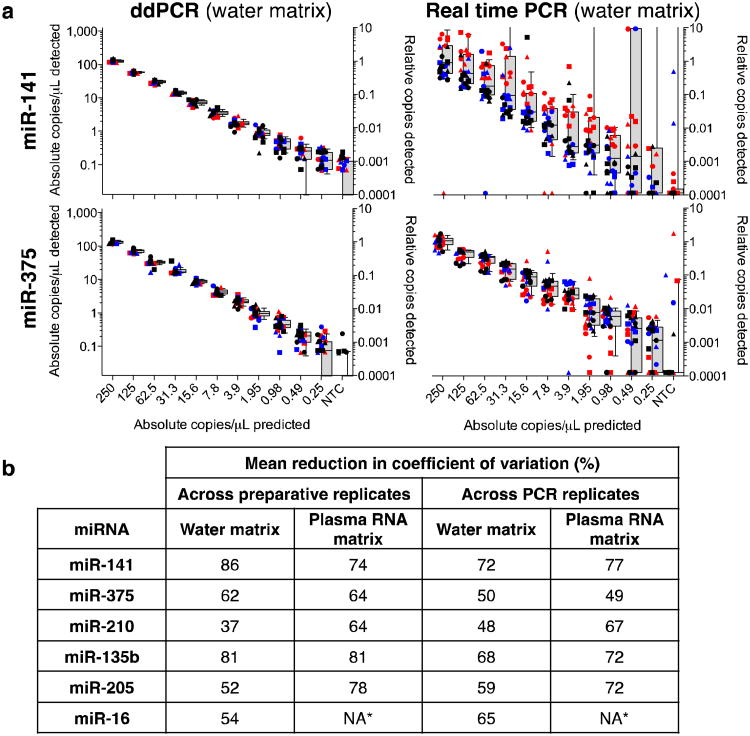
Quantification of synthetic miRNA oligonucleotides by ddPCR and real-time PCR. (a) Comparative analysis of dilution series of indicated miRNAs in water. Each color represents one preparative (independent preparation of a dilution series) replicate and each shape represents individual RTs. (RT 1, circle; RT 2, square; and RT 3, triangle). Box and whisker plots (gray) show median (center line), 25th and 75th percentiles (box), and 10th and 90th percentiles (whiskers). NTC: No Template Control. (b) Reduction in CV, measured as (CVreal-time PCR – CVddPCR)/(CVreal-time PCR). *, endogenous abundance of miR-16 in plasma RNA was higher than the maximum concentration of synthetic oligonucleotide examined.
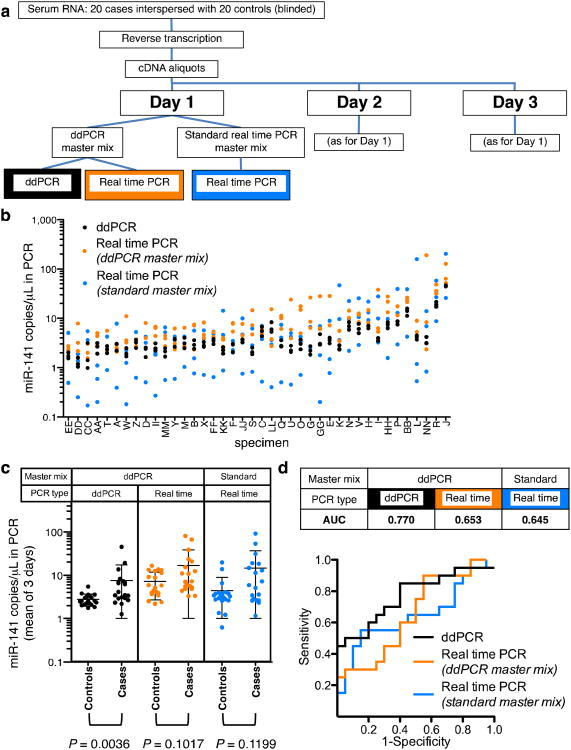
Quantification of circulating miRNA biomarker in clinical serum samples by ddPCR and real-time PCR. (a) Workflow used to measure the abundance of a circulating miRNA biomarker in clinical samples. (b) Replicate analyses of serum-derived miR-141 over 3 d. Data represent metawell analysis of three ddPCR replicates per day or the means of three real-time PCR replicates per day (individuals are sorted on the x-axis by mean abundance of ddPCR values). See Supplementary Data for key to specimen identifiers. (c) Data from b presented as the means of results over 3 d for cases and controls. Over the dot plots, central lines indicate the mean; error bars, s.d. (n = 20) P values: Mann-Whitney test, two-tailed. (d) ROC curve analysis of data in c.
References
-
- Sykes PJ, et al. Biotechniques. 1992;13:444–449. - PubMed
Publication types
MeSH terms
Substances
Grants and funding
LinkOut - more resources
Full Text Sources
Other Literature Sources
