. 2013 Oct;15(10):1253-9.
doi: 10.1038/ncb2830. Epub 2013 Sep 1.

A nuclear F-actin scaffold stabilizes ribonucleoprotein droplets against gravity in large cells

Affiliations

A nuclear F-actin scaffold stabilizes ribonucleoprotein droplets against gravity in large cells

Marina Feric et al. Nat Cell Biol. 2013 Oct.

Abstract

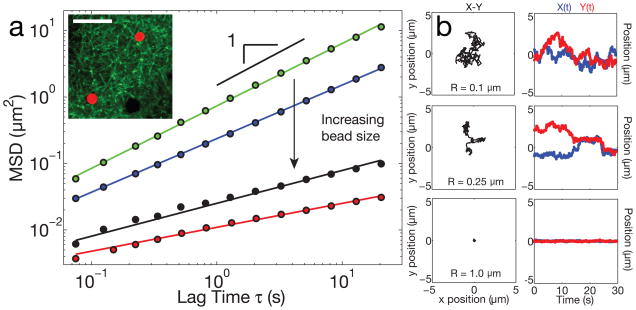
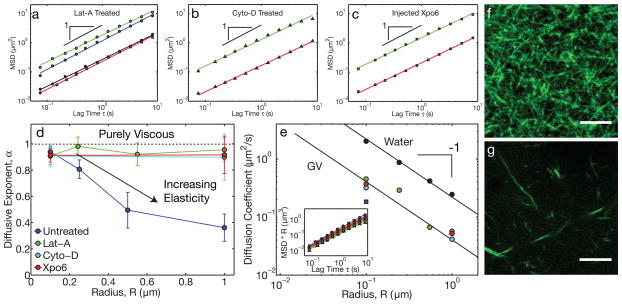
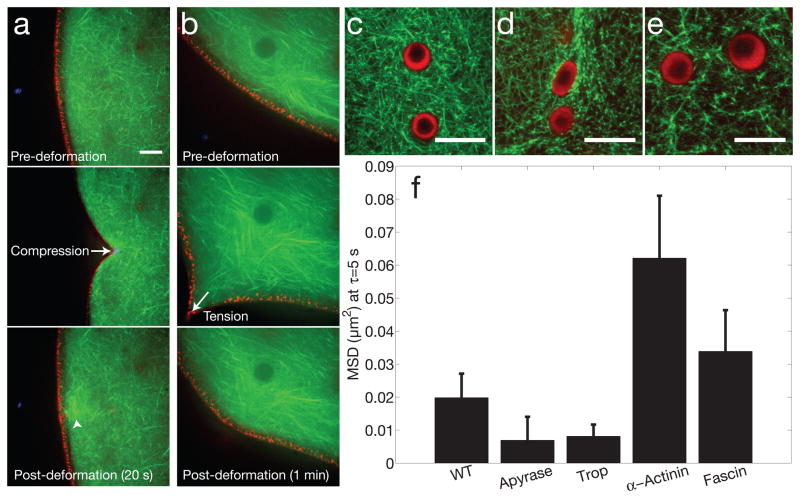
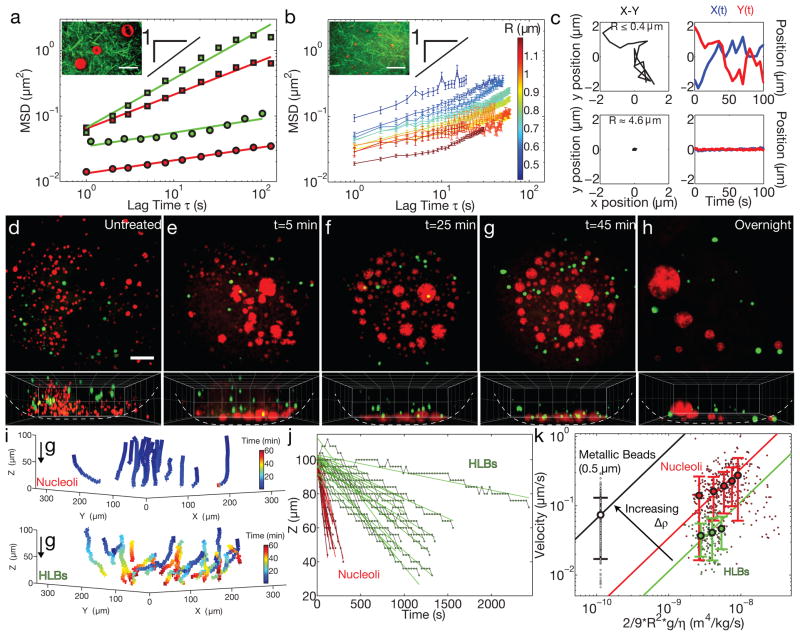
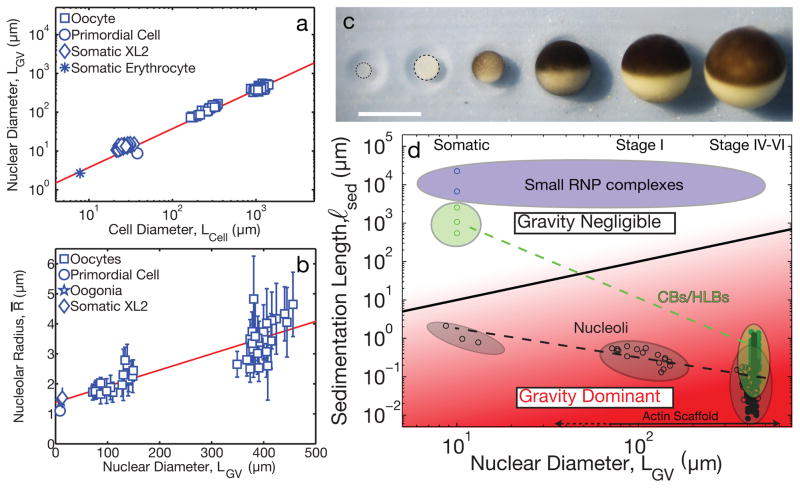
The size of a typical eukaryotic cell is of the order of ∼10 μm. However, some cell types grow to very large sizes, including oocytes (immature eggs) of organisms from humans to starfish. For example, oocytes of the frog Xenopus laevis grow to a diameter ≥1 mm. They have a correspondingly large nucleus (germinal vesicle) of ∼450 μm in diameter, which is similar to smaller somatic nuclei, but contains a significantly higher concentration of actin. The form and structure of this nuclear actin remain controversial, and its potential mechanical role within these large nuclei is unknown. Here, we use a microrheology and quantitative imaging approach to show that germinal vesicles contain an elastic F-actin scaffold that mechanically stabilizes these large nuclei against gravitational forces, which are usually considered negligible within cells. We find that on actin disruption, ribonucleoprotein droplets, including nucleoli and histone locus bodies, undergo gravitational sedimentation and fusion. We develop a model that reveals how gravity becomes an increasingly potent force as cells and their nuclei grow larger than ∼10 μm, explaining the requirement for a stabilizing nuclear F-actin scaffold in large Xenopus oocytes. All life forms are subject to gravity, and our results may have broad implications for cell growth and size control.


Conflict of interest statement

The authors declare no competing financial interests.

Figures

Figure 1
Figure 1. Probe particle size-dependent dynamics within the GV
a, 2D Mean squared displacement of passivated probe particles in GVs from large oocytes (Stage V–VI). Particles of radius R=0.1 μm (green) exhibit diffusive-like motion with a diffusive exponent, α ≈1.0 (24 z-positions from 9 GVs, 10,648 particles identified). For larger bead sizes, the mobility becomes increasingly constrained, with correspondingly smaller values of α. Blue: R=0.25 μm (16 z-positions from 8 GVs, 2,053 particles identified), black: R=0.5 μm (19 z-positions from 6 GVs, 1,867 particles identified), red: R=1.0 μm (35 z-positions from 14 GVs, 3,011 particles identified). Inset shows Lifeact::GFP network (green) and R=1.0 μm probe particles (red); dark spheres are unlabeled RNP bodies; scale bar = 10 μm. b, Left column shows example X-Y trajectories for three different bead sizes. The right column shows corresponding temporal changes in position, X(t) and Y(t).
Figure 2
Figure 2. Actin disruption leads to purely viscous nuclear properties
a, In Lat-A-treated oocytes, the MSD for all bead sizes exhibited diffusive-like behavior. Green: R=0.1 μm (19 z-positions from 9 GVs, 20,224 particles identified), blue: R=0.25 μm (28 z-positions from 15 GVs, 8,950 particles identified), black: R=0.5 μm (23 z-positions from 14 GVs, 3,261 particles identified), red: R=1.0 μm (23 z-positions from 11 GVs, 1,642 particles identified). b, Similar behavior was observed in Cyto-D treated oocytes. Green: R=0.1 μm (13 z-positions from 6 GVs, 7,754 particles identified) and red: R=1.0 μm (9 z-positions from 5 GVs, 382 particles identified). c, Similar behavior was observed in GVs injected with Xpo6 to deplete actin. Green: R=0.1 μm (21 z-positions from 10 GVs, 42,411 particles identified) and red: R=1.0 μm (13 z-positions from 5 GVs, 1,218 particles identified). d, Under actin-disrupting conditions (Lat-A, Cyto-D, and Xpo6), α ≈1 for all bead sizes, while α < 1 for large beads in native GVs. e, The diffusion coefficient, D, of beads in actin-disrupted GVs exhibits a roughly R−1-dependence expected from the Stokes-Einstein equation; small beads in untreated GVs have a comparable value of D (blue square). Solid black symbols are beads diffusing in water. The color scheme is as in d. Inset shows the scaled MSD·R against lag time. f, Lifeact::GFP image showing the native actin network in a live GV. g, Lifeact::GFP image of the fragmented actin network after Lat-A treatment. Scale bars = 5 μm.
Figure 3
Figure 3. Mechanics, anchoring and structural regulation of nuclear actin
a, Compressive forces were applied to the GV using a microneedle, demonstrating a coupled elastic response of the actin meshwork (Lifeact::GFP, green) and lamin cortex (RFP::Lamin B3, red). Arrowhead shows increased intensity, suggesting actin polymerization occurs in response to force. b, Tensile forces were applied to the GV using a microneedle, showing a similar coupled elastic response. c, Two nuclear bodies trapped in a dense native actin meshwork. d, Tropomyosin injection leads to a compacted actin meshwork, and the nuclear bodies are often deformed. e, Fascin injection leads to bundling of the actin meshwork. For c–e, nucleoli are labeled with NPM1::RFP (red), and actin is labeled with Lifeact::GFP (green). d, Bar graph showing the MSD of large (R=1 μm) beads at a lag time of 5 sec, under various conditions: untreated (n=35 z-positions from 14 GVs, 3,011 particles identified), apyrase (n=13 z-positions from 4 GVs, 617 particles identified, p-value = 0.22), tropomyosin (n=24 z-positions from 12 GVs, 1,278 particles identified, p-value = 0.16), alpha-actinin (n=18 z-positions from 5 GVs, 1,254 particles identified, p-value = 0.05), and fascin (n=39 z-positions from 18 GVs, 2,123 particles identified, p-value = 0.34). Error bars = s.e.m. Scale bar is 10 μm in all images.
Figure 4
Figure 4. Actin disruption results in sedimentation and fusion of nuclear bodies
a, 2D MSD of RNP bodies shows highly constrained motion in native GVs (circles). Red: nucleoli (R>2 μm) (11 z-positions from 5 GVs, 320 bodies identified) and green: HLBs (16 z-positions from 10 GVs, 232 bodies identified). In latrunculin-treated GVs (squares) these RNP bodies are more mobile. Red: nucleoli (R>2 μm) (10 z-positions from 6 GVs, 442 bodies identified) and green: HLBs (9 z-positions from 5 GVs, 149 bodies identified). Inset shows a few large nucleoli embedded in an F-actin meshwork visualized by Lifeact::GFP. Scale bar = 10 μm. b, A sub-population of small nucleoli (“micronucleoli,” R<2 μm) are more mobile, and occasionally exhibit intermittent dynamics (“cage hopping”) in native GVs. Inset shows micronucleoli inside a meshwork labeled with Lifeact::GFP. (n=number of displacements at a given lag time per nucleolar size from 11 z-positions from 7 GVs, 240 bodies identified). Error bars = s.e.m. Scale bar = 10 μm. c, Left column shows example X-Y trajectories for a representative micronucleolus (top) and a typical large nucleolus (bottom). The right column shows corresponding temporal changes in position, X(t) and Y(t). For d–h, top images show a maximum intensity projection of a 100-micron thick section of nucleoli labeled with NPM1::RFP (red) and HLBs labeled with GFP::Coilin (green), and bottom images show a 3-D rendering in the X-Z plane. d, Nucleoli and HLBs are suspended in an untreated GV. For e–g, time-lapse images are from the same GV from a Lat-A treated oocyte; time refers to minutes after dissection. h, Large nuclear bodies that form overnight after actin disruption by Lat-A. Scale bar = 50 μm. 3D grid size = 50 μm. i, 3D representation of nucleoli (top) and HLB (bottom) trajectories after actin disruption in the GV shown in e–g. j, The vertical position of nuclear bodies (red: nucleoli R>2 μm, and green: HLBs) from i as a function of time. k, The sedimentation velocity plotted against normalized size. Black: metallic R=0.5 μm beads (n=16 movies of 16 GVs, 237 tracks analyzed), red: nucleoli (R>2 μm) (n=17 movies of 16 GVs, 394 tracks analyzed) and green: HLBs (n=18 movies of 12 GVs, 149 tracks analyzed). Larger circles represent binned data points and solid lines are linear fits of the data, with the slope representing the buoyant density. Error bars = s.d.
Figure 5
Figure 5. Cell size, organelle scaling, and gravity
a, Linear scaling was observed between nuclear diameter, LGV, and cell diameter, Lcell from Stage I, IV, V, and VI oocytes and estimated from the literature (Supplementary Note). b, Linear scaling found between average nucleolar radius and nuclear diameter based on measurements in Stage I, IV, V and VI oocytes and estimated from literature (Supplementary Note). Nucleoli were measured from late stage oocytes (n=8 GVs), intermediate stage oocytes (n=17 GVs) and early stage oocytes (n=17 GVs). Error bars = s.d. Red solid line is the weighted best-fit line of the data. c, Cell growth during oogenesis in X. laevis. Each of the six stages is shown. Scale bar = 1 mm. d, State diagram of ℓsed vs. LGV. Black solid line separates region where gravity is negligible (white, ℓsed > LGV) from region where gravity dominates (red, ℓsed < LGV). Measurements (closed circles) and approximations (open circles) (Supplementary Note) are plotted for different nuclear bodies (black: nucleoli, green: HLBs/CBs, blue: small RNP complexes). For nuclear diameters > 10 μm, gravity becomes increasingly dominant for both HLBs and nucleoli, requiring a stabilizing F-actin scaffold.

References

    1. Dahl KN, Ribeiro AJ, Lammerding J. Nuclear shape, mechanics, and mechanotransduction. Circ Res. 2008;102:1307–1318. doi: 10.1161/CIRCRESAHA.108.173989. - DOI - PMC - PubMed
    1. Lammerding J, Dahl KN, Discher DE, Kamm RD. In: Methods in Cell Biology. Yu-Li Wang, Discher Dennis E., editors. Vol. 83. Academic Press; 2007. pp. 269–294. - PubMed
    1. Ye J, Zhao J, Hoffmann-Rohrer U, Grummt I. Nuclear myosin I acts in concert with polymeric actin to drive RNA polymerase I transcription. Gene Dev. 2008;22:322–330. doi: 10.1101/Gad.455908. - DOI - PMC - PubMed
    1. Hofmann WA, de Lanerolle P. Nuclear actin: to polymerize or not to polymerize. J Cell Biol. 2006;172:495–496. doi: 10.1083/jcb.200601095. jcb.200601095 [pii] - DOI - PMC - PubMed
    1. Rando OJ, Zhao K, Crabtree GR. Searching for a function for nuclear actin. Trends Cell Biol. 2000;10:92–97. S0962-8924(99)01713-4 [pii] - PubMed

Publication types