. 2013 Oct;5(10):1262-71.
doi: 10.1039/c3ib40149a.

Mechanisms of tumor cell extravasation in an in vitro microvascular network platform

Affiliations

Mechanisms of tumor cell extravasation in an in vitro microvascular network platform

Michelle B Chen et al. Integr Biol (Camb). 2013 Oct.

Abstract

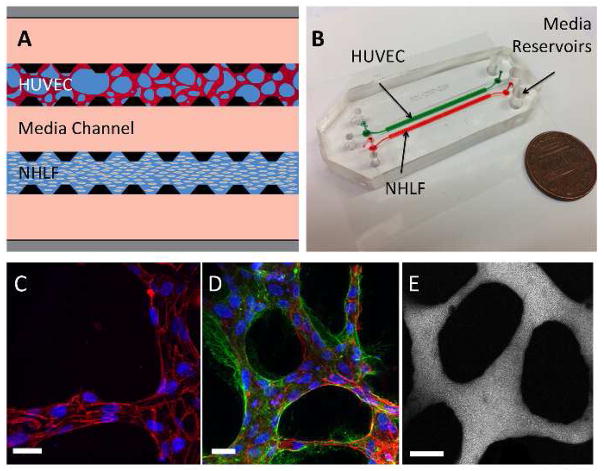
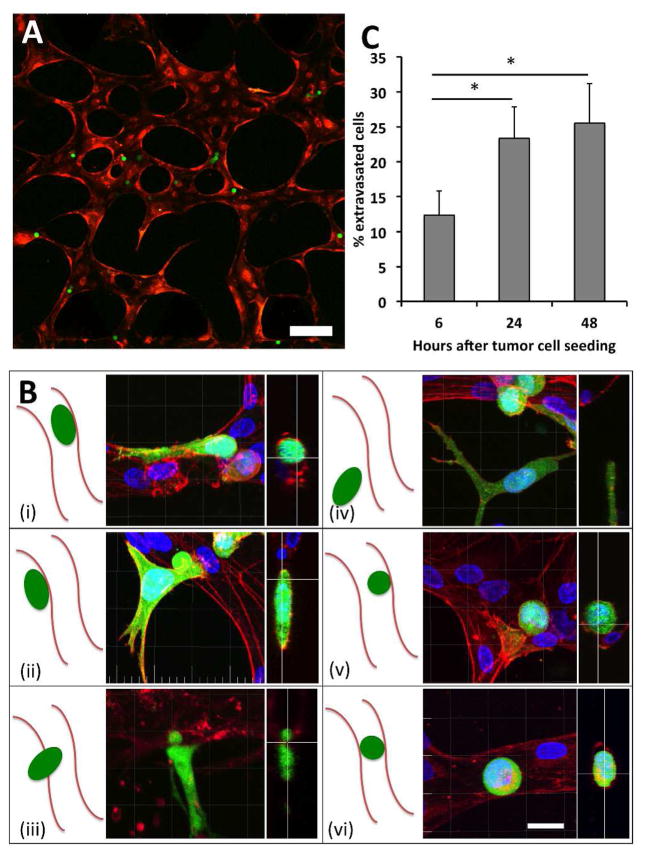
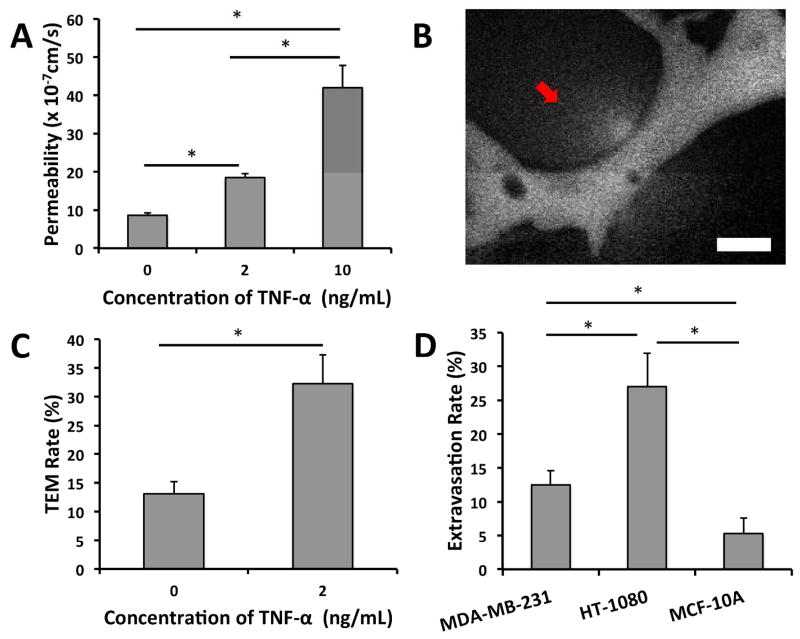
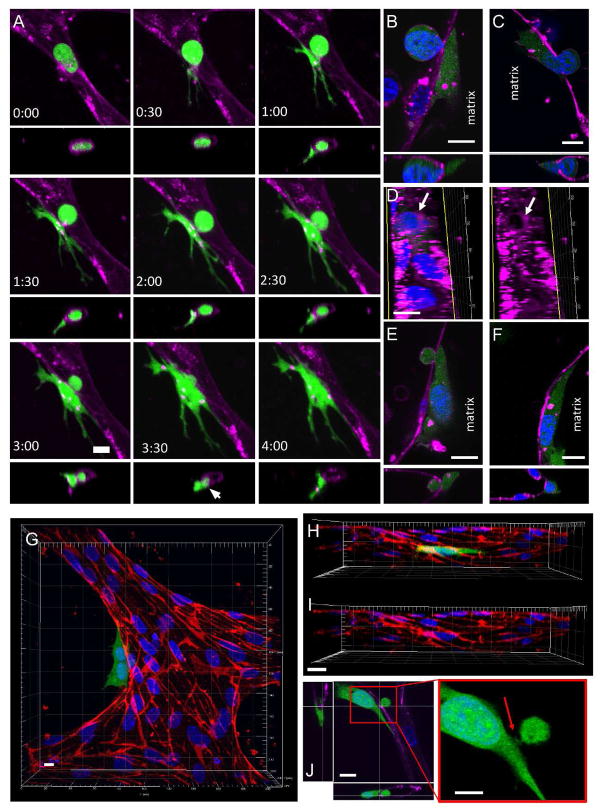
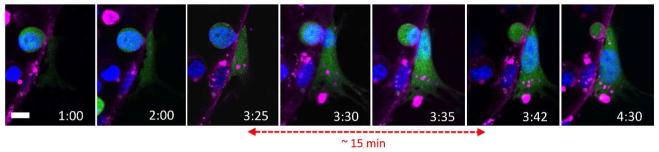
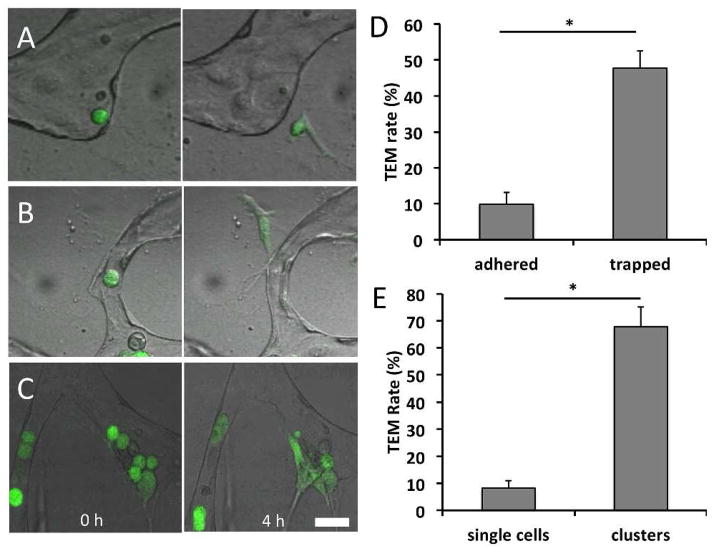
A deeper understanding of the mechanisms of tumor cell extravasation is essential in creating therapies that target this crucial step in cancer metastasis. Here, we use a microfluidic platform to study tumor cell extravasation from in vitro microvascular networks formed via vasculogenesis. We demonstrate tight endothelial cell-cell junctions, basement membrane deposition and physiological values of vessel permeability. Employing our assay, we demonstrate impaired endothelial barrier function and increased extravasation efficiency with inflammatory cytokine stimulation, as well as positive correlations between the metastatic potentials of MDA-MB-231, HT-1080, MCF-10A and their extravasation capabilities. High-resolution time-lapse microscopy reveals the highly dynamic nature of extravasation events, beginning with thin tumor cell protrusions across the endothelium followed by extrusion of the remainder of the cell body through the formation of small (~1 μm) openings in the endothelial barrier which grows in size (~8 μm) to allow for nuclear transmigration. No disruption to endothelial cell-cell junctions is discernible at 60×, or by changes in local barrier function after completion of transmigration. Tumor transendothelial migration efficiency is significantly higher in trapped cells compared to non-trapped adhered cells, and in cell clusters versus single tumor cells.


Figures

Figure 1
Figure 1. Characterization of microfluidic microvascular network platform
(A) A schematic of the microfluidic device and cell-seeding configuration. Suspended HUVECs form microvascular networks in a gel matrix communicating with NHLFs in a paracrine fashion across the central media channel through the inter-post regions. Micro-posts (black) allow for surface tension-assisted gel filling via ports at the ends of each gel region. Medium is replenished every 24 hours via hydrostatic pressure applied between the media reservoirs on each end of the media channels. (B) Photograph of 2-gel region microfluidic device. (C) Visualization of VE-cadherin (red) at 60X reveals continuous cell-cell junctions. (D) Collagen IV basement membrane deposition (green) around the lumen (red) and in the perivascular space suggests vessel maturation. (E) Perfusion of vessels with 70 kDa dextran reveals patent lumens void of local leaks. Scale bars are 20 μm.
Figure 2
Figure 2. Visualization of MDA-MB-231 extravasation events
(A) A region of interest 30 minutes after seeding MDA-MB-231 (green) at 0.4 M cells/mL in live RFP-labeled μVN (red). Scale bar is 200 μm. (B) The various positions of tumor cells (green) relative to the endothelial barrier (red) that can be found during a 24-hour culture period, imaged in fixed samples. These include cells that are (i) spread but contained within the lumen, (ii) transmigrated and spread on the outside of the lumen, (iii) circular with protrusions penetrating the HUVEC barrier and contacting the matrix, (iv) transmigrated away from the lumen, (v) circular and adhered within the lumen, and (vi) circular and trapped in vessels with diameters smaller than that of the cell. (C) Extravasation rates of MDA-231 in HUVEC vessels over 48 hours (9 total devices over 3 independent experiments). Data is represented as mean ± SD. Statistical significance was tested with one-way ANOVA (*p<0.05). Scale bars are 20 μm.
Figure 3
Figure 3. The effect of TNF-α on barrier function and TEM and the correlation of metastatic potential and TEM capabilities
(A) Graded response of vessel permeability to TNF-α perturbation. (B) High concentrations of TNF-α (10 ng/mL) results in cell-death induced ruptures and focal leaks (red arrow) seen by 70 kDa dextran (white). (C) Effect of TNF-α stimulation on TEM efficiency of MDA-MB-321. (D) Extravasation rates of cell lines with different metastatic potentials (MDA-MB-231, HT-1080 and MCF-10A). Data is represented as mean ± SD, with 9 total devices over 3 experiments for each condition. Statistical significance was tested with one-way ANOVA and Tukey’s Test (*p<0.05). Scale bars are 20 μm.
Figure 4
Figure 4. Visualization of extravasation dynamics
(A) High resolution time-lapse confocal microscopy (40X) of an extravasating entrapped MDA-MB-231 (green). Lumens were labeled with a far-red plasma membrane stain (purple). Tumor cells transmigrate through the endothelium and into the 3D matrix over a period of 4 h. The white arrow at 3:30 h indicates the location of a vessel opening at the site of tumor cell TEM. (B) Confocal images taken at a single slice shows a small gap ~1–2 μm forming in the EC barrier at the initial stages of TEM. (C) Gaps in the EC plasma membrane grow in size (~8–10μm) to allow TEM of the nucleus. (D) A circular is hole is seen in the vessel lumen at the location and instant of tumor cell nuclear TEM. (E) EC membrane gaps diminish in size and (F) eventually become indiscernible after complete TEM. (G) Staining of VE-cadherin (red) after tumor cell (green) extravasation in fixed samples. Images of VE-cadherin and two tumor cells (H) merged and (I) unmerged reveal no apparent disruptions in EC junctional staining after complete TEM. (J) MDA-MB-231 extravasates through a small gap in the EC barrier, as seen by a thin segment of the cell joining the apical/basal portions of the tumor cell (red arrow). All scales bars are 10 μm.
Figure 5
Figure 5. Dynamics of nuclear TEM
Time-lapse confocal microscopy at 40X reveals the dynamic nature of the transmigration of the tumor cell nucleus (blue). Transmigration of the nucleus occurs within a relatively short time frame (~15 min) compared the total time required for complete cell TEM (~4 h).
Figure 6
Figure 6. TEM efficiencies of different tumor cell subpopulations
(A) Non-trapped adhered tumor cell at 30 min and 4 h after seeding. (B) Entrapped tumor cell at 30 min and 4 h after seeding. (C) Tumor cell cluster (>2 adjacent cells) at 30 min and 4 h after seeding. (D) TEM efficiency of adhered non-trapped and trapped subpopulations. (E) TEM efficiency of single cell and collective cells. Data are represented as mean ± SD, with 9 total devices over 3 independent experiments for each condition. Statistical significance was tested with one-way ANOVA and Tukey’s Test (*p<0.001). All scale bars are 20 μm.

References

    1. Nicolson GL. Curr Opin Cell Biol. 1989;1:1009–1019. - PubMed
    1. Luzzi KJ, MacDonald IC, Schmidt EE, Kerkvliet N, Morris VL, Chambers AF, Groom AC. Am J Pathol. 1998;153:865–873. - PMC - PubMed
    1. Podsypanina K, Du YC, Jechlinger M, Beverly LJ, Hambardzumyan D, Varmus H. Science. 2008;321:1841–1844. - PMC - PubMed
    1. Sahai E. Nat Rev Cancer. 2007;7:737–749. - PubMed
    1. Stoletov K, Kato H, Zardouzian E, Kelber J, Yang J, Shattil S, Klemke R. J Cell Sci. 2010;123:2332–2341. - PMC - PubMed

Publication types

MeSH terms