. 2014 Mar;229(3):362-73.
doi: 10.1002/jcp.24458.

Morphological effects on expression of growth differentiation factor 15 (GDF15), a marker of metastasis

Affiliations

Morphological effects on expression of growth differentiation factor 15 (GDF15), a marker of metastasis

Koh Meng Aw Yong et al. J Cell Physiol. 2014 Mar.

Abstract

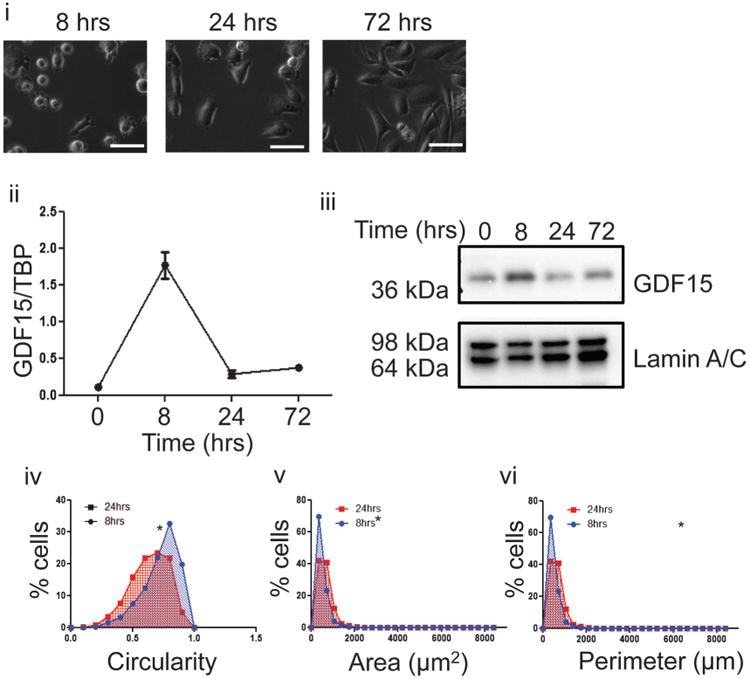
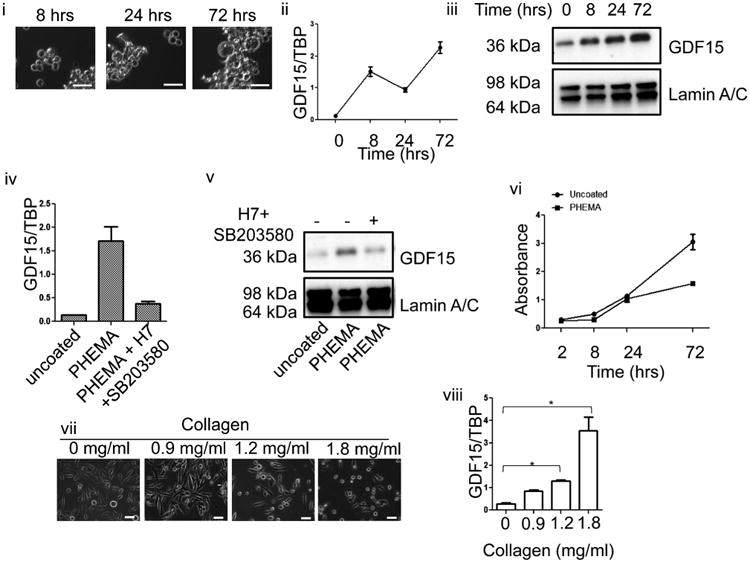
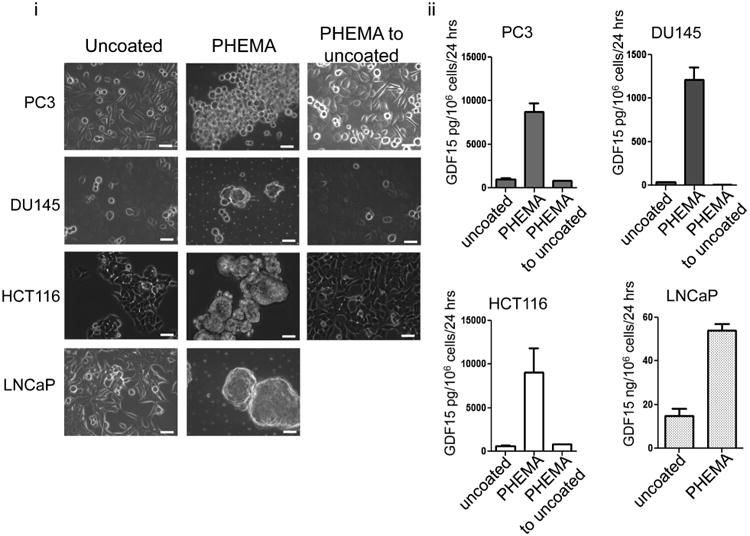
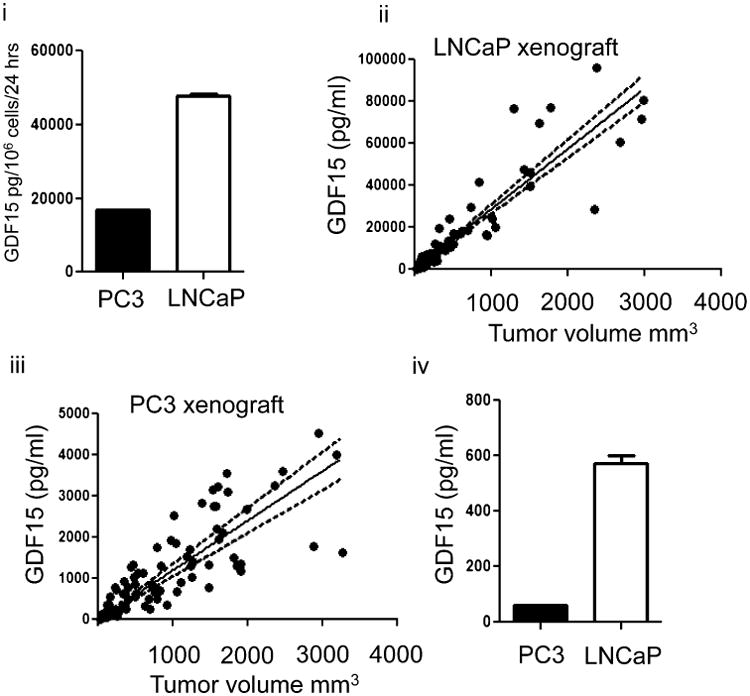
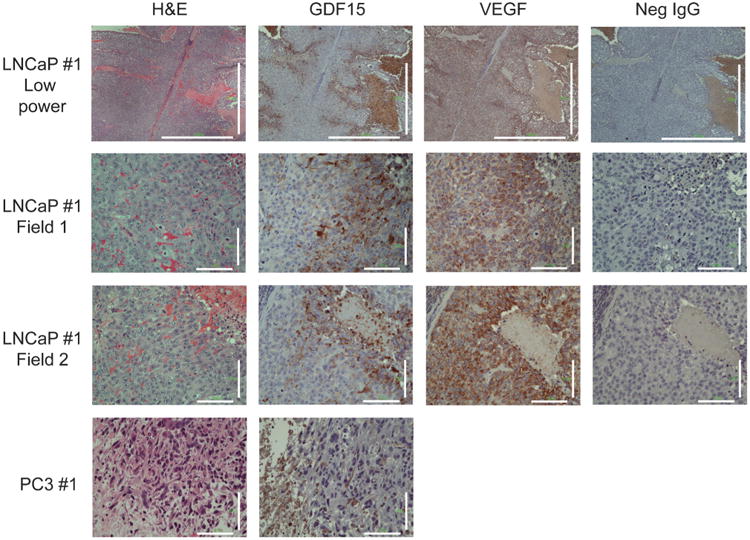
Cancer cells typically demonstrate altered morphology during the various stages of disease progression as well as metastasis. While much is known about how altered cell morphology in cancer is a result of genetic regulation, less is known about how changes in cell morphology affect cell function by influencing gene expression. In this study, we altered cell morphology in different types of cancer cells by disrupting the actin cytoskeleton or by modulating attachment and observed a rapid up-regulation of growth differentiation factor 15 (GDF15), a member of the transforming growth factor-beta (TGF-β) super-family. Strikingly, this up-regulation was sustained as long as the cell morphology remained altered but was reversed upon allowing cell morphology to return to its typical configuration. The potential significance of these findings was examined in vivo using a mouse model: a small number of cancer cells grown in diffusion chambers that altered morphology increased mouse serum GDF15. Taken together, we propose that during the process of metastasis, cancer cells experience changes in cell morphology, resulting in the increased production and secretion of GDF15 into the surrounding environment. This indicates a possible relationship between serum GDF15 levels and circulating tumor cells may exist. Further investigation into the exact nature of this relationship is warranted.


Conflict of interest statement

Disclosure of potential conflict of interests: The authors declare that there are no potential conflicts of interest.

Figures

Fig. 1
Fig. 1
Disruption of cell morphology using drugs that target the actin cytoskeleton up-regulate GDF15 expression. (i) Images of PC3 cells treated with carrier (ethanol), latrunculin B (Lat B) or jasplakinolide (Jpk) within 8 h of treatment (top row) and after 24-h recovery following removal of drug by changing media (bottom row). White bar=50 μm. (ii) Quantitative real-time PCR (Q-PCR) showing elevated GDF15 mRNA transcript levels within 8 h of either Lat B or Jpk treatment relative to vehicle treated cells. Levels of GDF15 transcript decreased 24 h after removal of drug (P < 0.05). (iii) Immunoblot of PC3 cell lysate of different treatments probing for intracellular GDF15 protein levels and lamin A/C as loading control. (iv) WST-1 assay of PC3 cells treated with carrier, Lat B or Jpk for 8 h. (v) Immunoblot for GDF15 in PC3 cells following 8-h treatment using carrier, 300 nM PMA, 500 nM Lat B, or 100 nM Jpk with or without combination of 2 μM SB203580 and 20 μM PKC inhibitors.
Fig. 2
Fig. 2
Up-regulation of GDF15 following changes to cell morphology by attachment to a normal tissue culture dish. (i) PC3 cells were seeded on a normal tissue culture dish and images taken at 8, 24, and 72 h after seeding. White bar=50 μm. (ii) Q-PCR of GDF15 mRNA transcript levels from at 0, 8, 24, and 72 h after seeding freshly trypsinized cells on tissue culture dish. Cells previously grown on a regular tissue culture dish for 96 h were harvested by scraping for 0-h time point. (iii) Immunoblot probing for GDF15 with lamin A/C as loading control. Cell lysate was prepared from cells harvested at 0, 8, 24, or 72 h after seeding on uncoated or PHEMA-coated dishes. (iv) Frequency distribution curve of cell circularity comparing between cells at 8 and 24 h of attachment (P < 0.05). (v) Frequency distribution curve of cell area comparing between cells at 8 and 24 h of attachment (P < 0.05). (vi) Frequency distribution curve of cell perimeter comparing between cells at 8 and 24 h of attachment (P < 0.05).
Fig. 3
Fig. 3
Sustained up-regulation of GDF15 following prolonged changes to cell morphology by growing cells on PHEMA-coated dish. (i) PC3 cells were seeded on a PHEMA culture dish and images taken at 8, 24, and 72 h after seeding. White bar=50 μm. (ii) Q-PCR of GDF15 mRNA transcript levels from at 0, 8, 24, and 72 h after seeding freshly trypsinized cells on PHEMA-coated dish. Cells previously grown on a regular tissue culture dish for 96 h were harvested by scraping for 0-h time point. (iii) Immunoblot probing for GDF15 with lamin A/C as loading control. Cell lysate was prepared from cells harvested at 0, 8, 24, or 72 h after seeding on uncoated or PHEMA-coated dishes. (iv) Q-PCR of GDF15 demonstrating effect of adding p38MAPK and PKC inhibitor combination to cells grown on PHEMA-coated dish (P < 0.05). (v) GDF15 immunoblot demonstrating that effect of p38MAPK and PKC inhibitor combination to GDF15 protein levels. (vi) WST-1 assay demonstrating viability of cells grown on uncoated or PHEMA-coated dish. (vii) Images of PC3 cells grown in increasing collagen I concentration. (viii) Q-PCR analysis of PC3 cells grown in different collagen I concentration matrix (P < 0.05).
Fig. 4
Fig. 4
Different cell types increase GDF15 secretion following changes to morphology induced by preventing attachment. (i) Different types of cancer cells demonstrate morphology changes when cells were grown on PHEMA-coated dishes as compared to growth on uncoated normal dishes. This change in morphology is regained when cells on PHEMA-coated dishes were allowed to re-attach to uncoated normal dishes. White bar=50 μm. (ii) Bar graphs depicting the amount of GDF15 secreted per cell type. Amount of GDF15 secreted increased when cells were grown on PHEMA-coated dishes and decreased back to normal when cells were allowed to re-attach to normal dishes (P < 0.05).
Fig. 5
Fig. 5
Small number of cells grown under conditions preventing attachment in vivo can result in an increase in serum GDF15. (i) Amount of GDF15 secreted into conditioned media when 2 × 10⁵ PC3 or LNCaP cells introduced into PTFE diffusion chambers were grown in vitro for 3 weeks. (ii) Scatter plot of tumor volume against serum GDF15 concentration in PC3 xenografts (n = 11). Linear regression analysis was performed and a best-fit line drawn as a solid line. Dashed line indicates 95% confidence interval of best-fit line. (iii) Scatter plot of tumor volume against serum GDF15 concentration in LNCaP xenografts (n = 12). Linear regression analysis was performed and best-fit line drawn as solid line. Dashed line indicates 95% confidence interval. (iv) Bar graph of GDF15 in pooled serum of mice implanted with chambers containing 2 × 10⁵ PC3 or LNCaP, n = 5 for each group.
Fig. 6
Fig. 6
Histological staining of LNCaP and PC3 xenografts. H&E and Immunohistochemistry staining for GDF15, VEGF, and IgG negative control, respectively. Large regions of tumor do not stain for GDF15. Strong staining for GDF15 was observed near regions where cells were palisading towards necrotic regions. Little staining for GDF15 was observed anywhere else in the xenograft. Strong VEGF staining was observed throughout the xenograft, but was stronger near regions that corresponded to strong GDF15 staining. Scale bar=1,000 μm (low magnification), 100 μm.

References

    1. Allard WJ, Matera J, Miller MC, Repollet M, Connelly MC, Rao C, Tibbe AG, Uhr JW, Terstappen LW. Tumor cells circulate in the peripheral blood of all major carcinomas but not in healthy subjects or patients with nonmalignant diseases. Clin Cancer Res. 2004;10:6897–6904. - PubMed
    1. Bootcov MR, Bauskin AR, Valenzuela SM, Moore AG, Bansal M, He XY, Zhang HP, Donnellan M, Mahler S, Pryor K, Walsh BJ, Nicholson RC, Fairlie WD, Por SB, Robbins JM, Breit SN. MIC-1, a novel macrophage inhibitory cytokine, is a divergent member of the TGF-beta superfamily. Proc Natl Acad Sci USA. 1997;94:11514–11519. - PMC - PubMed
    1. Brown DA, Lindmark F, Stattin P, Balter K, Adami HO, Zheng SL, Xu J, Isaacs WB, Gronberg H, Breit SN, Wiklund FE. Macrophage inhibitory cytokine 1: A new prognostic marker in prostate cancer. Clin Cancer Res. 2009;15:6658–6664. - PMC - PubMed
    1. Bubb MR, Spector I, Beyer BB, Fosen KM. Effects of jasplakinolide on the kinetics of actin polymerization. An explanation for certain in vivo observations. J Biol Chem. 2000;275:5163–5170. - PubMed
    1. Chen M, Zamora PO, Som P, Pena LA, Osaki S. Cell attachment and biocompatibility of polytetrafluoroethylene (PTFE) treated with glow-discharge plasma of mixed ammonia and oxygen. J Biomater Sci Polym Ed. 2003;14:917–935. - PubMed

Publication types

MeSH terms