

Fitness and proteome changes accompanying the development of erythromycin resistance in a population of Escherichia coli grown in continuous culture
- PMID: 23996919
- PMCID: PMC3831644
- DOI: 10.1002/mbo3.121
Fitness and proteome changes accompanying the development of erythromycin resistance in a population of Escherichia coli grown in continuous culture
Abstract
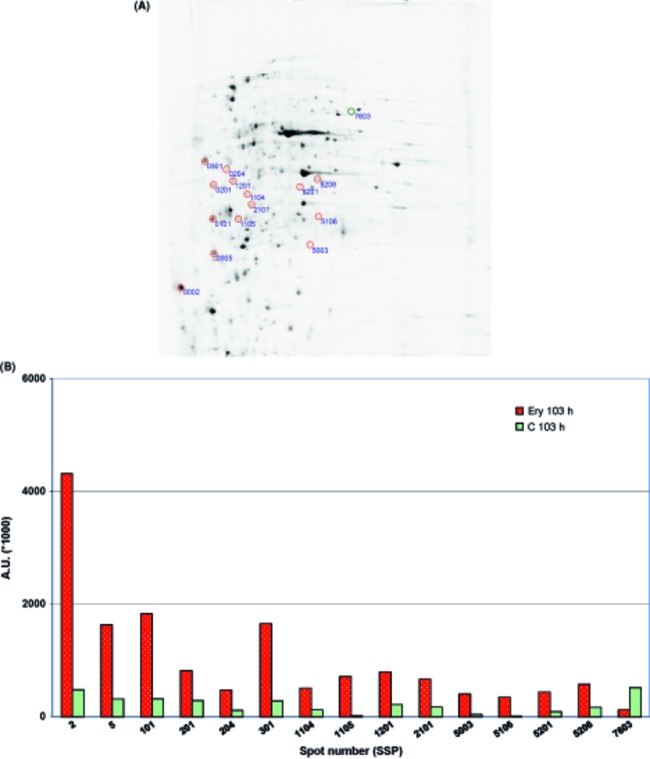
We studied the impact of a sublethal concentration of erythromycin on the fitness and proteome of a continuously cultivated population of Escherichia coli. The development of resistance to erythromycin in the population was followed over time by the gradient plate method and minimum inhibitory concentration (MIC) measurements. We measured the growth rate, standardized efficiency of synthesis of radiolabeled proteins, and translation accuracy of the system. The proteome changes were followed over time in two parallel experiments that differed in the presence or absence of erythromycin. A comparison of the proteomes at each time point (43, 68, and 103 h) revealed a group of unique proteins differing in expression. From all 35 proteins differing throughout the cultivation, only three were common to more than one time point. In the final population, a significant proportion of upregulated proteins was localized to the outer or inner cytoplasmic membranes or to the periplasmic space. In a population growing for more than 100 generations in the presence of antibiotic, erythromycin-resistant bacterial clones with improved fitness in comparison to early resistant culture predominated. This phenomenon was accompanied by distinct changes in protein expression during a stepwise, population-based development of erythromycin resistance.
Keywords: Continuous cultivation system; Escherichia coli; erythromycin; fitness; proteome; resistance.
© 2013 The Authors. MicrobiologyOpen published by John Wiley & Sons Ltd.
Figures


Similar articles
-
Selective pressure of various levels of erythromycin on the development of antibiotic resistance.Environ Pollut. 2025 Mar 1;368:125757. doi: 10.1016/j.envpol.2025.125757. Epub 2025 Jan 25. Environ Pollut. 2025. PMID: 39870133
-
The contribution of common rpsL mutations in Escherichia coli to sensitivity to ribosome targeting antibiotics.Int J Med Microbiol. 2013 Dec;303(8):558-62. doi: 10.1016/j.ijmm.2013.07.006. Epub 2013 Jul 31. Int J Med Microbiol. 2013. PMID: 23972615
-
Quantifying the Determinants of Evolutionary Dynamics Leading to Drug Resistance.PLoS Biol. 2015 Nov 18;13(11):e1002299. doi: 10.1371/journal.pbio.1002299. eCollection 2015. PLoS Biol. 2015. PMID: 26581035 Free PMC article.
-
Zeocin resistance suppresses mutation in hypermutable Escherichia coli.Microbiology (Reading). 2003 Apr;149(Pt 4):815-816. doi: 10.1099/mic.0.C0111-0. Microbiology (Reading). 2003. PMID: 12686623 Review. No abstract available.
-
Bacterial growth: global effects on gene expression, growth feedback and proteome partition.Curr Opin Biotechnol. 2014 Aug;28:96-102. doi: 10.1016/j.copbio.2014.01.001. Epub 2014 Feb 2. Curr Opin Biotechnol. 2014. PMID: 24495512 Free PMC article. Review.
Cited by
-
Antibiotic Killing of Diversely Generated Populations of Nonreplicating Bacteria.Antimicrob Agents Chemother. 2019 Jun 24;63(7):e02360-18. doi: 10.1128/AAC.02360-18. Print 2019 Jul. Antimicrob Agents Chemother. 2019. PMID: 31036690 Free PMC article.
-
The Role of Proteomics in Bacterial Response to Antibiotics.Pharmaceuticals (Basel). 2020 Aug 27;13(9):214. doi: 10.3390/ph13090214. Pharmaceuticals (Basel). 2020. PMID: 32867221 Free PMC article. Review.
-
Effects of selection pressure and genetic association on the relationship between antibiotic resistance and virulence in Escherichia coli.Antimicrob Agents Chemother. 2015 Nov;59(11):6733-40. doi: 10.1128/AAC.01094-15. Epub 2015 Aug 17. Antimicrob Agents Chemother. 2015. PMID: 26282415 Free PMC article.
References
-
- Andersson DI. Persistence of antibiotic resistant bacteria. Curr. Opin. Microbiol. 2003;6:452–456. - PubMed
-
- Andersson DI, Hughes D. Antibiotic resistance and its cost: is it possible to reverse resistance? Nat. Rev. Microbiol. 2010;8:260–271. - PubMed
-
- Andersson S, Kurland CG. Elongating ribosomes in vivo are refractory to erythromycin. Biochimie. 1987;69:901–904. - PubMed
-
- Bernier SP, Letoffe S, Delepierre M, Ghigo JM. Biogenic ammonia modifies antibiotic resistance at a distance in physically separated bacteria. Mol. Microbiol. 2011;81:705–716. - PubMed
-
- Chastre J. Evolving problems with resistant pathogens. Clin. Microbiol. Infect. 2008;14:3–14. - PubMed
Publication types
MeSH terms
Substances
LinkOut - more resources
Full Text Sources
Other Literature Sources
Medical
