. 2013:2013:936593.
doi: 10.1155/2013/936593. Epub 2013 Jul 17.

Acoustic angiography: a new imaging modality for assessing microvasculature architecture

Affiliations

Acoustic angiography: a new imaging modality for assessing microvasculature architecture

Ryan C Gessner et al. Int J Biomed Imaging. 2013.

Abstract

The purpose of this paper is to provide the biomedical imaging community with details of a new high resolution contrast imaging approach referred to as "acoustic angiography." Through the use of dual-frequency ultrasound transducer technology, images acquired with this approach possess both high resolution and a high contrast-to-tissue ratio, which enables the visualization of microvascular architecture without significant contribution from background tissues. Additionally, volumetric vessel-tissue integration can be visualized by using b-mode overlays acquired with the same probe. We present a brief technical overview of how the images are acquired, followed by several examples of images of both healthy and diseased tissue volumes. 3D images from alternate modalities often used in preclinical imaging, contrast-enhanced micro-CT and photoacoustics, are also included to provide a perspective on how acoustic angiography has qualitatively similar capabilities to these other techniques. These preliminary images provide visually compelling evidence to suggest that acoustic angiography may serve as a powerful new tool in preclinical and future clinical imaging.


Figures

Figure 1
Figure 1
Photograph of the dual-frequency probe, illustrating the side view (a) and the bottom view (b) showing the two transducer elements. The probe housing is a modified VisualSonics “RMV” transducer housing.
Figure 2
Figure 2
Beam plots showing the −6 dB beamwidth for the (a) 4 MHz (298 μm) and (b) 30 MHz (137 μm) elements. Panel (c) illustrates the confocal alignment of the transducers, where the circles approximate the −6 dB regions of the two transducers. There was a misalignment of approximately 90 μm of the two transducers on this prototype probe due to the challenge of the manufacturing process. Improving the element focal alignment is an obvious way to improve the performance of this system in future iterations.
Figure 3
Figure 3
A frequency domain representation of the signals of all transmit and receive components of acoustic angiography imaging. The tissue and bubble responses were acquired using an experimental system described previously [17] and are displayed here to illustrate the relationship between the bandwidths and the two transducer elements as well as the tissue and bubble responses, for example, acoustic angiography imaging conditions.
Figure 4
Figure 4
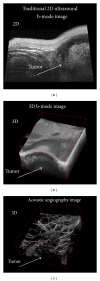
(a) 2D and (b) 3D “b-mode” ultrasound images from the same sample volume illustrating a subcutaneous tumor in a rat. (c) “acoustic angiography” image of the same sample volume as (b) acquired with dual-frequency transducer, illustrating contrast-only image, depicting microvasculature.
Figure 5
Figure 5
(a) An overlay of the microvasculature within a tumor provided by acoustic angiography (red) onto a tissue-only image provided by high frequency b-mode (grayscale). This figure was created using 3D slicer (National Institutes of Health) with a 3D rendering of the acoustic angiography data simultaneously displayed with a grayscale orthoslice of the b-mode data. Displaying data in this fashion illustrates microvessel and tissue morphologies, as well as vascular-tissue integration. Scale bar = 0.5 cm. (b) A cartoon illustrates the approximate location of this 3D image volume.
Figure 6
Figure 6
Multiple comparisons of 3D tissue volumes: two containing a tumor (left) and two healthy controls (right). The bottom images are acoustic angiography maximum intensity projections, while the top images are b-mode acquisitions of the same tissue volumes. The tortuous and chaotic morphologies of the vessels in the presence of a lesion are contrasted by the relatively homogeneous vasculature in the healthy volume (tumor boundaries delineated in acoustic angiography image with dotted line). Image volumes = ~0.75 × 1.25 × 1.5 cm (axial, lateral, and elevational). A cartoon on the right indicates the imaging location and orientations of image volumes.
Figure 7
Figure 7
Comparison of acoustic angiography (a) to a photoacoustic imaging approach (b). The orientations of the acoustic angiography images have been purposefully arranged to mimic the photoacoustic images (adapted, with permission, from authors [20]) to allow a quick comparison between the two modalities. The imaging location of the acoustic angiography image was similar to that presented in Figure 6.
Figure 8
Figure 8
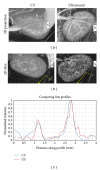
A comparison between the CT and ultrasound images acquired of the same kidney. The slight anatomical warping due to ultrasound probe contact with tissue resulted in a lack of direct one-to-one visual correspondence between the two 3D images, though the same anatomy is contained within each image. (a) Maximum intensity projections of image data. The spleen is visible in each of these images to the right of kidney (indicated with an “S”). (b) En face cuts through the 3D image. (c) Line profiles (dashed yellow lines) across two corresponding vessels near the spleen (dashed yellow lines) suggest similar feature sensitivity.

References

    1. Carmeliet P. Angiogenesis in life, disease and medicine. Nature. 2005;438(7070):932–936. - PubMed
    1. Egeblad M, Nakasone ES, Werb Z. Tumors as organs: complex tissues that interface with the entire organism. Developmental Cell. 2010;18(6):884–901. - PMC - PubMed
    1. Bullitt E, Ewend M, Vredenburgh J, et al. Computerized assessment of vessel morphological changes during treatment of glioblastoma multiforme: report of a case imaged serially by MRA over four years. NeuroImage. 2009;47(2):T143–T151. - PMC - PubMed
    1. Li C-Y, Shan S, Huang Q, et al. Initial stages of tumor cell-induced angiogenesis: evaluation via skin window chambers in rodent models. Journal of the National Cancer Institute. 2000;92(2):143–147. - PubMed
    1. Schambach SJ, Bag S, Groden C, Schilling L, Brockmann MA. Vascular imaging in small rodents using micro-CT. Methods. 2010;50(1):26–35. - PubMed