Review
. 2013 Jul;64(2):175-86.
doi: 10.1016/j.yhbeh.2012.09.013.

A system biology approach to identify regulatory pathways underlying the neuroendocrine control of female puberty in rats and nonhuman primates

Affiliations
Review

A system biology approach to identify regulatory pathways underlying the neuroendocrine control of female puberty in rats and nonhuman primates

Alejandro Lomniczi et al. Horm Behav. 2013 Jul.

Abstract

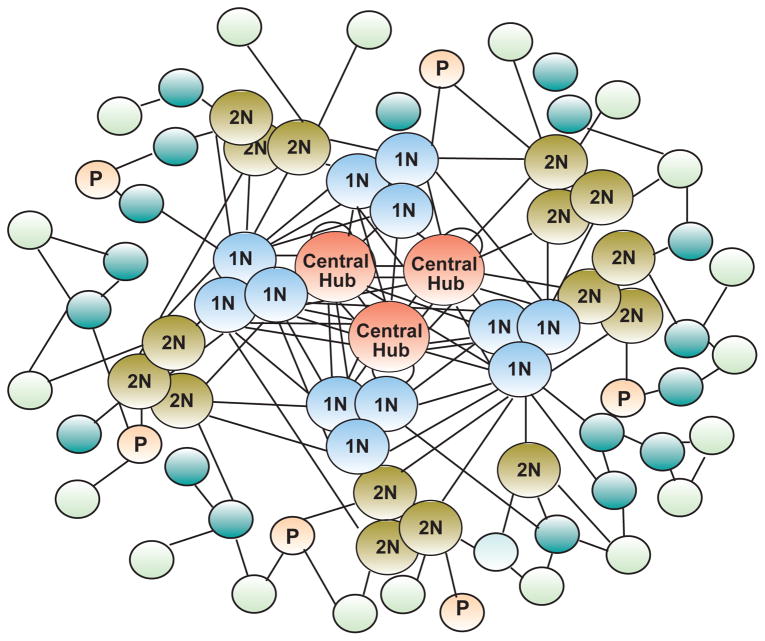
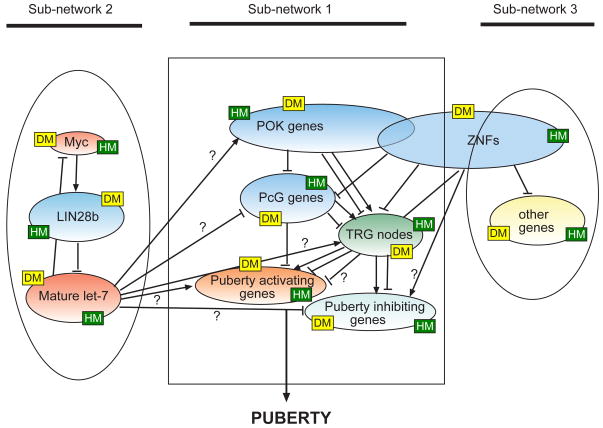
This article is part of a Special Issue "Puberty and Adolescence". Puberty is a major developmental milestone controlled by the interaction of genetic factors and environmental cues of mostly metabolic and circadian nature. An increased pulsatile release of the decapeptide gonadotropin releasing hormone (GnRH) from hypothalamic neurosecretory neurons is required for both the initiation and progression of the pubertal process. This increase is brought about by coordinated changes that occur in neuronal and glial networks associated with GnRH neurons. These changes ultimately result in increased neuronal and glial stimulatory inputs to the GnRH neuronal network and a reduction of transsynaptic inhibitory influences. While some of the major players controlling pubertal GnRH secretion have been identified using gene-centric approaches, much less is known about the system-wide control of the overall process. Because the pubertal activation of GnRH release involves a diversity of cellular phenotypes, and a myriad of intracellular and cell-to-cell signaling molecules, it appears that the overall process is controlled by a highly coordinated and interactive regulatory system involving hundreds, if not thousands, of gene products. In this article we will discuss emerging evidence suggesting that these genes are arranged as functionally connected networks organized, both internally and across sub-networks, in a hierarchical fashion. According to this concept, the core of these networks is composed of transcriptional regulators that, by directing expression of downstream subordinate genes, provide both stability and coordination to the cellular networks involved in initiating the pubertal process. The integrative response of these gene networks to external inputs is postulated to be coordinated by epigenetic mechanisms.

Keywords: Female puberty; Gene networks; Glial–neuronal communication; Hypothalamus; Neuroendocrine control; Neurotransmission; Systems biology; Transcriptional regulation.


Figures

Figure 1
Figure 1
The general organization of a biological network. The individual elements composing the network interact with each other. Some of these elements (P, portals) receive information from the environment; others, function mostly within the network. The central “hubs” or “nodes” are strongly interconnected and direct the flow of information throughout the entire network. Subordinate nodes respond to commands emanating from the central hubs; this information can be relayed to them either directly or via first (1N) and (2N) second “neighbors”. The architectural arrangement of the network is such that they contain “upper echelon” nodes that are highly interconnected, and a multitude of peripheral nodes that become increasing less connected as they move away from the major hubs. The arrangement of first and second nodes in clusters of three illustrates the concept that the network contains “modules”, i.e. sub-groups of genes with highly related functions. Depending on the data type, interactions between nodes (termed “edges”) may represent co-expression, physical association, transcriptional control, or other types of gene or gene product interactions. The nodes are colored according to their relative position within the network: orange = central nodes; light blue = first neighbors; light brown = second neighbors; light orange = portal nodes; dark blue = subordinate nodes located sub-peripherally; light green = most peripherally located nodes.
Figure 2
Figure 2
Bioinformatics pipeline and network construction framework. High-throughput experimental data (such as expression) are analyzed both (i) de novo, via Weighted Gene Co-expression Network Analysis (WGCNA), resulting in network modules and their associated enrichment in Gene Ontology categories, such as biological process, molecular function and subcellular localization, and (ii) by building gene networks based on genes identified in preliminary experiments and/or demonstrating a certain temporal expression profile, drawing from a rich battery of datasets via GeneMANIA, a network construction framework that works within CytoScape. Prediction of functional elements such as transcription factor binding sites further elucidates the gene network through the use of motifs in TRANSFAC and the latest ChIP-seq data in ENCODE. The resulting network is visualized and overlaid with expression data in either CytoScape or BioTapestry, allowing the generation of hypotheses for experimental validation (for instance, via RNAi-mediated silencing). The network can also be analyzed for connectivity using GraphletCounter, a publicly available CytoScape plug-in that computes the number of subnetworks (up to 5 nodes) to which a node is connected. EJ = early juvenile period; LJ = late juvenile period; EP = early proestrus, the phase of puberty in the rat when uterine fluid begin to accumulate indicating increased estrogen secretion; MP = midpuberty, the pubertal phase that correspond to the day of the first preovulatory surge of gonadotropins in the rat; A =adulthood; TFBS = transcription factor binding sites.
Figure 3
Figure 3
Key features of the TRG network. Two modules composed of different types of transcriptional regulators are postulated to be strongly interconnected and to directly control the activity of peripheral nodes via either trans-activational or repressive mechanisms (← = trans-activation; ⊥ = transcriptional repression). In one of these modules, CUTL1 and p53, function as central hubs; in the other, this role is played by TTF1 and EAP1. Both modules regulate the expression of a host of subordinate genes, including puberty activating genes (e.g., KISS1) and genes involved in the inhibitory control of puberty (e.g. opioid peptides, RFRP3/GnIH). The model predicts that the TRG network is subjected to a two-tiered hierarchy of repressive control provided by two modules. One consisting of POK/ZNF genes, would serve are repressor of repressors. The other repressive module is composed of PcG genes. YY1, which in our initial model was considered to be a central TRG node (Roth et al., 2007), can now be assigned to the PcG complex. According to the current model, POK/ZNF proteins repress PcG genes, and in turn PcG proteins repress downstream puberty activating genes. POK/ZNF proteins may also suppress directly downstream genes. Large blue modules = “upstream” transcriptional repressors consisting of three different families of transcription factors; smaller centrally clustered modules of different colors = secondary central modules composed of genetically unrelated genes; peripheral light blue nodes = genes considered to be inhibitory to the pubertal process; peripheral orange nodes = genes considered to be activators of puberty. Lines ending without arrows or blunt ends denote that the nodes are predicted to be connected by in silico analysis (for instance, the presence of transcription factor binding sites in the downstream target gene), but experimental evidence is lacking.
Figure 4
Figure 4. General organization of hypothetical transcriptional regulatory networks controlling the onset of female puberty
This draft model predicts the existence of three functionally connected sub-networks. One of them uses TRGs as central hubs; another uses LIN28b, and a third, less well-defined, is formed by ZNF genes. The latter may overlap considerably with the POK/ZNF module of the TRG network, because several POK genes also contain a kr ppel C2H2 zinc-finger domain core that is characteristic of many ZNFs. Intra and inter sub-networks information is postulated to be dynamically coordinated by epigenetic mechanisms. According to existing information derived from a vast body of literature, including studies performed in our laboratory, these mechanisms involve changes in DNA methylation (DM) and changes in association of modified histones (HM) to gene promoters. The model predicts that the transcriptional inhibition of puberty activating genes is lifted at or before puberty, and replaced by increased trans-activation of gene expression. Simultaneously, puberty-inhibiting genes may be either repressed or experience a reduction of activating inputs. ← = stimulation; ⊥ = Blue denotes transcriptional/post-transcriptional repressors; light red denotes activators; darker green = central nodes with either trans-activating or repressive activity; lighter green = subordinate genes involved in the inhibitory control of puberty, but that are not transcription factors; yellow = other, not yet identified genes.

References

    1. Alexa A, Rahnenfuhrer J, Lengauer T. Improved scoring of functional groups from gene expression data by decorrelating GO graph structure. Bioinformatics. 2006;22:1600–1607. - PubMed
    1. Artenstein AW, Opal SM. Proprotein convertases in health and disease. N Engl J Med. 2011;365:2507–2518. - PubMed
    1. Ashburner M, Ball CA, Blake JA, Botstein D, Butler H, Cherry JM, Davis AP, Dolinski K, Dwight SS, Eppig JT, Harris MA, Hill DP, Issel-Tarver L, Kasarskis A, Lewis S, Matese JC, Richardson JE, Ringwald M, Rubin GM, Sherlock G. Gene ontology: tool for the unification of biology. The Gene Ontology Consortium. Nat Genet. 2000;25:25–29. - PMC - PubMed
    1. Ball MP, Li JB, Gao Y, Lee JH, LeProust EM, Park IH, Xie B, Daley GQ, Church GM. Targeted and genome-scale strategies reveal gene-body methylation signatures in human cells. Nat Biotechnol. 2009;27:361–368. - PMC - PubMed
    1. Basso K, Margolin AA, Stolovitzky G, Klein U, Dalla-Favera R, Califano A. Reverse engineering of regulatory networks in human B cells. Nat Genet. 2005;37:382–390. - PubMed

Publication types