. 2013 Sep;69(Pt 9):1707-16.
doi: 10.1107/S0907444913016429. Epub 2013 Aug 15.

Structure of the AvrBs3-DNA complex provides new insights into the initial thymine-recognition mechanism

Affiliations

Structure of the AvrBs3-DNA complex provides new insights into the initial thymine-recognition mechanism

Stefano Stella et al. Acta Crystallogr D Biol Crystallogr. 2013 Sep.

Abstract

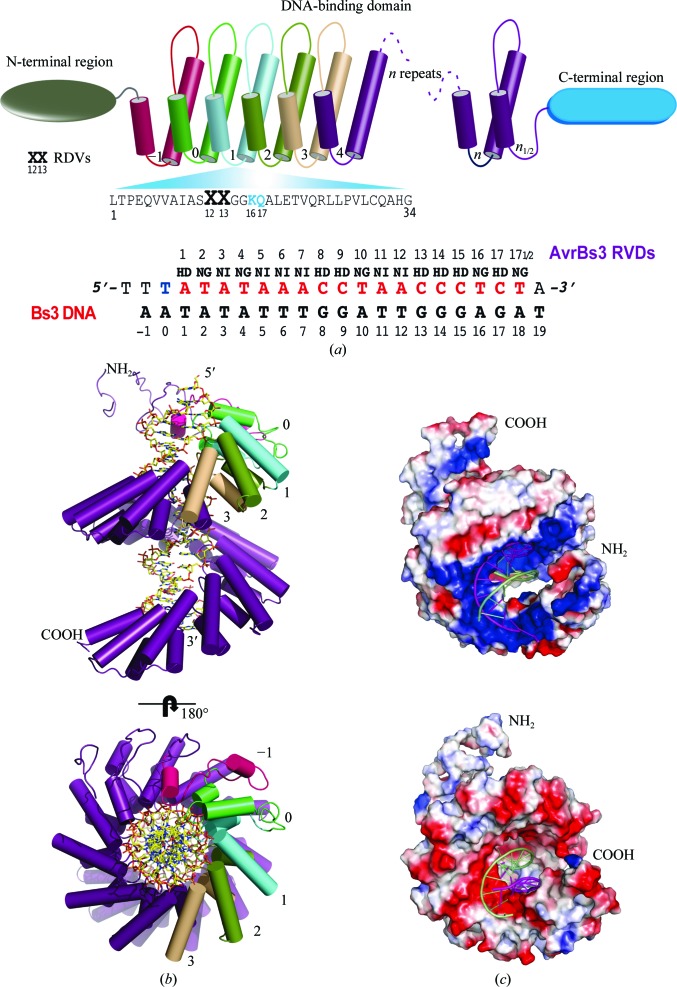
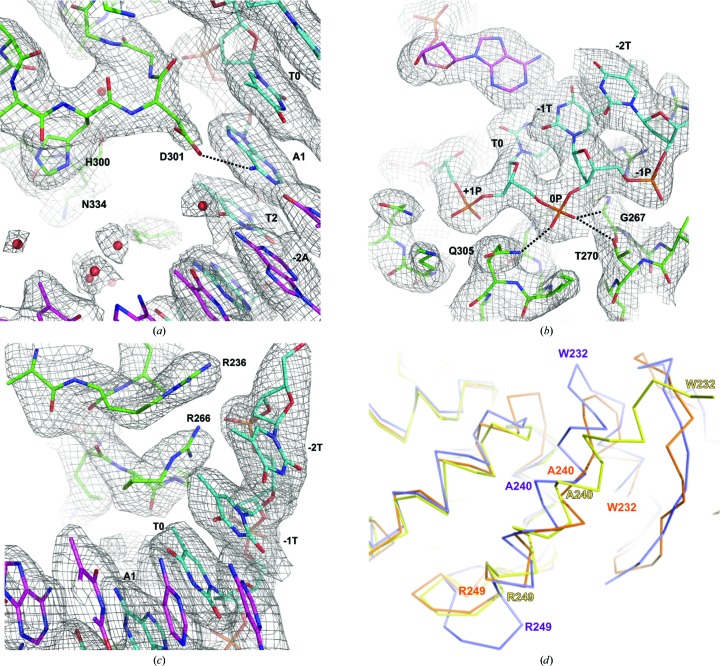
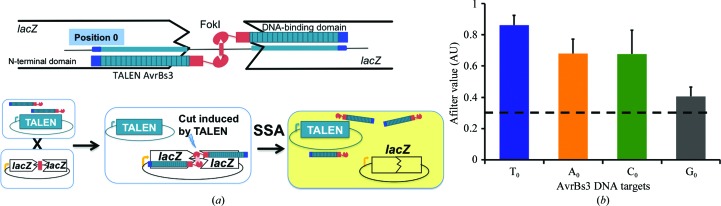
Transcription activator-like effectors contain a DNA-binding domain organized in tandem repeats. The repeats include two adjacent residues known as the repeat variable di-residue, which recognize a single base pair, establishing a direct code between the dipeptides and the target DNA. This feature suggests this scaffold as an excellent candidate to generate new protein-DNA specificities for biotechnological applications. Here, the crystal structure of AvrBs3 (residues 152-895, molecular mass 82 kDa) in complex with its target DNA sequence is presented, revealing a new mode of interaction with the initial thymine of the target sequence, together with an analysis of both the binding specificity and the thermodynamic properties of AvrBs3. This study quantifies the affinity and the specificity between AvrBs3 and its target DNA. Moreover, in vitro and in vivo analyses reveal that AvrBs3 does not show a strict nucleotide-binding preference for the nucleotide at the zero position of the DNA, widening the number of possible sequences that could be targeted by this scaffold.

Keywords: gene targeting; genetics; protein–DNA interaction.


Figures

Figure 1
Figure 1
Crystal structure of the AvrBs3–DNA complex. (a) Sketch of the TALE domain structure. The N-terminus is coloured green and the C-terminus is coloured blue. The central DNA-binding domain contains the RVDs involved in DNA recognition. The sequence of the first repeat (cyan) of AvrBs3 is shown, indicating the position of each amino acid in the repeat. The sequence of the oligonucleotide used in crystallization and the different dipeptides is depicted below. (b) Cartoon representation of the protein–DNA structure perpendicular to the DNA target (upper panel) and along the DNA helix (lower panel). The helices of AvrBs3 are shown as cylinders and repeats −1, 0, 1, 2 and 3 are coloured red, lime, cyan, green and beige, respectively, to indicate the initial DNA domain building blocks. The duplex oligonucleotide is represented in stick mode and the sense-strand sequence is indicated with the corresponding dipeptide for each nucleotide. The dipeptides are represented using the single-letter amino-acid code. (c) Electrostatic surface representation of the AvrBs3 protein in complex with its DNA target. The upper panel depicts the electropositive strip (blue) on the superhelical arrangement running from the amino-terminus to the carboxyl-terminus. The electronegative strip (red) running along the protein in the opposite side is depicted in the lower panel. The sense strand is coloured magenta and the antisense strand is coloured green.
Figure 2
Figure 2
Recognition of the A1 and T0 positions by AvrBs3. (a) The initial HD dipeptide associated with the first adenine in the target sequence. Asp301 forms a hydrogen bond to the amino group of the base. (b) The interactions of T0 with the N-terminal region of AvrBs3. The phosphate of the nucleotide interacts with Thr270, Gln305 and Gly268 through hydrogen bonds. (c) Detailed view of T0 interacting with Arg236 and Arg266 through nonpolar van der Waals interactions. The map in all of the figures is a 2F oF c σA-weighted map contoured at 1.0σ. (d) Superposition of the PthXo1 (purple; PDB entry 3ugm; Mak et al., 2012 ▶), dHax3 (yellow; PDB entry 3v6t; Deng et al., 2012 ▶) and AvrBs3 (orange) protein structures. The DNA moiety is omitted for clarity. Differences among the three TALE structures in the N-terminal region (including the 0 and −1 repeats) can be observed (see Results and discussion and Supplementary Fig. S5).
Figure 3
Figure 3
Thermodynamics of the TALE AvrBS3 binding to wild-type Bs3 and Bs3 A0, C0 and G0 target DNAs. (a) DNA sequence of the Bs3 DNA used in the fluorescence anisotropy and ITC binding assays (see also Supplementary Figs. S6 and S7). (be) DNA-binding profiles in the absence (solid circles) and the presence (open circles) of competitor DNA are depicted. The protein concentration [protein] has units of nM. The ITC assays show the nonlinear regression curve fitting of the data using a single-site binding model (solid circle) and a competitive binding model when the competitor DNA was present in the reaction (open circles). (f) The thermodynamic parameters of binding are reported. The obtained values are the average of four independent experiments. The K A of AvrBs3 association is shown for comparison purposes. Asterisks indicate the values of n, K A and ΔH obtained using a competitive-binding fitting model (see Supplementary Material). 1 cal = 4.186 J.
Figure 4
Figure 4
(a) Principle of the yeast screening assay. A strain harbouring an expression vector encoding a TALEN is mated with a strain harbouring a reporter plasmid. The reporter plasmid bears a lacZ reporter gene interrupted by an insert containing a TALEN target site flanked by two direct repeats. Upon mating, the TALEN generates a double-strand break at the site of interest, allowing the restoration of a functional lacZ gene by SSA and enabling the generation of a blue colour in the presence of X-Gal. The colour was quantified and scored as the Afilter value, a parameter correlated to TALEN nuclease activity. (b) Nuclease activity of the AvrBs3 TALEN towards Bs3 homodimeric targets harbouring either T, A, C or G at position 0. Afilter values obtained with the four different Bs3 homodimeric targets are displayed. The dashed line indicates the experimental background level. The obtained values are the average of three independent experiments.

References

    1. Adams, P. D. et al. (2010). Acta Cryst. D66, 213–221. - PubMed
    1. Arnould, S., Perez, C., Cabaniols, J.-P., Smith, J., Gouble, A., Grizot, S., Epinat, J.-C., Duclert, A., Duchateau, P. & Pâques, F. (2007). J. Mol. Biol. 371, 49–65. - PubMed
    1. Boch, J. & Bonas, U. (2010). Annu. Rev. Phytopathol. 48, 419–436. - PubMed
    1. Boch, J., Scholze, H., Schornack, S., Landgraf, A., Hahn, S., Kay, S., Lahaye, T., Nickstadt, A. & Bonas, U. (2009). Science, 326, 1509–1512. - PubMed
    1. Bogdanove, A. J., Schornack, S. & Lahaye, T. (2010). Curr. Opin. Plant Biol. 13, 394–401. - PubMed

Publication types

MeSH terms