

Combined treatment with low concentrations of decitabine and SAHA causes cell death in leukemic cell lines but not in normal peripheral blood lymphocytes
- PMID: 24000324
- PMCID: PMC3755446
- DOI: 10.1155/2013/659254
Combined treatment with low concentrations of decitabine and SAHA causes cell death in leukemic cell lines but not in normal peripheral blood lymphocytes
Abstract
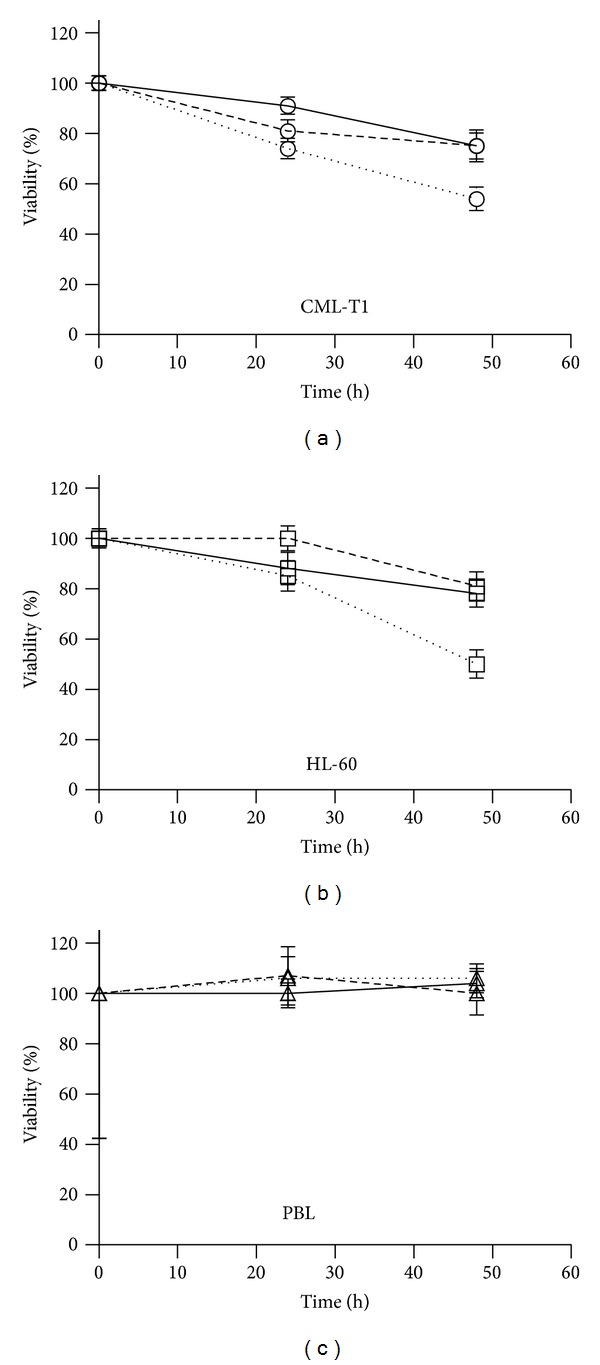
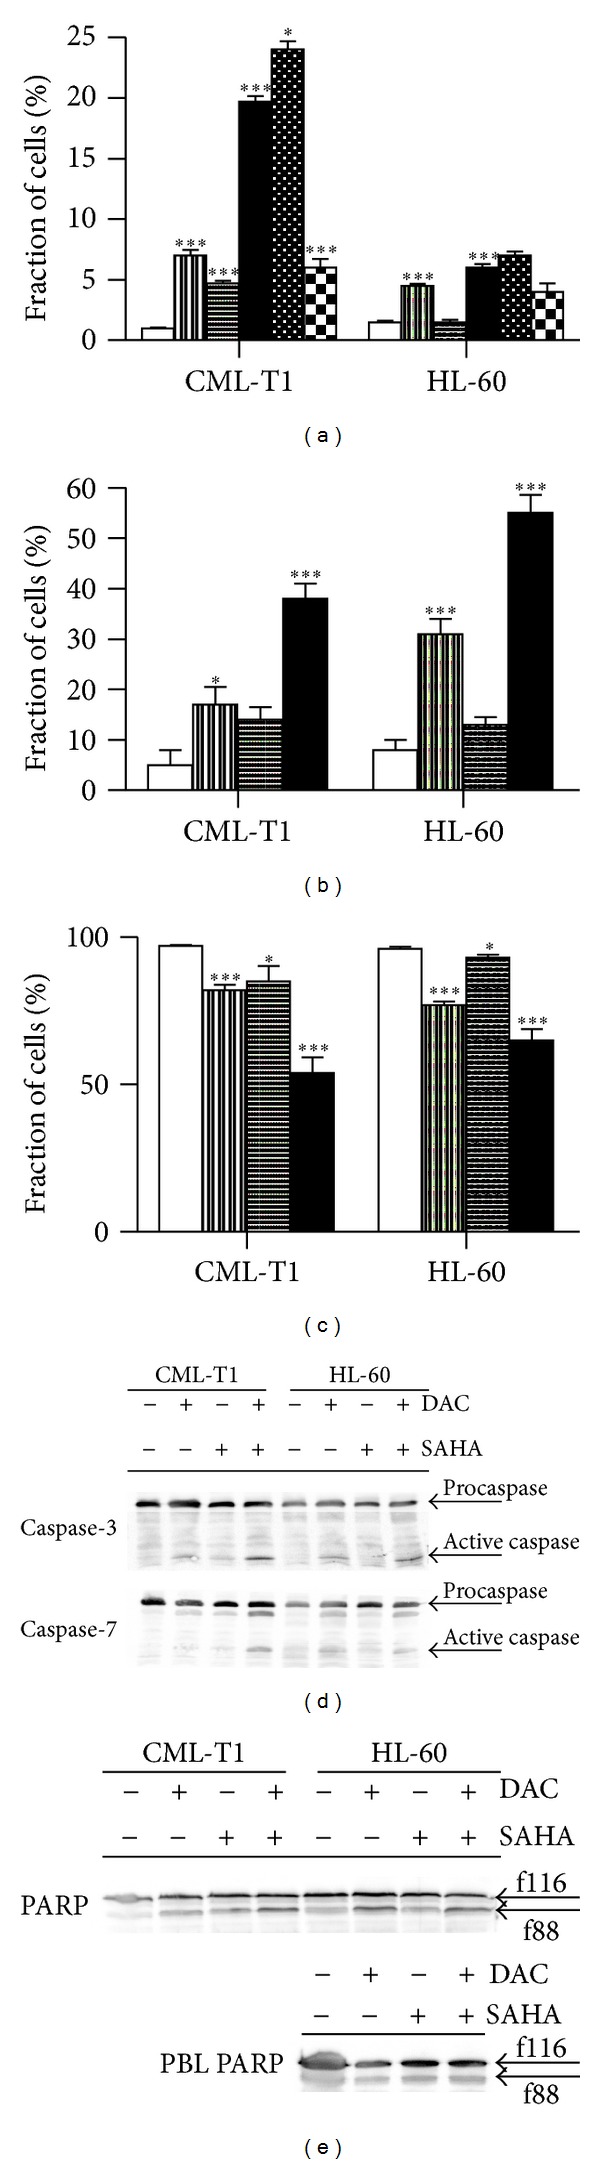
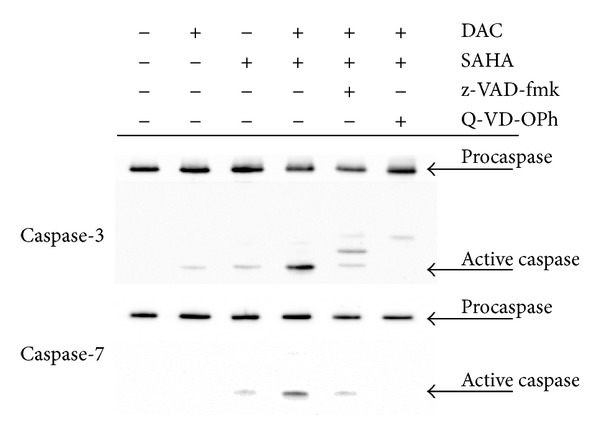
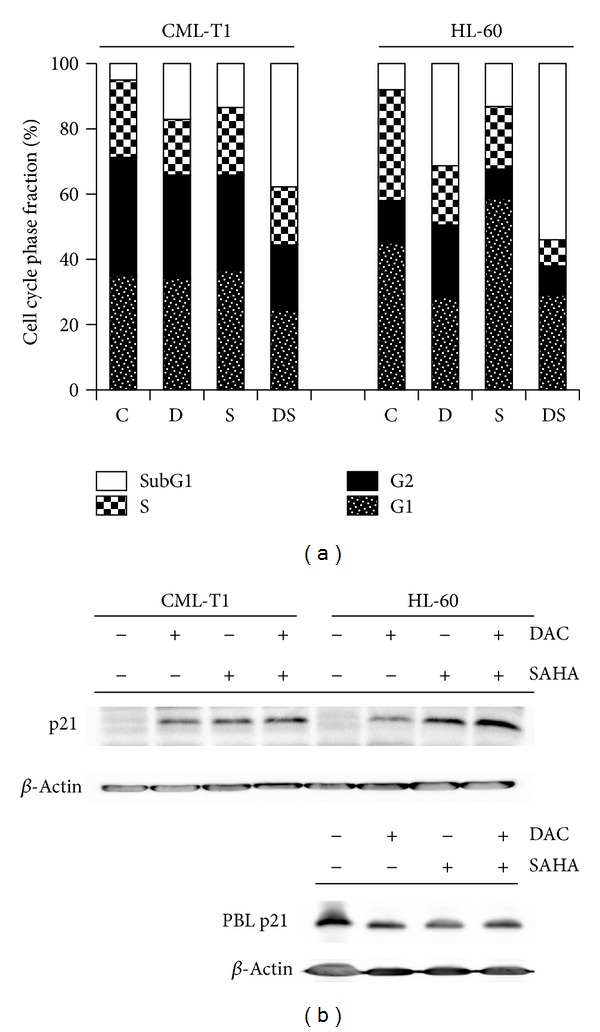
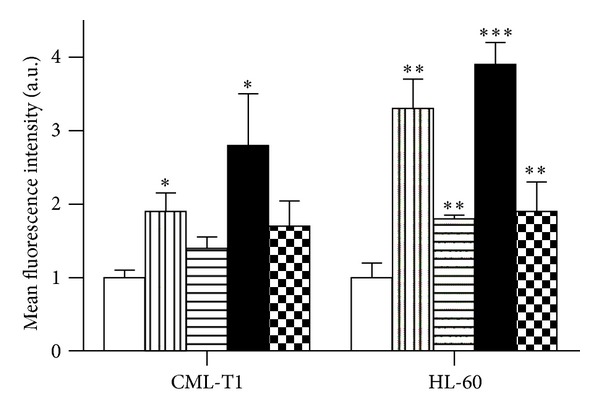
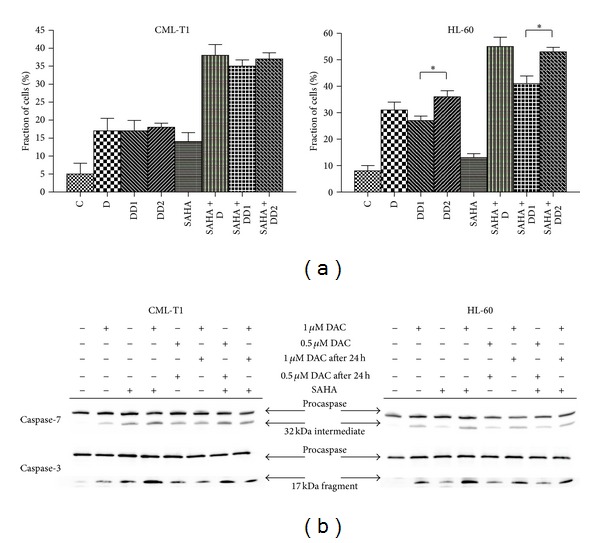
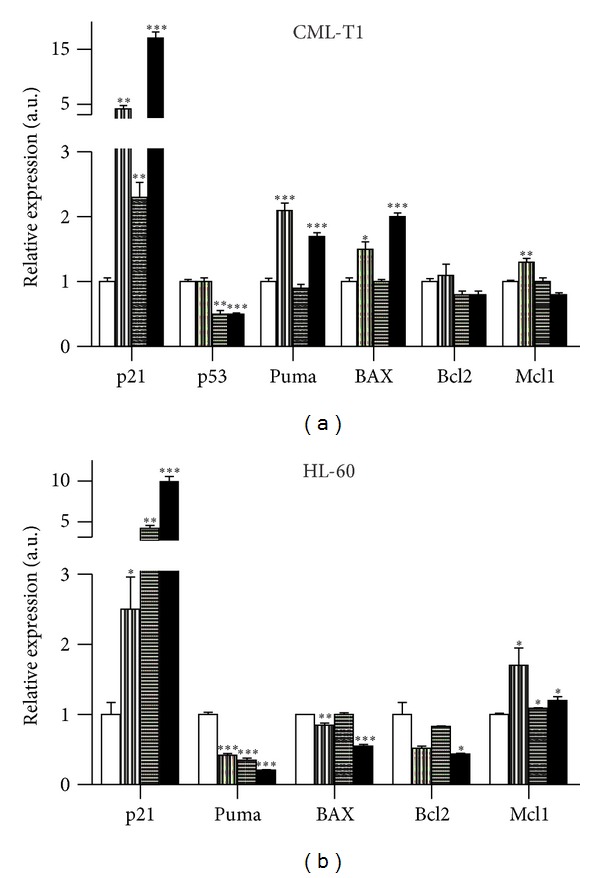
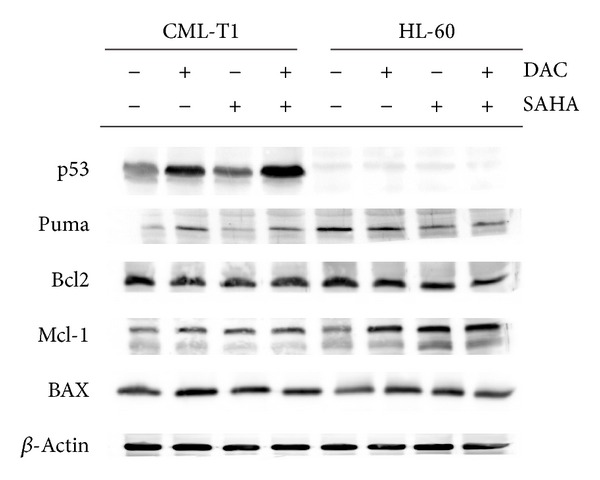
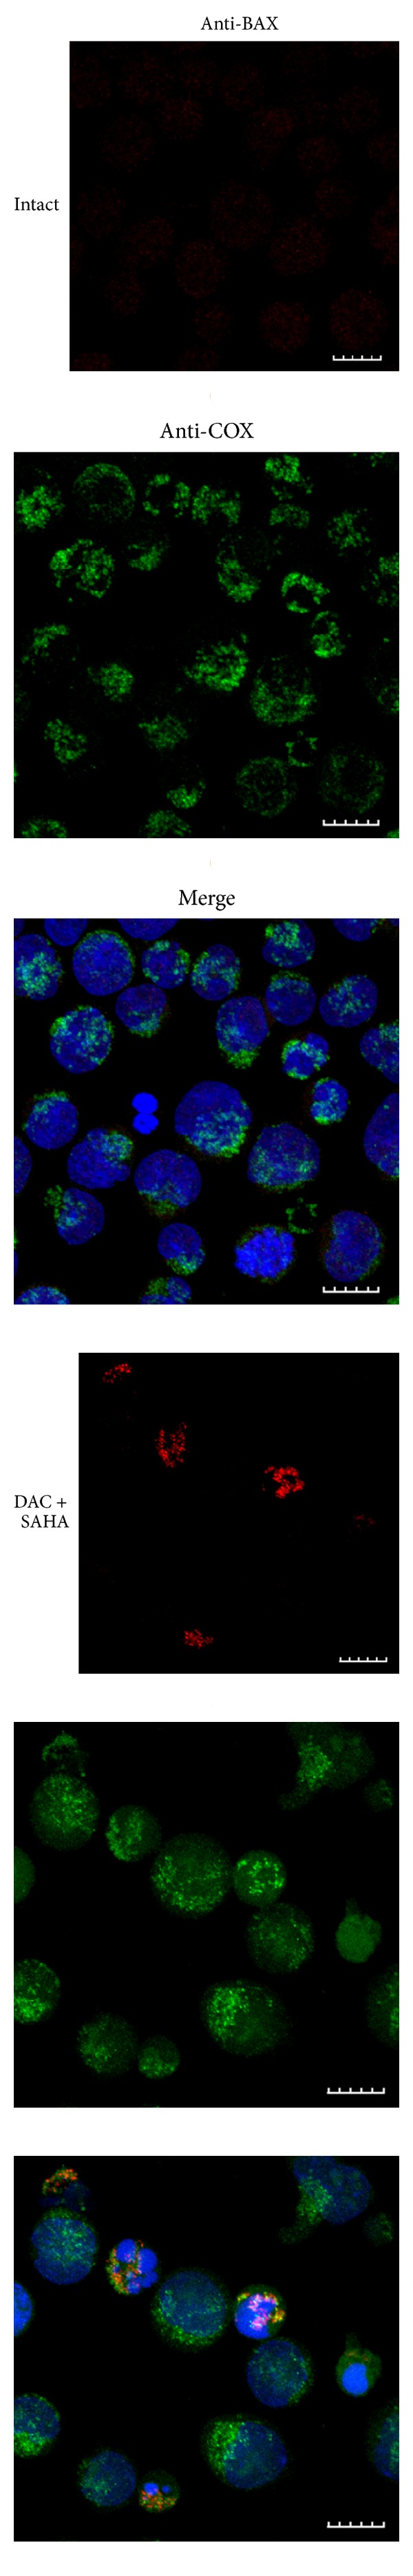
Epigenetic therapy reverting aberrant acetylation or methylation offers the possibility to target preferentially tumor cells and to preserve normal cells. Combination epigenetic therapy may further improve the effect of individual drugs. We investigated combined action of demethylating agent decitabine and histone deacetylase inhibitor SAHA (Vorinostat) on different leukemic cell lines in comparison with peripheral blood lymphocytes. Large decrease of viability, as well as huge p21WAF1 induction, reactive oxygen species formation, and apoptotic features due to combined decitabine and SAHA action were detected in leukemic cell lines irrespective of their p53 status, while essentially no effect was observed in response to the combined drug action in normal peripheral blood lymphocytes of healthy donors. p53-dependent apoptotic pathway was demonstrated to participate in the wtp53 CML-T1 leukemic cell line response, while significant influence of reactive oxygen species on viability decrease has been detected in p53-null HL-60 cell line.
Figures
Similar articles
-
Decitabine and SAHA-induced apoptosis is accompanied by survivin downregulation and potentiated by ATRA in p53-deficient cells.Oxid Med Cell Longev. 2014;2014:165303. doi: 10.1155/2014/165303. Epub 2014 Jul 21. Oxid Med Cell Longev. 2014. PMID: 25140197 Free PMC article.
-
Decitabine-induced apoptosis is derived by Puma and Noxa induction in chronic myeloid leukemia cell line as well as in PBL and is potentiated by SAHA.Mol Cell Biochem. 2011 Apr;350(1-2):71-80. doi: 10.1007/s11010-010-0683-3. Epub 2010 Dec 14. Mol Cell Biochem. 2011. PMID: 21153863
-
Generation of reactive oxygen species during apoptosis induced by DNA-damaging agents and/or histone deacetylase inhibitors.Oxid Med Cell Longev. 2011;2011:253529. doi: 10.1155/2011/253529. Epub 2011 Sep 21. Oxid Med Cell Longev. 2011. PMID: 21949898 Free PMC article.
-
Pharmacological approach for optimization of the dose schedule of 5-Aza-2'-deoxycytidine (Decitabine) for the therapy of leukemia.Leukemia. 1997 Feb;11(2):175-80. doi: 10.1038/sj.leu.2400550. Leukemia. 1997. PMID: 9009076 Review.
-
Clinical development of decitabine as a prototype for an epigenetic drug program.Semin Oncol. 2005 Oct;32(5):465-72. doi: 10.1053/j.seminoncol.2005.07.002. Semin Oncol. 2005. PMID: 16210087 Review.
Cited by
-
Decitabine-Vorinostat combination treatment in acute myeloid leukemia activates pathways with potential for novel triple therapy.Oncotarget. 2017 May 19;8(31):51429-51446. doi: 10.18632/oncotarget.18009. eCollection 2017 Aug 1. Oncotarget. 2017. PMID: 28881658 Free PMC article.
-
Decitabine and SAHA-induced apoptosis is accompanied by survivin downregulation and potentiated by ATRA in p53-deficient cells.Oxid Med Cell Longev. 2014;2014:165303. doi: 10.1155/2014/165303. Epub 2014 Jul 21. Oxid Med Cell Longev. 2014. PMID: 25140197 Free PMC article.
-
Understanding the Mechanisms by Which Epigenetic Modifiers Avert Therapy Resistance in Cancer.Front Oncol. 2020 Jun 24;10:992. doi: 10.3389/fonc.2020.00992. eCollection 2020. Front Oncol. 2020. PMID: 32670880 Free PMC article. Review.
-
Synergistic effect of chidamide and venetoclax on apoptosis in acute myeloid leukemia cells and its mechanism.Ann Transl Med. 2021 Oct;9(20):1575. doi: 10.21037/atm-21-5066. Ann Transl Med. 2021. PMID: 34790781 Free PMC article.
-
Effects of chidamide and its combination with decitabine on proliferation and apoptosis of leukemia cell lines.Am J Transl Res. 2018 Aug 15;10(8):2567-2578. eCollection 2018. Am J Transl Res. 2018. PMID: 30210693 Free PMC article.
References
-
- Sollars VE. Epigenetic modification as an enabling mechanism for leukemic transformation. Frontiers in Bioscience. 2005;10(2):1635–1646. - PubMed
-
- Chan TA, Baylin SB. Epigenetic biomarkers. Current Topics in Microbiology and Immunology. 2012;355:189–216. - PubMed
-
- Ganesan A, Nolan L, Crabb SJ, Packham G. Epigenetic therapy: histone acetylation, DNA methylation and anti-cancer drug discovery. Current Cancer Drug Targets. 2009;9(8):963–981. - PubMed
Publication types
MeSH terms
Substances
LinkOut - more resources
Full Text Sources
Other Literature Sources
Medical
Research Materials
Miscellaneous
