. 2013:4:2410.
doi: 10.1038/ncomms3410.

Drug screening in Scn1a zebrafish mutant identifies clemizole as a potential Dravet syndrome treatment

Affiliations

Drug screening in Scn1a zebrafish mutant identifies clemizole as a potential Dravet syndrome treatment

Scott C Baraban et al. Nat Commun. 2013.

Abstract

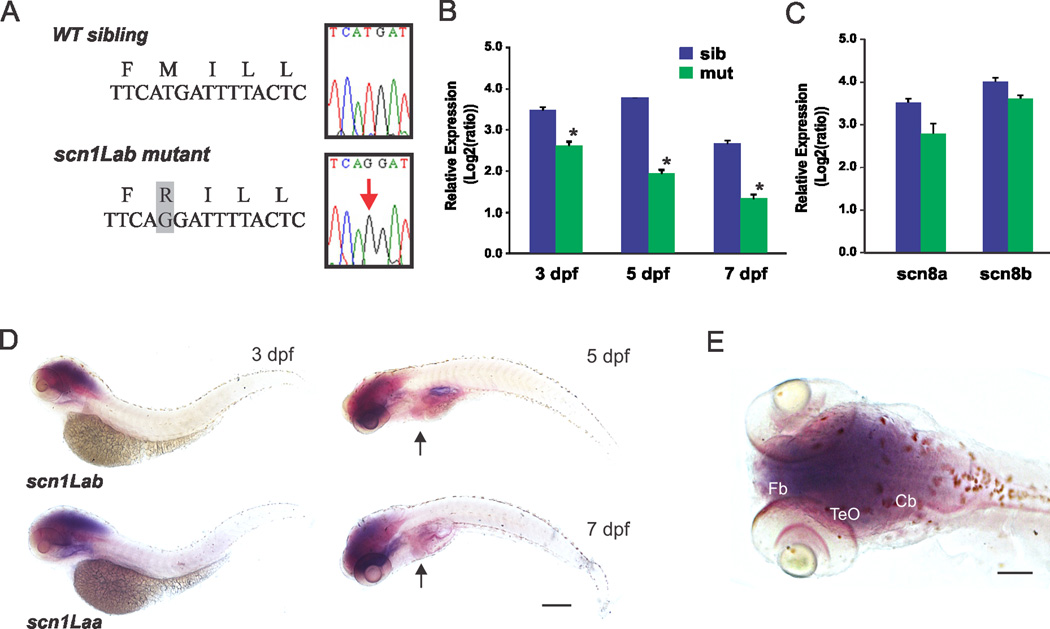
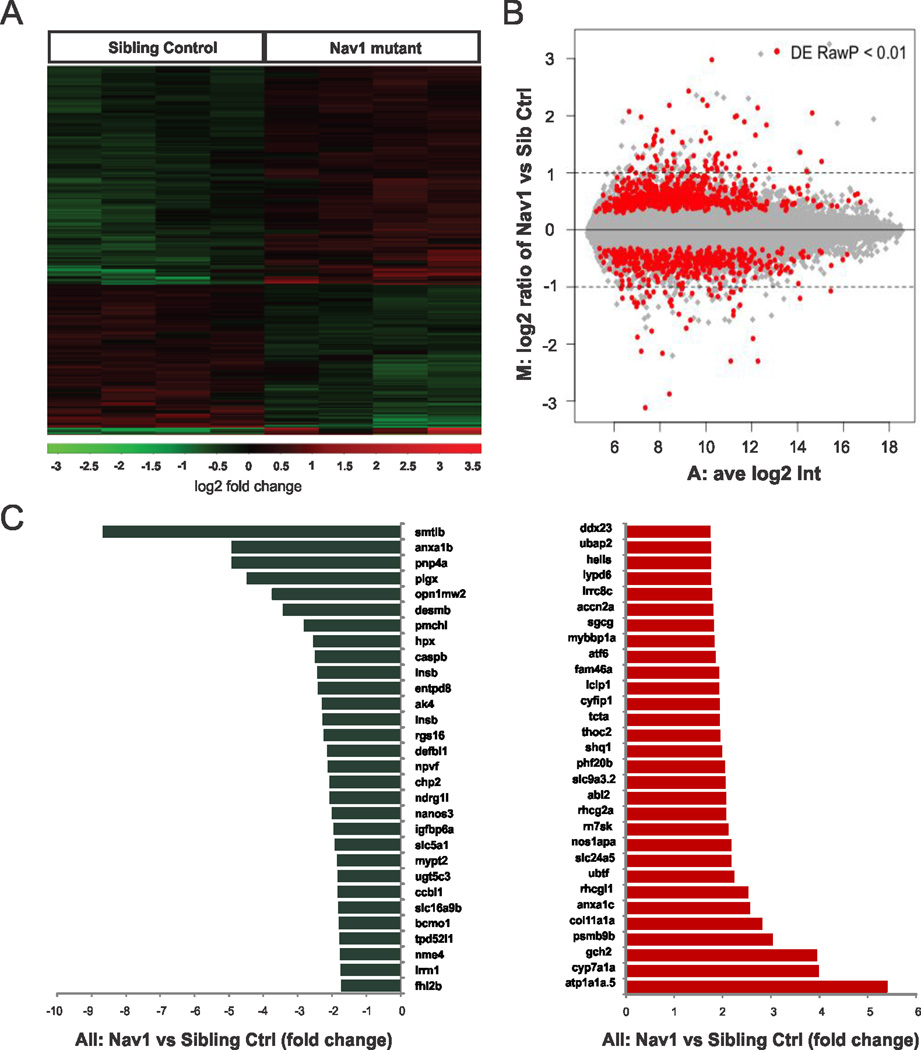
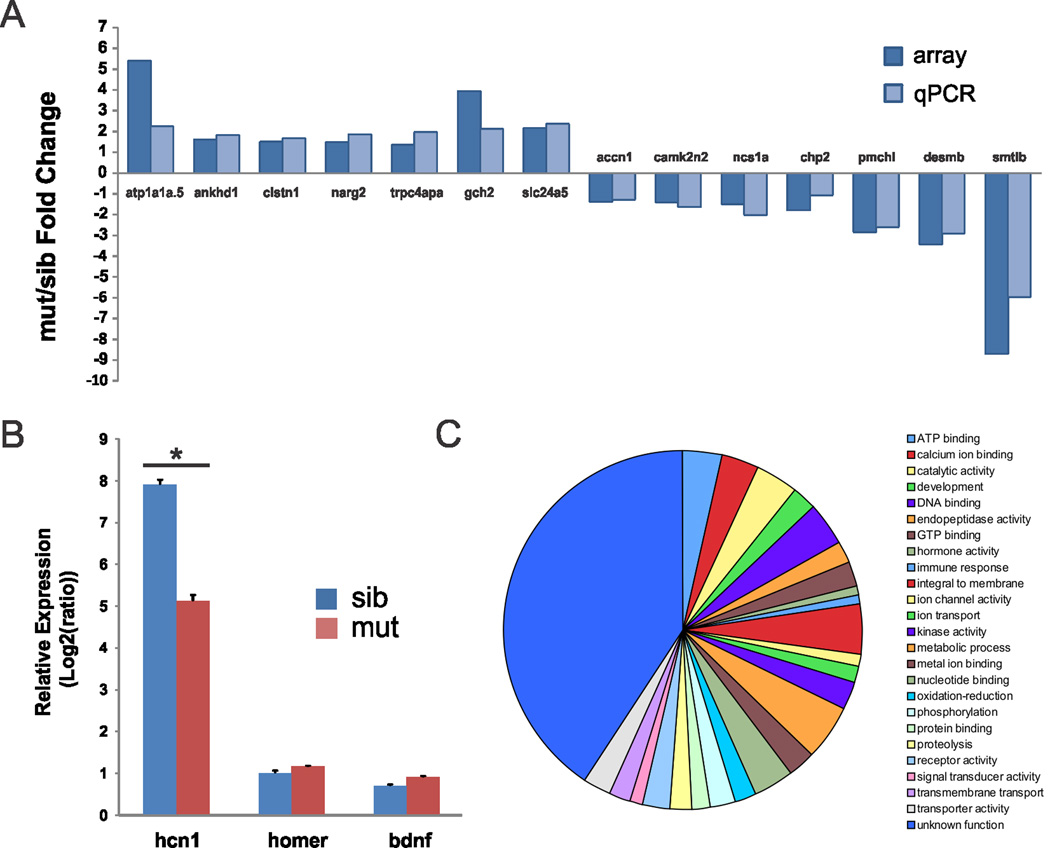
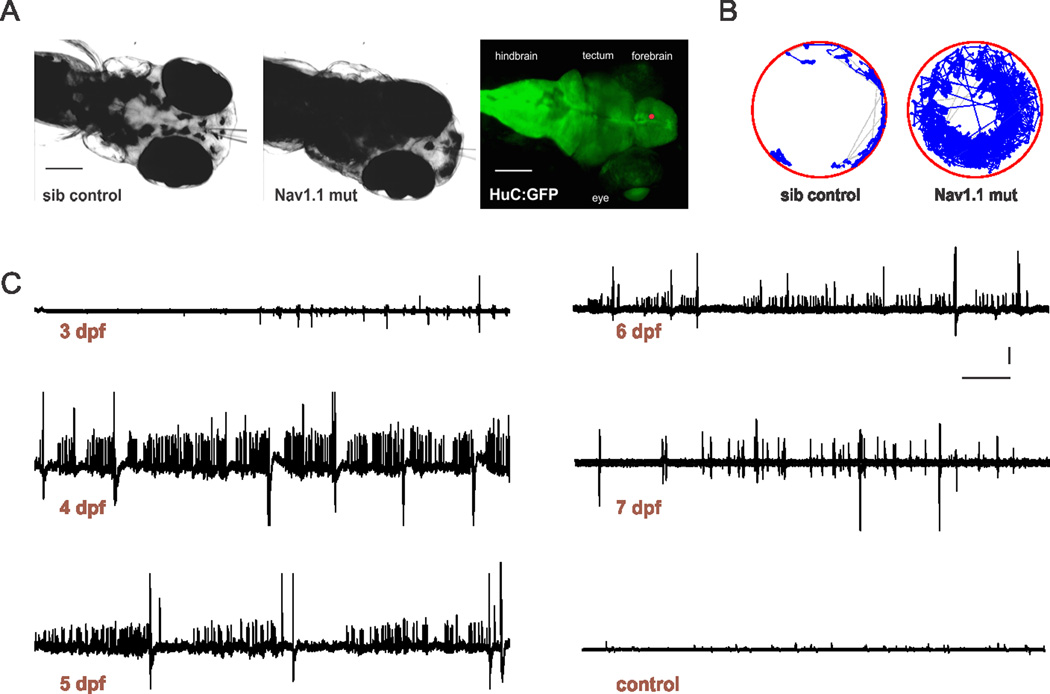
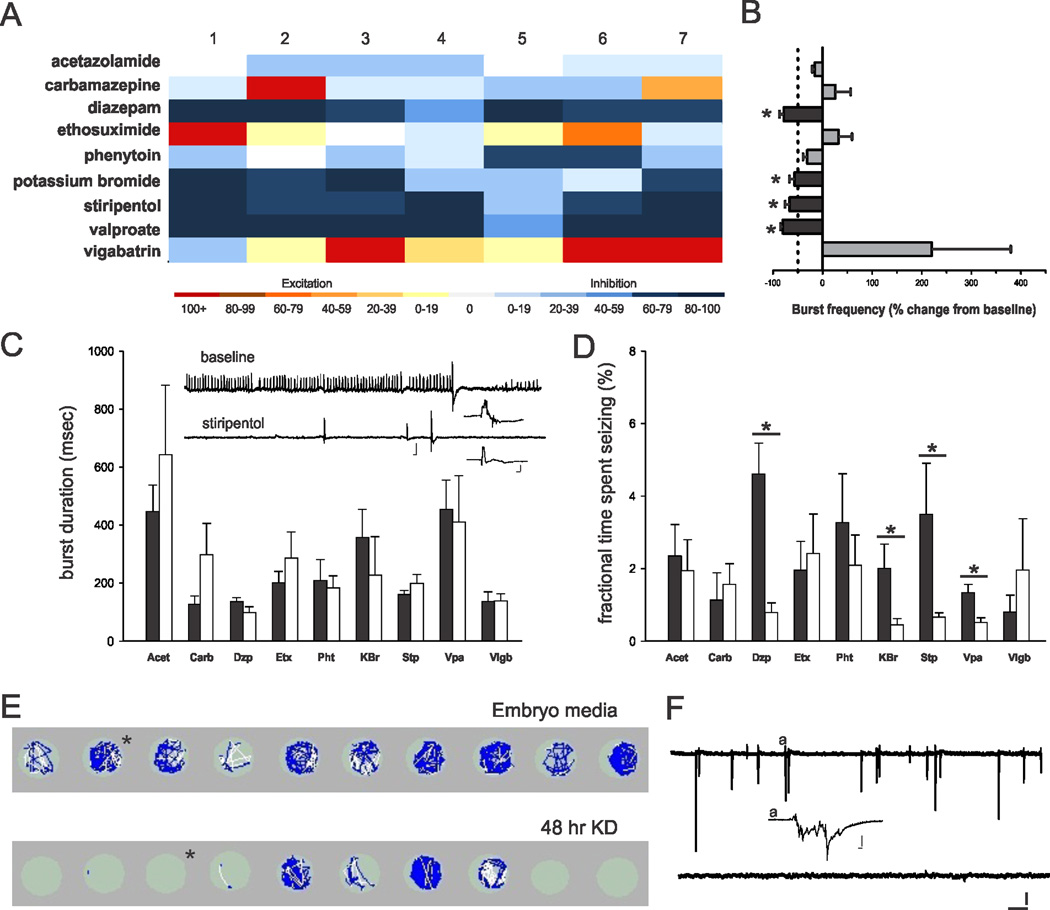
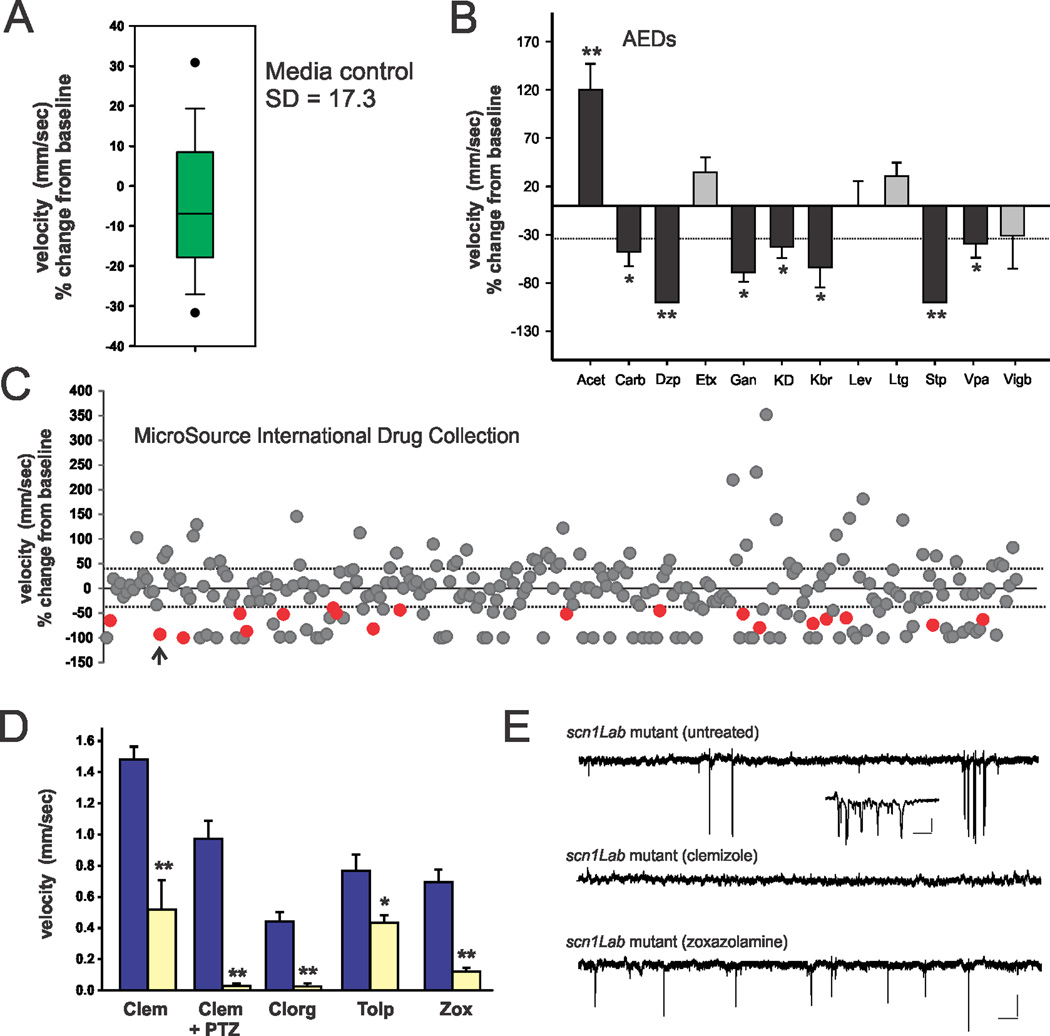
Dravet syndrome is a catastrophic pediatric epilepsy with severe intellectual disability, impaired social development and persistent drug-resistant seizures. One of its primary monogenic causes are mutations in Nav1.1 (SCN1A), a voltage-gated sodium channel. Here we characterize zebrafish Nav1.1 (scn1Lab) mutants originally identified in a chemical mutagenesis screen. Mutants exhibit spontaneous abnormal electrographic activity, hyperactivity and convulsive behaviours. Although scn1Lab expression is reduced, microarray analysis is remarkable for the small fraction of differentially expressed genes (~3%) and lack of compensatory expression changes in other scn subunits. Ketogenic diet, diazepam, valproate, potassium bromide and stiripentol attenuate mutant seizure activity; seven other antiepileptic drugs have no effect. A phenotype-based screen of 320 compounds identifies a US Food and Drug Administration-approved compound (clemizole) that inhibits convulsive behaviours and electrographic seizures. This approach represents a new direction in modelling pediatric epilepsy and could be used to identify novel therapeutics for any monogenic epilepsy disorder.


Conflict of interest statement

The authors have no conflicts of interest to report.

Figures

Figure 1
Figure 1. Molecular characterization of scn1Lab zebrafish mutants
(A) Sequencing confirmed a T-to-G mutation in scn1Lab mutant cDNA. (B) Verification of reduced expression in scn1Lab mutants compared to sibling controls at 3, 5 and 7 dpf using qPCR. Data presented as mean ± S.E.M; *significance taken as p < 0.05 student’s t-test. Data were normalized to internal reference gene β-actin. Values represent averages from five independent biological samples (1 sample = 10 pooled larvae) for each of the 3 developmental stages. Data presented as mean ± S.E.M; *significance taken as p < 0.05 student’s t-test. (C) Relative expression of scn8aa and scn8ab in Nav1.1 mutants (n = 5) and sibling controls (n = 5) at 5 dpf. Data presented as in B. (D) Whole-mount in situ hybridization for scn1Lab in larval zebrafish at 3, 5 and 7 dpf. Wild-type larvae are shown in lateral views; expression is shown in dark purple. Scn1Laa expression at 3 dpf is shown for comparison. Heart indicated by arrowheads in 5 and 7 dpf panels. (E) Dorsal view of scb1Laa expression at 3 dpf; note prominent expression in regions corresponding to the larval zebrafish CNS. Abbreviations: Tel, telencephalon; TeO, optic tectum; Cb, cerebellum. Scale bars = 0.35 mm in D, 0.2 mm in E.
Figure 2
Figure 2. Microarray analysis of scn1Lab zebrafish mutants
(A) Heat maps depicting the expression of genes differentially expressed between scn1Lab mutant and sibling control larvae at 5 dpf. Rows represent individual genes. Columns represent different larvae. Genes that are highly expressed in scn1Lab mutants relative to controls are shown in red. (B) MA plot of normalized microarray data for all 44,000 genes. The log-ratio M and the mean fluorescence intensity A were calculated as the averages for all replicates. (C) A list of the top 30 genes showing the greatest differences (up-regulated genes are shown in red and down-regulated genes are shown in blue) in expression between scn1Lab mutants and sibling controls.
Figure 3
Figure 3. Quantitative RT-PCR analysis of scn1Lab zebrafish mutants
(A) Comparison of the gene expression fold changes obtained by microarray analysis (array) and real-time qPCR analysis. The y-axis represents the average fold change in gene expression of each gene from zebrafish at 5 dpf. The x-axis represents different genes. (B) qPCR analysis of three genes involved in epileptogenesis. The relative gene expression is presented as log2 ratios to the least abundant transcript (log2ΔΔct). Data were normalized to internal reference gene β-actin. Values represent averages from five independent biological samples (1 sample = 10 pooled larvae). Bars indicate S.E.M; *p < 0.05 t-test. (C) Gene ontology classification of differentially expressed genes detected in scn1Lab mutants at 5 dpf (p < 0.05 ANOVA one-way and fold changes >1.5). Biological processes representing at least 5 gene annotations in at least one category are displayed
Figure 4
Figure 4. Spontaneous seizures in scn1Lab zebrafish mutants
(A) Immobilized and agar-embedded zebrafish larvae are shown. Images were obtained using a 4× objective and 2× magnifier on an Olympus upright microscope during forebrain electrophysiological recordings in sibling control (A, left) and scn1Lab mutant (A, middle) larvae at 5 dpf. Note the dark pigmentation for mutants. Recording electrodes can be seen in panels A1-2 and the approximate site of the recording electrode tip in the forebrain (red circle) is shown using a representative HuC:GFP labeled larvae in A, right. Scale bar: 100 µm. (B) Sample locomotion tracking plot for sibling control (B, left) and scn1Lab mutant (B, right) larvae at 5 dpf. (C) Representative 10 min recording epochs obtained in the forebrain of paralyzed, immobilized and agar-embedded scn1Lab mutant larvae between 3 and 7 dpf. Note the presence of small and large amplitude spontaneous burst discharge; additional temporal expansions of seizure activity are shown in Supplemental Figure S1. A representative recording, under identical recording conditions, from a sibling control larvae at 5 dpf is also shown. Scale bar: 2 mV; 30 sec.
Figure 5
Figure 5. Pharmacological validation of scn1Lab zebrafish mutants
(A) Heat map showing the response to nine different AEDs. Each column represents the percent change in burst frequency (baseline − drug/baseline × 100) for one individual zebrafish mutant. Drugs that inhibit seizure events are shown in dark blue. All drugs were tested at a concentration of 1 mM. Note in some trials carbamazepine and vigabatrin increased burst frequency over the initial baseline levels. (B) Plot of the mean change in burst frequency and standard error for the data shown in the heat map. Paired t-test or Wilcoxon signed rank sum test for data that failed the normality test showed significance as follows: diazepam (p = 0.002; n = 7), potassium bromide (p = 0.016; n = 7), stiripentol (p = 0.024; n = 7), and valproate (p = 0.004; n = 7). (C) Plot of the burst duration for all trials shown in A. Data is presented as the mean ± S.E.M. for electrographic seizure events at baseline (black bars) and after drug exposure (white bars). Inset shows a representative 2 min recording during the stiripentol trial; scale bars: large trace 1 mV, 1 sec; small trace, 1 mV, 100 msec. (D) Plot of the fractional time spent seizing for all trials shown in A. Data is presented as the mean ± S.E.M. for electrographic seizure events at baseline (black bars) and after drug exposure (white bars). Student’s t-test or Mann-Whitney-Rank sum test for data that failed the normality test showed significance as follows: diazepam (p = 0.001; n = 7); potassium bromide (p = 0.043; n = 7); stiripentol (p = 0.007; n = 7) and valproate (p = 0.007; n = 7 (E) Locomotion tracking plots for 10 individual mutant larvae raised in embryo media (top row) or the ketogenic diet for 48 hr. Plots show swim velocity and locomotion tracks with darker colors indicative of higher velocities; 10 min trials are shown. (F) Representative 10 min extracellular recording epochs from the same fish shown in E; representative examples are indicated by an * in the locomotion plots. Scale bar: 1 mV, 30 sec. Inset shows burst at higher temporal resolution (indicated by #); scale bar: 1 mV, 100 msec.
Figure 6
Figure 6. Screen to identify drugs that rescue scn1Lab mutant epilepsy phenotype
(A) Box plot of mean velocity (in mm/sec) for two consecutive recordings of mutant larvae in embryo media. The percent change in velocity from baseline (recording #1) vs. experimental (recording #2) is shown. The bottom and top of box represent 25th and 75th percentile, respectively. The horizontal line represents median value; vertical lines encompass the entire range of values. (B) Plot of the effect of AEDs on seizure behavior in scn1Lab mutants.. Bars represent percent change in mean velocity; 6–12 fish per experiment. Drugs tested at 1 mM; diazepam (Dzp; p < 0.001), carbamazepine (Carb; p = 0.024), ganaxolone (Gan; p = 0.003), stiripentol (Stp; p = 0.001), valproate (Vpa;, p = 0.026) and a 48 hr ketogenic diet (KD; p = 0.003) exposure reduced seizure activity, measured as a change in velocity, by more than the standard deviation in control recordings (34 %, dotted line). Acetazolamide (Acet; p < 0.001) and ethosuximide (Etx; p = 0.250) increased seizure behavior; levetiracetam (Lev; p = 0.243), and lamotrigine (Ltg; p = 0.058) had no effect. (C) Plot for all 320 compounds tested. Colored circles (red) represent positive hits; compounds that decreased activity by 100% were generally toxic; 6–12 fish per trial. Arrowhead; first clemizole trial. (D) Plot of drug re-trials on separate mutant clutches; 100 µM per drug; 10 fish per trial. Abbreviations: Clem, clemizole; Clem + PTZ, clemizole + 15 mM PTZ; Clorg, clorgiline; Tolp, tolperisone; Zox, zoxazolamine. Effect of acute clemizole on PTZ-induced seizures shown for wild-type larvae. Bars represent mean ± S.E.M. For panels B and D: Student’s paired t-test or Mann-Whitney Rank Sum test with significance set at p = 0.01 (*) or p < 0.001 (**). (E) Sample electrophysiology recordings from scn1Lab mutants exposed to clemizole in the locomotion assay (D) and then monitored using a forebrain recording (top trace; ictal-like burst shown in inset). Similar traces for an un-treated mutant (middle) and mutant treated with zoxazolamine (bottom). Scale bars: large traces 0.5 mV, 10 s; inset 0.5 mV, 100 msec.

Similar articles

Cited by

References

    1. Harkin LA, et al. The spectrum of SCN1A-related infantile epileptic encephalopathies. Brain. 2007;130:843–852. - PubMed
    1. Mulley JC, et al. SCN1A mutations and epilepsy. Hum. Mutat. 2005;25:535–542. - PubMed
    1. Ceulemans BP, Claes LR, Lagae LG. Clinical correlations of mutations in the SCN1A gene: from febrile seizures to severe myoclonic epilepsy in infancy. Pediatric Neurol. 2004;30:236–243. - PubMed
    1. Bender AC, et al. SCN1A mutations in Dravet syndrome: Impact of interneuron dysfunction on neural networks and cognitive outcome. Epilepsy Beh. 2012;23:177–186. - PMC - PubMed
    1. Catterall WA, Kalume F, Oakley JC. NaV1.1 channels and epilepsy. J. Physiol. 2010;588:1849–1859. - PMC - PubMed

Publication types

MeSH terms