Review
. 2013 Dec;57(12):5792-807.
doi: 10.1128/AAC.00287-13. Epub 2013 Sep 3.

Pharmacokinetic and pharmacodynamic considerations in antimalarial dose optimization

Affiliations
Review

Pharmacokinetic and pharmacodynamic considerations in antimalarial dose optimization

Nicholas J White. Antimicrob Agents Chemother. 2013 Dec.

Abstract

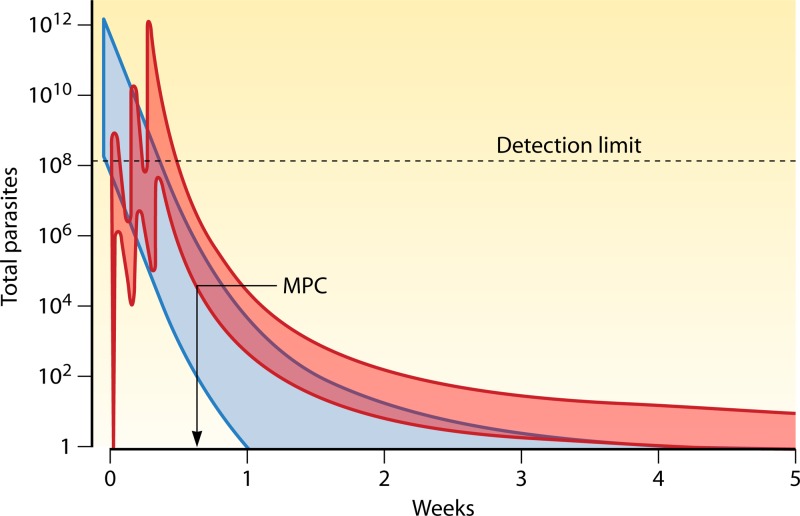
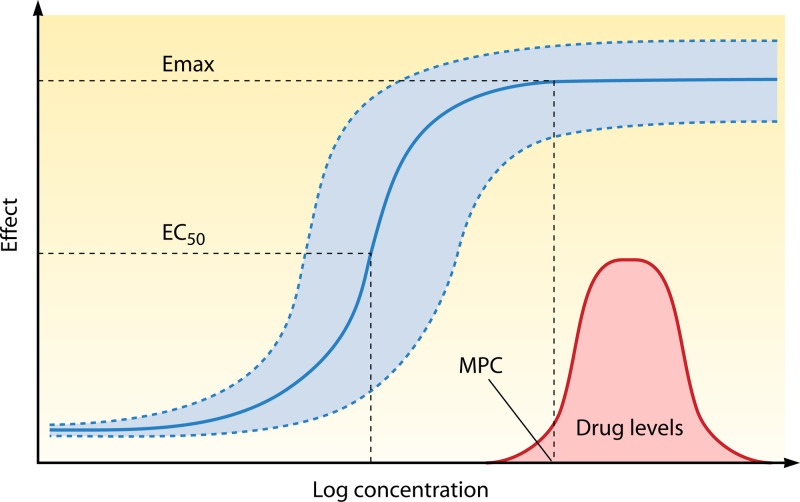
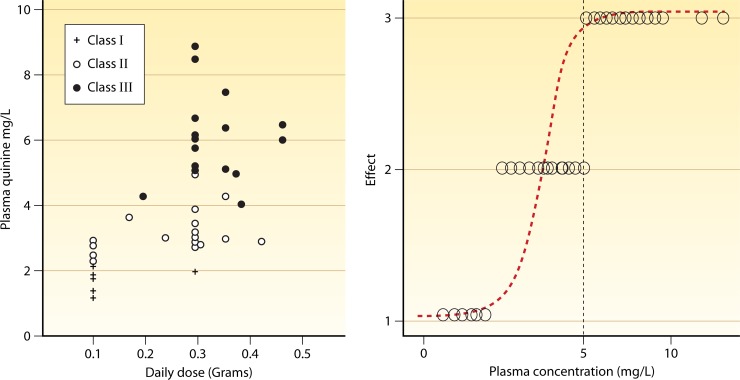
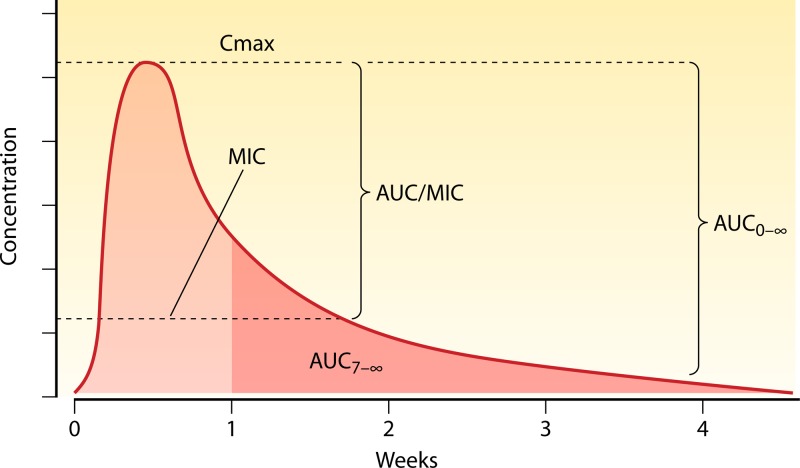
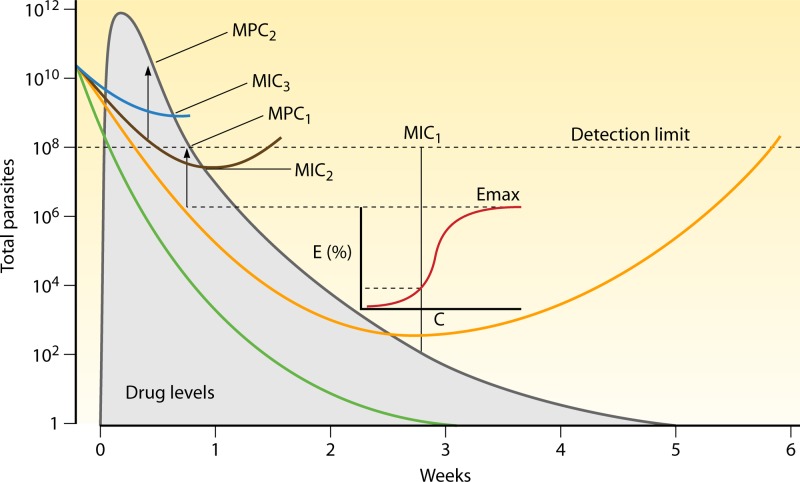
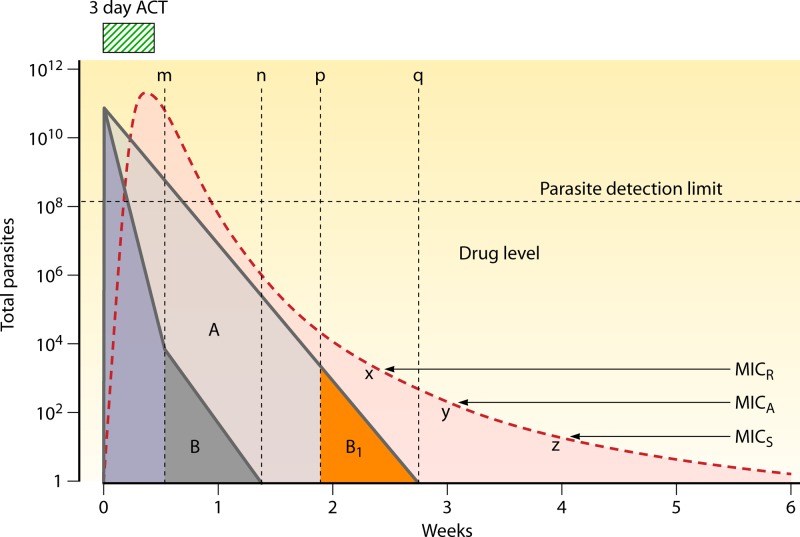
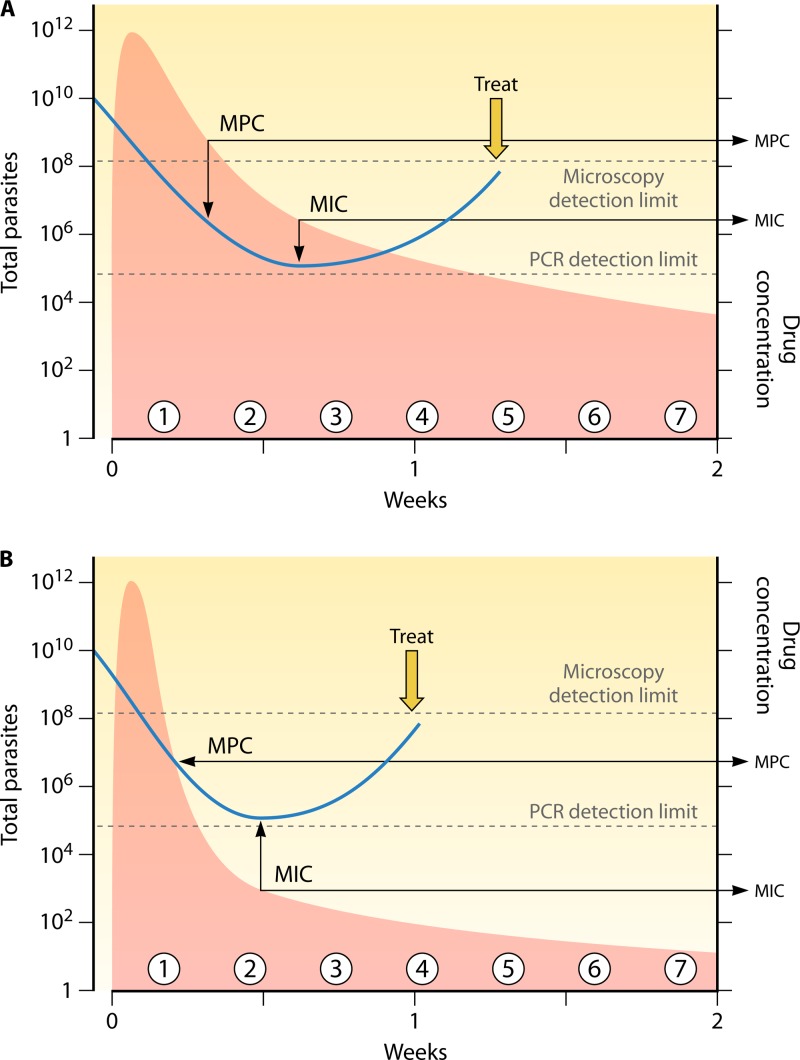
Antimalarial drugs have usually been first deployed in areas of malaria endemicity at doses which were too low, particularly for high-risk groups such as young children and pregnant women. This may accelerate the emergence and spread of resistance, thereby shortening the useful life of the drug, but it is an inevitable consequence of the current imprecise method of dose finding. An alternative approach to dose finding is suggested in which phase 2 studies concentrate initially on pharmacokinetic-pharmacodynamic (PK-PD) characterization and in vivo calibration of in vitro susceptibility information. PD assessment is facilitated in malaria because serial parasite densities are readily assessed by microscopy, and at low densities by quantitative PCR, so that initial therapeutic responses can be quantitated accurately. If the in vivo MIC could be characterized early in phase 2 studies, it would provide a sound basis for the choice of dose in all target populations in subsequent combination treatments. Population PK assessments in phase 2b and phase 3 studies which characterize PK differences between different age groups, clinical disease states, and human populations can then be combined with the PK-PD observations to provide a sound evidence base for dose recommendations in different target groups.


Figures

Fig 1
Fig 1
Population PK-PD responses following a 3-day treatment with a hypothetical slowly eliminated antimalarial drug. The total numbers of malaria parasites in the body over time are depicted in blue in a range of patients presenting with parasite densities between approximately 50 and 200,000/μl. The ranges of drug concentration profiles are shown in red, with the corresponding ranges of parasitological responses in blue. Parasitemia levels cannot be counted reliably by microscopy below 50/μl (corresponding to ∼100,000,000 parasites in the body of an adult). The MPC is the lowest blood, plasma, or free plasma concentration which produces the maximum parasiticidal effect (i.e., the maximum parasite reduction ratio). This corresponds to the concentration associated with first slowing of the first-order (log-linear) decline in parasitemia.
Fig 2
Fig 2
The concentration-effect relationship; for antimalarial drugs, the effect is parasite killing, which can be measured in different ways. The Emax is the maximum parasite killing that a drug can produce, which translates in vivo into the maximum parasite reduction ratio. The EC50 is the blood or plasma concentration providing 50% of maximum killing. The median and range values for a hypothetical population of malaria parasites are shown in blue, and the distribution of average drug levels in patients is shown as a red bell-shaped curve (i.e., concentrations are log-normally distributed). Clearly, some of the patients have average drug levels below the MPC and would not have maximum responses with this dose regimen.
Fig 3
Fig 3
Dose-response relationships obtained between the years 1945 and 1946 for quinine in blood-induced vivax malaria (McCoy strain) in volunteers (38). Plasma concentrations after protein precipitation were measured spectrophotometrically, which overestimates parent compound concentrations. The left box shows the variable relationships between dose and mean plasma concentrations, and the right graph shows the concentration-effect relationship divided into three effect measures: class I, no certain effect; class II, temporary suppression of parasitemia and/or fever; class III, “permanent” effect, i.e., absence of parasitemia for 14 days.
Fig 4
Fig 4
Plasma or blood concentration profile of a slowly eliminated antimalarial drug showing an arbitrary MIC. The AUC is the area under the curve, and Cmax is the maximum concentration in blood or plasma. AUC from 7 days to infinity is shown in darker pink. Blood concentrations are increasingly measured on day 7 in therapeutic assessments of slowly eliminated antimalarials (49).
Fig 5
Fig 5
Different therapeutic responses to a slowly eliminated antimalarial drug in a malaria infection of 1010 parasites (parasite density, ∼2,000/μl). The blood concentration profile in gray is shown in the background. Parasitological responses range from fully sensitive (green) to highly resistant (blue). Each response is associated with a different level of susceptibility and thus a different MIC and MPC (arrows pointing to concentration profile). The inset represents the concentration-effect relationship for the lowest level of resistance (resulting in a late failure), showing corresponding points for the MIC and MPC (orange curve).
Fig 6
Fig 6
The pharmacokinetic-pharmacodynamic profile of artemisinin combination treatment (ACT) (33). The individual patient parasite burden (approximating 20,000 parasites/μl, corresponding to a total of approximately 1011 parasites in an adult) is shown on the vertical axis in a logarithmic scale, and the profile of a slowly eliminated drug's concentrations (illustrated by a single dose of mefloquine) is shown as a red dashed line. The parasites exposed to the antimalarial drugs are shown as triangles. Their areas correspond to total numbers in the blood. The artemisinin component of the treatment is given for 3 days, which covers two asexual cycles. This reduces the parasite burden 100,000,000-fold, which leaves approximately 10,000 parasites (dark gray triangle B) for residual concentrations of mefloquine (from point m to point n) to remove. If no artesunate had been given, the mefloquine would have reduced the parasite burden more slowly (light purple large triangle), and the parasites corresponding to B (i.e., B1) would have been exposed to lower mefloquine concentrations (from point p to point q; orange triangle). In this example, these concentrations would be insufficient to inhibit growth of the most resistant parasites prevalent (MIC; MICR) and so, whereas the ACT would cure all infections provided these blood concentrations were achieved, there would be treatment failures with mefloquine monotherapy. MICA and MICS refer to the average and most sensitive MICs, respectively. The time from point x to point z on the mefloquine elimination curve represents the window of selection (circa 16 days in this example) during which newly acquired infections with sensitive parasites cannot establish themselves whereas resistant parasites can.
Fig 7
Fig 7
Recurrence rates of P. vivax malaria in adult Thai patients following artesunate treatment (given for 5 or 7 days) combined with different durations of primaquine treatment (30 mg base per day; gray circle, 60 mg per day) (57). These were all assumed to represent relapses, as the artesunate regimen is curative and there was no re-exposure. CI, confidence interval.
Fig 8
Fig 8
Median and range plasma concentrations of artesunate (green) and artemether (yellow) and their common biologically active metabolite dihydroartemisinin (red) after intramuscular injection measured during the treatment of adult Vietnamese patients with severe falciparum malaria (70).
Fig 9
Fig 9
Measuring the MIC. (A) The single dose of slowly eliminated antimalarial under investigation results in fever resolution and clearance of parasitemia as estimated by microscopy. Numbers of total parasites in the body of an adult are shown on the vertical axis. As plasma concentrations (shown in pink) fall below the MPC, the rate of decline of parasite density (blue line), which is now being measured by a sensitive PCR method, is reduced, reaching a plateau between the third and fourth posttreatment asexual cycles (around 1 week). The corresponding plasma concentration at this transient steady state, when the parasite multiplication factor is 1, is the MIC. The level of parasitemia then begins to rise as plasma concentrations fall further. (B) The plasma concentration profile is different, with a rapid initial fall as the drug distributes, followed by a slower elimination phase. Interpretation of the parasitemia plateau, and thus the MIC, is less clear. The dose for MIC estimation is chosen to provide MICs when the drug is in the terminal elimination phase while parasitemia levels can still be quantitated by qPCR.
None

References

    1. World Health Organization 2010. Guidelines for the treatment of malaria. World Health Organization, Geneva, Switzerland
    1. Ashley EA, Pinoges L, Turyakira E, Dorsey G, Checchi F, Bukirwa H, van den Broek I, Zongo I, Urruta PP, van Herp M, Balkan S, Taylor WR, Olliaro P, Guthmann JP. 2008. Different methodological approaches to the assessment of in vivo efficacy of three artemisinin-based combination antimalarial treatments for the treatment of uncomplicated falciparum malaria in African children. Malar. J. 7:154.10.1186/1475-2875-7-154 - DOI - PMC - PubMed
    1. World Health Organization 2003. Assessment and monitoring of antimalarial drug efficacy for the treatment of uncomplicated falciparum malaria. World Health Organization, Geneva, Switzerland
    1. Barnes KI, Little F, Smith PJ, Evans A, Watkins WM, White NJ. 2006. Sulfadoxine-pyrimethamine pharmacokinetics in malaria: pediatric dosing implications. Clin. Pharmacol. Ther. 80:582–596 - PubMed
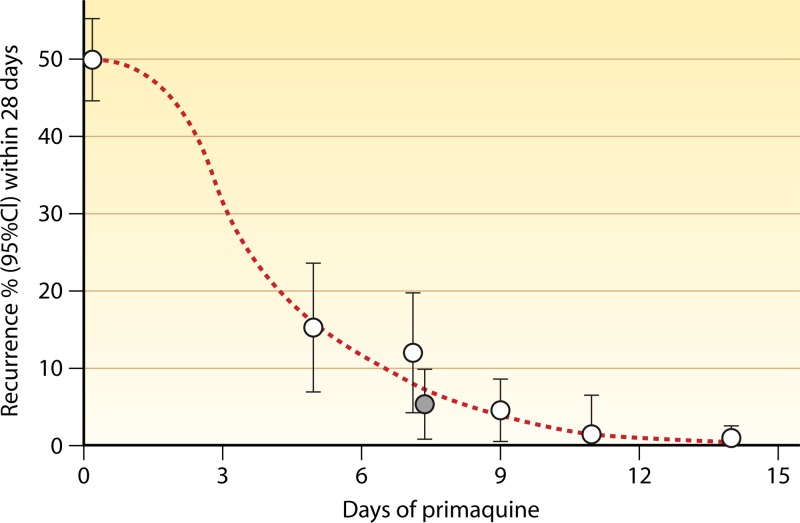
    1. Baird JK, Hoffman SL. 2004. Primaquine therapy for malaria. Clin. Infect. Dis. 39:1336–1345 - PubMed

Publication types

LinkOut - more resources