. 2014 Apr;59(4):1415-26.
doi: 10.1002/hep.26731. Epub 2014 Feb 20.

Immunodominance and functional alterations of tumor-associated antigen-specific CD8+ T-cell responses in hepatocellular carcinoma

Affiliations
Free PMC article

Immunodominance and functional alterations of tumor-associated antigen-specific CD8+ T-cell responses in hepatocellular carcinoma

Tobias Flecken et al. Hepatology. 2014 Apr.
Free PMC article

Abstract

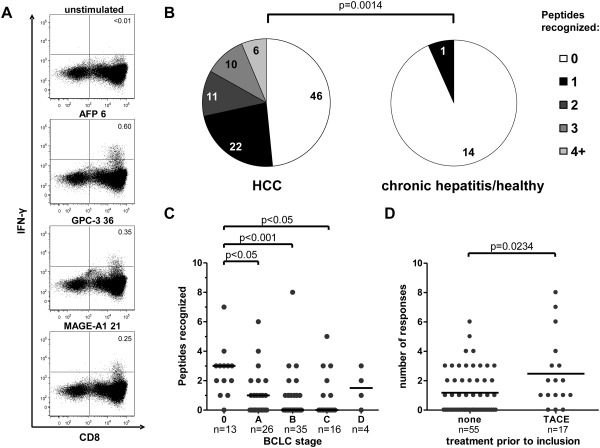
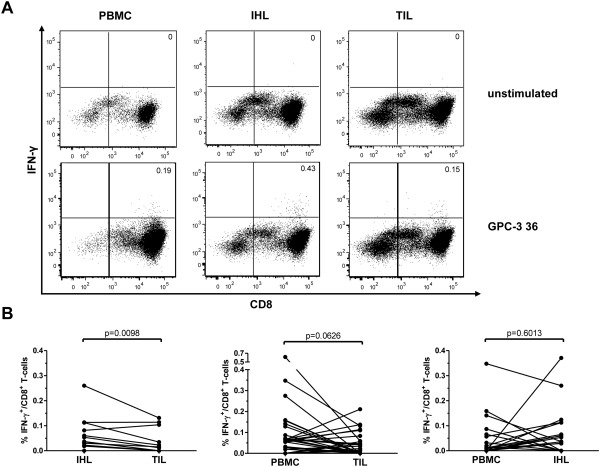
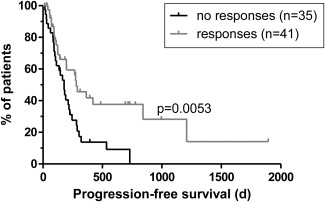
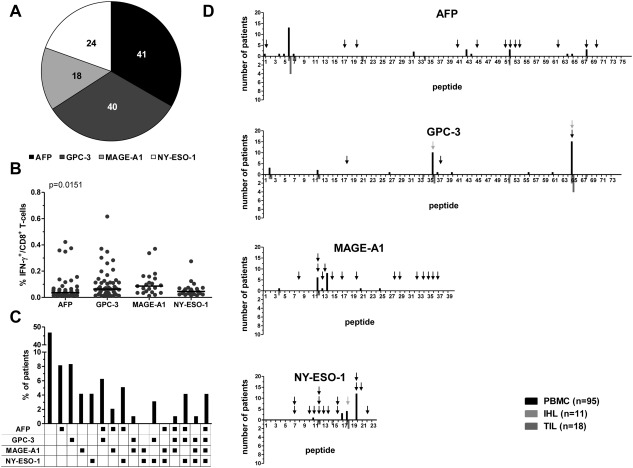
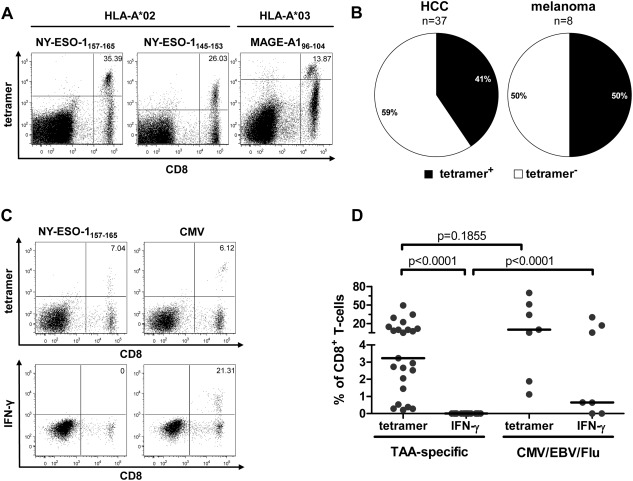
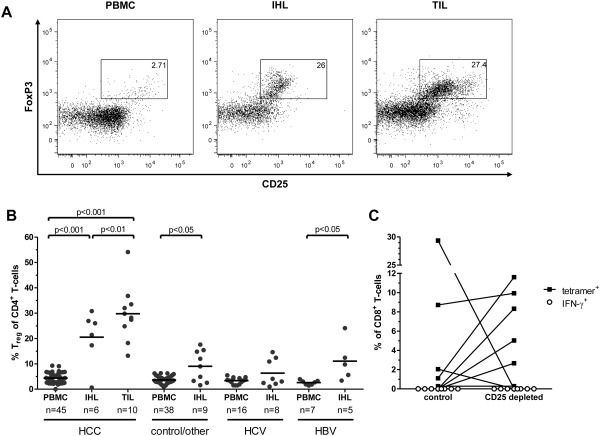
Hepatocellular carcinoma (HCC) is the fifth most common malignancy worldwide with a poor prognosis and limited therapeutic options. To aid the development of novel immunological interventions, we studied the breadth, frequency, and tumor-infiltration of naturally occurring CD8(+) T-cell responses targeting several tumor-associated antigens (TAA). We used overlapping peptides spanning the entire alpha-fetoprotein (AFP), glypican-3 (GPC-3), melanoma-associated gene-A1 (MAGE-A1) and New York-esophageal squamous cell carcinoma-1 (NY-ESO-1) proteins and major-histocompatibility-complex-class-I-tetramers specific for epitopes of MAGE-A1 and NY-ESO-1 to analyze TAA-specific CD8(+) T-cell responses in a large cohort of HCC patients. After nonspecific expansion in vitro, we detected interferon-γ (IFN-γ)-producing CD8(+) T cells specific for all four TAA in the periphery as well as in liver and tumor tissue. These CD8(+) T-cell responses displayed clear immunodominance patterns within each TAA, but no consistent hierarchy was observed between different TAA. Importantly, the response breadth was highest in early-stage HCC and associated with patient survival. After antigen-specific expansion, TAA-specific CD8(+) T cells were detectable by tetramer staining but impaired in their ability to produce IFN-γ. Furthermore, regulatory T cells (Treg) were increased in HCC lesions. Depletion of Treg from cultures improved TAA-specific CD8(+) T-cell proliferation but did not restore IFN-γ-production.

Conclusion: Naturally occurring TAA-specific CD8(+) T-cell responses are present in patients with HCC and therefore constitute part of the normal T-cell repertoire. Moreover, the presence of these responses correlates with patient survival. However, the observation of impaired IFN-γ production suggests that the efficacy of such responses is functionally limited. These findings support the development of strategies that aim to enhance the total TAA-specific CD8(+) T-cell response by therapeutic boosting and/or specificity diversification. However, further research will be required to help unlock the full potential of TAA-specific CD8(+) T-cell responses.


Conflict of interest statement

Potential conflict of interest: Nothing to report.

Figures

Figure 1
Figure 1
Detection of tumor‐associated antigen‐specific CD8+ T cells in patients with HCC. CD8+ T cells were isolated from PBMC by magnetic bead enrichment, antigen‐unspecifically expanded and stimulated with overlapping peptides spanning the entire length of AFP, GPC‐3, MAGE‐A1, and NY‐ESO‐1. Production of IFN‐γ was determined by flow cytometry. (A) Representative dotplots showing production of IFN‐γ in response to the indicated peptides in one HCC patient. Plots were gated on live lymphocytes, numbers indicate %IFN‐γ+/CD8+ T cells. The upper panel shows the unstimulated control. (B) Pie charts comparing the number of CD8+ T‐cell responses to the indicated number of peptides in PBMC of 95 HCC patients and 15 controls. The comparison was performed by Mann‐Whitney U‐test. (C) The number of individual peptides recognized is shown for HCC patients according to BCLC tumor stage (0, very early; A, early; B, intermediate; C, advanced; D, terminal). Each dot represents one patient. Values were compared by Kruskal‐Wallis test. (D) The number of individual peptides recognized within 55 patients that were treatment‐naïve at the time of inclusion is compared to that of 17 patients that had undergone TACE prior to enrollment. Each dot represents one patient. Values were compared by Mann‐Whitney U‐test.
Figure 2
Figure 2
Tumor‐infiltration of TAA‐specific CD8+ T cells. CD8+ T cells were isolated from PBMC, IHL, and TIL and then evaluated as described in the legend to Fig. 1. (A) Representative dotplots showing the production of IFN‐γ in response to the peptide GPC‐3 36 in one HCC patient in PBMC, IHL, and TIL. Numbers indicate %IFN‐γ+/CD8+ T cells. The upper panels show the unstimulated control. (B) Pairwise comparison of response magnitude (%IFN‐γ+/CD8+ T cells) in the different compartments. Each dot represents one peptide‐specific CD8+ T‐cell response. Wilcoxon signed rank test was used.
Figure 3
Figure 3
Correlation between TAA‐specific CD8+ T‐cell responses and patient survival. PFS data are shown for a total of 76 HCC patients. Median PFS was 177 days in patients without and 279 days in patients with detectable TAA‐specific CD8+ T‐cell responses in any of the compartments. Vertical lines indicate censored events. Survival curves were compared by log‐rank test.
Figure 4
Figure 4
Comparison of CD8+ T‐cell responses to different TAA. TAA‐specific CD8+ T‐cell responses from PBMC, IHL, and TIL were combined and compared according to the TAA against which they were directed. (A) Pie chart showing the number of responses observed for each TAA. (B) Comparison of TAA‐specific CD8+ T‐cell response magnitudes to the different TAA. Each dot represents one peptide‐specific CD8+ T‐cell response. The P‐value indicated is the overall heterogeneity determined by Kruskal‐Wallis test; posttests did not reveal significant differences between pairs of groups. (C) The individual combinations of TAA recognized in the patient cohort. (D) Immunodominance profiles for each TAA showing the distribution of responses across the individual overlapping peptides. Responses in CD8+ T cells derived from PBMC (black) are shown above the x‐axis; responses in CD8+ T cells derived from IHL (light gray) and TIL (dark gray) are shown below the x‐axis. Black arrows mark previously described CD8+ T‐cell epitopes; gray arrows mark newly fine‐mapped CD8+ T‐cell epitopes.
Figure 5
Figure 5
Direct detection of TAA‐specific CD8+ T cells by tetramer staining. PBMC isolated from HCC patients were cultured with CD8+ T‐cell epitopes restricted by HLA‐A*02 (NY‐ESO‐1157‐165 and NY‐ESO‐1145‐153) and HLA‐A*03 (MAGE‐A196‐104). After 2 weeks of antigen‐specific expansion, TAA‐specific CD8+ T cells were enumerated with tetramers and assessed for IFN‐γ production after peptide stimulation. (A) Representative dotplots showing tetramer stainings of TAA‐specific CD8+ T‐cell lines from three different patients. Numbers indicate %tetramer+/CD8+ T cells. (B) Pie charts showing the frequency of patients with detectable TAA‐specific tetramer+CD8+ T‐cell populations after expansion. For HCC patients (left), n = 37. For melanoma patients (right), n = 8. (C) Representative tetramer and intracellular IFN‐γ staining data for TAA‐specific and virus‐specific CD8+ T‐cell lines from a patient with HCC. Numbers indicate %tetramer+/CD8+ T cells and %IFN‐γ+/CD8+ T cells, respectively. (D) Comparison of TAA‐specific and virus‐specific CD8+ T‐cell lines. Frequencies of tetramer+ and IFN‐γ+cells among the CD8+ T cells in the culture are shown. Each dot represents a single CD8+ T‐cell response. The paired frequencies within TAA‐specific cells were compared by Wilcoxon matched‐pair test, the others by Mann‐Whitney U‐test.
Figure 6
Figure 6
Presence and activity of Treg in patients with HCC. Physical and functional analyses of Treg were conducted using flow cytometry and magnetic bead depletion, respectively. (A) Representative dotplots showing flow cytometric quantification of Treg in PBMC, IHL, and TIL from a patient with HCC. Cells were gated on CD4+ events. CD25 and FoxP3 expression are displayed. Numbers indicate percentage of Treg characterized as CD25+FoxP3+ cells among CD4+ T cells. (B) Treg frequencies as in (A) in the indicated compartments of patients with HCC, with chronic viral hepatitis or of controls and patients with other forms of hepatitis. Each dot represents one patient; lines indicate mean values. Frequencies were compared by one‐way analysis of variance (ANOVA). Next to the P‐values indicated, frequencies of HCC‐IHL and HCC‐TIL were significantly higher than those of all the other groups (P < 0.05 compared to HBV‐IHL and P < 0.001 compared to all other groups). (C) Effect of Treg‐depletion on TAA‐specific CD8+ T‐cell proliferation and function. Treg were removed from PBMC by depletion of CD25+ cells using magnetic beads prior to culture. Tetramer‐frequencies (black squares) and production of IFN‐γ (white circles) are indicated.

Comment in

References

    1. El‐Serag HB. Hepatocellular carcinoma. N Engl J Med 2011;365:1118–1127 - PubMed
    1. Mellman I, Coukos G, Dranoff G. Cancer immunotherapy comes of age. Nature 2011;480:480–489 - PMC - PubMed
    1. Yoong KF, McNab G, Hubscher SG, Adams DH. Vascular adhesion protein‐1 and ICAM‐1 support the adhesion of tumor‐infiltrating lymphocytes to tumor endothelium in human hepatocellular carcinoma. J Immunol 1998;160:3978–3988 - PubMed
    1. Wada Y, Nakashima O, Kutami R, Yamamoto O, Kojiro M. Clinicopathological study on hepatocellular carcinoma with lymphocytic infiltration. Hepatology 1998;27:407–414 - PubMed
    1. Takayama T, Sekine T, Makuuchi M, Yamasaki S, Kosuge T, Yamamoto J, et al. Adoptive immunotherapy to lower postsurgical recurrence rates of hepatocellular carcinoma: a randomised trial. Lancet 2000;356:802–807 - PubMed

Publication types

MeSH terms