. 2013 Sep 17;110(38):E3622-30.
doi: 10.1073/pnas.1311660110. Epub 2013 Sep 3.

Tissue- and cell-type-specific manifestations of heteroplasmic mtDNA 3243A>G mutation in human induced pluripotent stem cell-derived disease model

Affiliations

Tissue- and cell-type-specific manifestations of heteroplasmic mtDNA 3243A>G mutation in human induced pluripotent stem cell-derived disease model

Riikka H Hämäläinen et al. Proc Natl Acad Sci U S A. .

Abstract

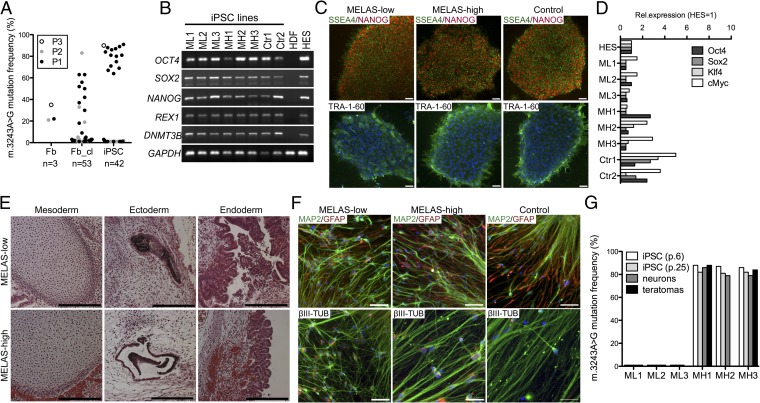
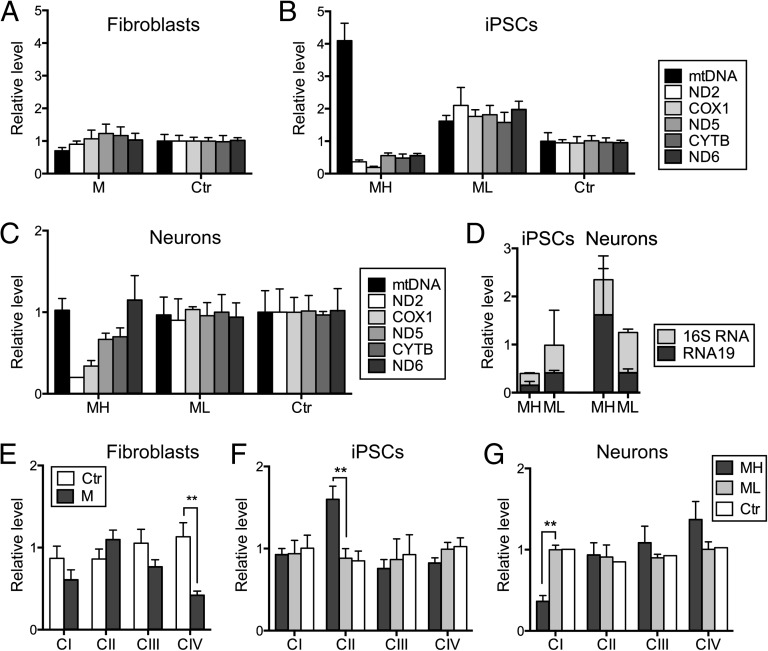
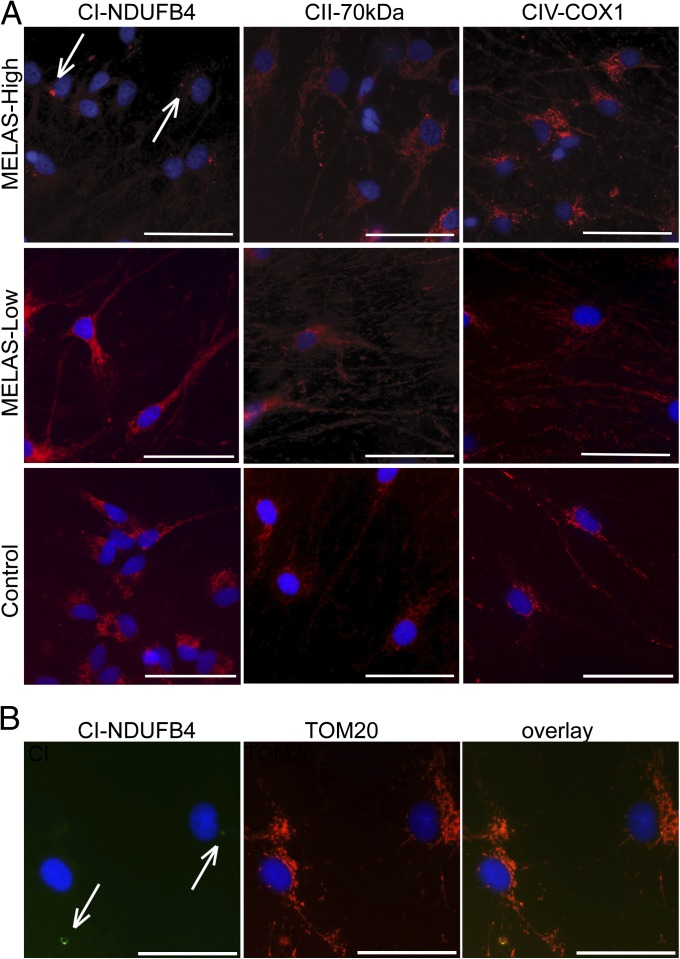
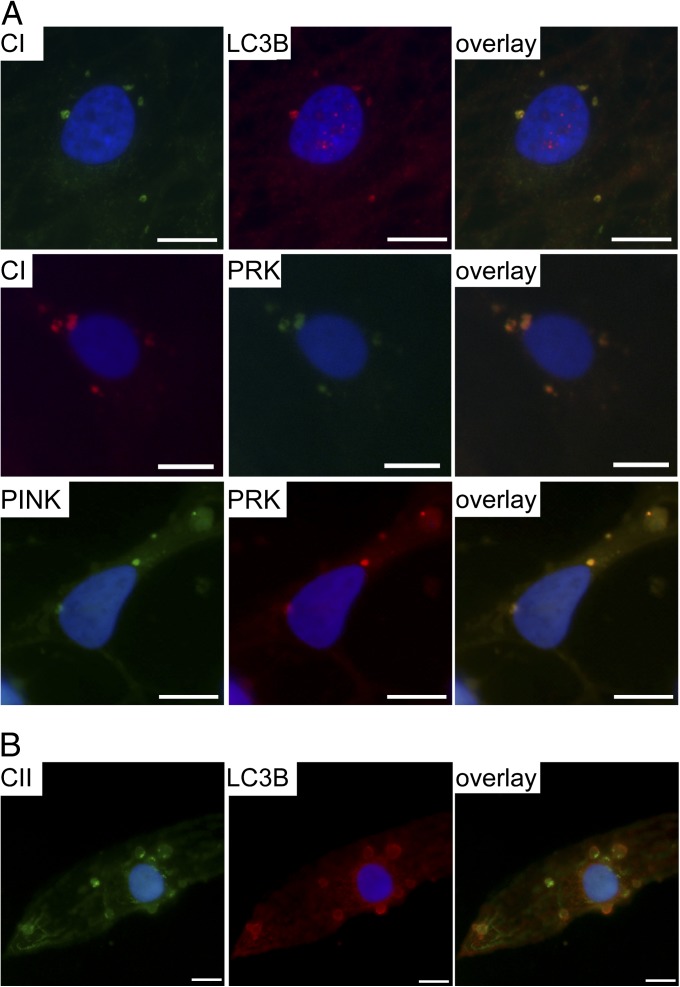
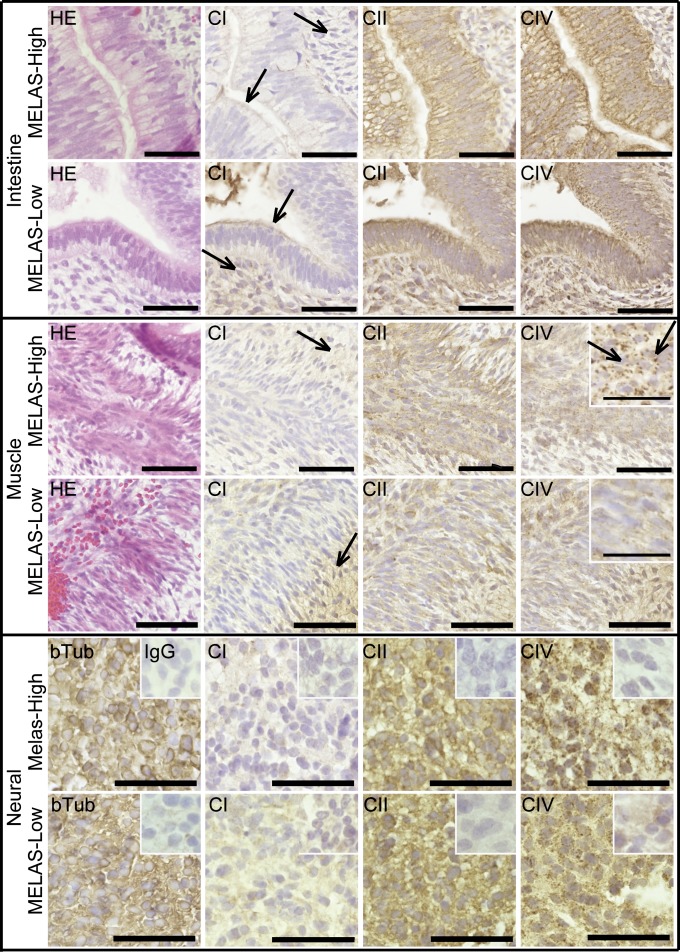
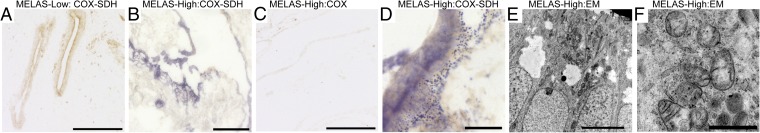
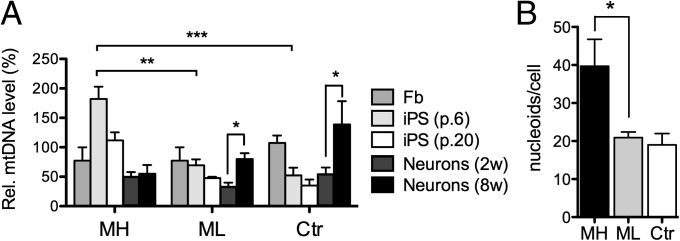
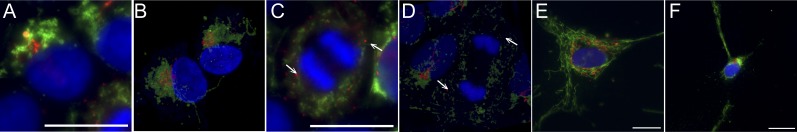
Mitochondrial DNA (mtDNA) mutations manifest with vast clinical heterogeneity. The molecular basis of this variability is mostly unknown because the lack of model systems has hampered mechanistic studies. We generated induced pluripotent stem cells from patients carrying the most common human disease mutation in mtDNA, m.3243A>G, underlying mitochondrial encephalomyopathy, lactic acidosis, and stroke-like episodes (MELAS) syndrome. During reprogramming, heteroplasmic mtDNA showed bimodal segregation toward homoplasmy, with concomitant changes in mtDNA organization, mimicking mtDNA bottleneck during epiblast specification. Induced pluripotent stem cell-derived neurons and various tissues derived from teratomas manifested cell-type specific respiratory chain (RC) deficiency patterns. Similar to MELAS patient tissues, complex I defect predominated. Upon neuronal differentiation, complex I specifically was sequestered in perinuclear PTEN-induced putative kinase 1 (PINK1) and Parkin-positive autophagosomes, suggesting active degradation through mitophagy. Other RC enzymes showed normal mitochondrial network distribution. Our data show that cellular context actively modifies RC deficiency manifestation in MELAS and that autophagy is a significant component of neuronal MELAS pathogenesis.

Keywords: disease modeling; mitochondria.


Conflict of interest statement

The authors declare no conflict of interest.

Figures

Fig. 1.
Fig. 1.
Characterization of MELAS iPSCs. (A) m.3243A>G MELAS mutant mtDNA amount in parental fibroblast cultures (Fb), the reprogrammed iPSC lines (iPSC), and in fibroblast clones from the parental lines (Fb_cl). (B) RT-PCR analysis of ES cell-specific transcripts (OCT4, SOX2, NANOG, REX, and DNMT3B). All patient-derived iPSC clones expressed ES-specific genes similarly to the healthy control iPSCs and ES cells (HDF, human dermal fibroblasts; HES, human embryonic stem cells). (C) Immunofluorescence staining for ES cell-marker proteins TRA-1–60 (green), SSEA4 (green), and NANOG (red). Blue staining for nucleus is DAPI. Colony morphology and ES cell-marker protein expression were similar in all of the clones. (Scale bar, 50 μm.) (D) Expression of OCT4, SOX2, KLF4, and c-MYC compared with that in human ES cells and normalized against cyclophilin, expression. Expression of viral transgenes was down-regulated in all clones. (E) MELAS iPSC lines generated teratomas that differentiated toward all three germ layers independent of the mutation load. (Left) Mesoderm, cartilage; (Center) ectoderm, pigmented epithelia; and (Right) endoderm, intestinal epithelia. (Scale bar, 200 μm.) (F) iPSCs differentiated in vitro into neural cultures consisting of MAP2 and βIII-tubulin positive neurons (green) and GFAP-positive glia (red). DAPI staining for nuclei (blue). (Scale bar, 50 μm.) (G) m.3243A>G mutant mtDNA load in the iPSC lines during culture and in the differentiated cells. The heteroplasmy levels did not change significantly during culture or upon differentiation. MH, MELAS-high; ML, MELAS-low; p., passage number. See also Fig. S1.
Fig. 2.
Fig. 2.
Mitochondrial RC deficiency progresses upon differentiation in cells with high mutant mtDNA load. (A) mtDNA and mitochondrial transcript amounts in fibroblasts, (B) in iPSCs, and (C) in iPSC-derived neurons. Active down-regulation of mitochondrial transcripts is seen in the MELAS-high iPSCs. (D) Quantification of RNA19, a mitochondrial processing intermediate containing 16S rRNA, tRNA-Leu(UUR), and ND1, in MELAS iPSCs and neurons. RNA19 is up-regulated in MELAS-high neurons, but not in iPSCs, when comparing with isogenic cells with low mutant amount. (E) Quantification of Western blot analysis of the parental fibroblasts, (F) the iPSC lines, (G) and iPSC-derived neurons. In fibroblasts, all mitochondrially encoded RC complexes are affected, whereas the iPSC-derived neurons show an isolated CI deficiency. TOM20, a mitochondrial outer membrane transporter protein, not directly involved with mitochondrial respiration, was used as a mitochondrial mass marker. All expression levels are relative to control sample and results are presented as mean ± SEM. (See Fig. S2 for representative Western blots.) CYTB, cytochrome B; M, MELAS; ND2, NADH dehydrogenase subunit 2; ND5, NADH dehydrogenase subunit 5; ND6, NADH dehydrogenase subunit 6, CI–CIV.
Fig. 3.
Fig. 3.
Down-regulation of RC CI in neurons with high mutant mtDNA load. (A) Immunofluorescence analysis of neuronal RC complexes. In the iPSC-derived MELAS-high neurons CI (CI, red; DAPI nuclear counterstaining, blue) resides in few positive perinuclear foci (arrows), whereas it is present in the full mitochondrial network in the soma and neurites in the MELAS-low and control neurons. All cells stained normally for other RC complexes. (Scale bar, 50 μm.) (B) Costaining with mitochondrial marker (TOM20) shows normal mitochondrial network in the cells showing CI clusters (arrows). (Scale bar, 50 μm.) CII-70kDa, complex II 70-kDa subunit; CIV-COX1, cytochrome c oxidase subunit 1; NDUFB4, NADH dehydrogenase 1 beta subcomplex 4. See also Fig. S3.
Fig. 4.
Fig. 4.
Active down-regulation of complex I through mitophagy in neurons with high mutant mtDNA load. (A) Immunofluorescence staining showing colocalization of LC3B and Parkin with CI-positive foci and PINK1 with Parkin in these same aggregates in MELAS-high neurons. (Scale bar, 10 μm.) (B) Active mitophagy with large LC3B-positive autophagosomes containing RC complexes (CII 70-kDa subunit) are seen also later after CI staining becomes undetectable in the aged neurons with high mutation load. See also Fig. S4.
Fig. 5.
Fig. 5.
Low mitochondrial RC CI amount in tissues with high MELAS mutant amount. Immunohistochemical detection of RC complexes (CI with NDUFS3 antibody; CIV with COX-I antibody; CII with CII 70-kDa antibody; and hematoxylin-eosin counterstaining) on serial paraffin sections from MELAS-high and MELAS-low teratomas. βIII-tubulin staining is shown as a neuronal marker. All MELAS-high tissues show very low immunoreactivity for CI (arrows indicate examples of low staining in MELAS-high compared with MELAS-low), but stain strongly for CIV, with a granular appearance in the skeletal muscle (Insets, arrows). Negative mouse IgG controls in inset of neuronal view. Enlarged view in inset of skeletal muscle figure. (Scale bar, 50 μm for intestinal and muscle sections and 25 μm in neural sections and in insets of muscle sections.) See also Fig. S5.
Fig. 6.
Fig. 6.
Mitochondrial RC deficiency in differentiated teratoma tissues. (A) Activity analysis of CII (nuclear-encoded SDH; blue) and CIV (partially mtDNA-encoded COX, cytochrome c oxidase; brown) by histochemical assay on frozen tissue sections. Simultaneous COX-SDH activity analysis of teratoma with low mutant mtDNA amount. MELAS-low teratoma shows normal COX activity, in which case typically SDH activity is not visible. (Scale bar, 200 μm.) (B) COX-SDH activity analysis in MELAS-high teratoma. Large regions of strong SDH activity indicate loss of COX activity, mitochondrial accumulation, and stimulation of CII, whereas (C) COX activity analyzed alone shows slightly decreased activity. (Scale bar, 200 μm.) (D) Large magnification of SDH-positive area showing granular accumulations of SDH-positive mitochondria in MELAS-high teratoma. (Scale bar, 25 μm.) (E) Electron microscopy of MELAS-high teratoma showing large amounts of mitochondria in apical surfaces of intestinal epithelia. (Scale bar, 5 μm.) (F) Larger magnification showing mitochondria with abnormal morphology and inclusions. (Scale bar, 1 μm.)
Fig. 7.
Fig. 7.
Concomitant changes in mtDNA copy-number and cellular organization, mimicking mtDNA bottleneck during reprogramming. (A) Dynamics of mtDNA copy number upon reprogramming and differentiation. 2w, 2 wk of differentiation on laminin; 8w, 8 wk of differentiation on laminin. Data are quantified from two independent experiments with three biological replicates in triplicate. Results are presented relative to control fibroblasts as mean ± SEM. (B) Quantification of mitochondrial nucleoids in MELAS iPSCs with high (MH) or low (ML) mutation load and in Ctr iPSCs, visualized by DNA antibody. The number of nucleoids is increased in MH cells, with the most prominent increase is seen in the largest nucleoids. Results are presented as mean ± SEM. See also Fig. S6.
Fig. 8.
Fig. 8.
Balbiani-body (BB)-like organization of Golgi and mitochondria in iPSCs. (A) Immunofluorescence staining of Golgi (GM130, red) and mitochondria (TOM20, green) in control iPSCs. The nuclei are stained with DAPI (blue). Fragmented mitochondria cluster around Golgi forming a BB-like structure in most of the iPSCs (∼80%) in an unsynchronized culture. No difference is seen between MELAS and control lines. (Scale bar, 20 μm.) (B) Confocal imaging of Golgi and mitochondria in iPSCs. (C) An iPSC undergoing mitosis stained for Golgi and mitochondria. In mitotic iPSCs with condensed chromosomes, the Golgi is disassembled into small vesicles (arrow) and both Golgi and mitochondria are dispersed around the mitotic spindle. (Scale bar, 20 μm.) (D) Confocal imaging of a cell undergoing mitosis. Arrows: Golgi vesicles. (E) Immunofluorescence staining of Golgi and mitochondria in fibroblast and (F) in neuronal cell with mitochondria fused into networks and not clustering around Golgi in any cell-cycle phase. (Scale bar, 20 μm.)

References

    1. Skladal D, Halliday J, Thorburn DR. Minimum birth prevalence of mitochondrial respiratory chain disorders in children. Brain. 2003;126(Pt 8):1905–1912. - PubMed
    1. Elliott HR, Samuels DC, Eden JA, Relton CL, Chinnery PF. Pathogenic mitochondrial DNA mutations are common in the general population. Am J Hum Genet. 2008;83(2):254–260. - PMC - PubMed
    1. Holt IJ, Harding AE, Morgan-Hughes JA. Deletions of muscle mitochondrial DNA in patients with mitochondrial myopathies. Nature. 1988;331(6158):717–719. - PubMed
    1. Wallace DC, et al. Mitochondrial DNA mutation associated with Leber’s hereditary optic neuropathy. Science. 1988;242(4884):1427–1430. - PubMed
    1. Ylikallio E, Suomalainen A. Mechanisms of mitochondrial diseases. Ann Med. 2012;44(1):41–59. - PubMed

Publication types

MeSH terms