

Dielectrophoretic sorting of membrane protein nanocrystals
- PMID: 24004002
- PMCID: PMC3894612
- DOI: 10.1021/nn403760q
Dielectrophoretic sorting of membrane protein nanocrystals
Abstract
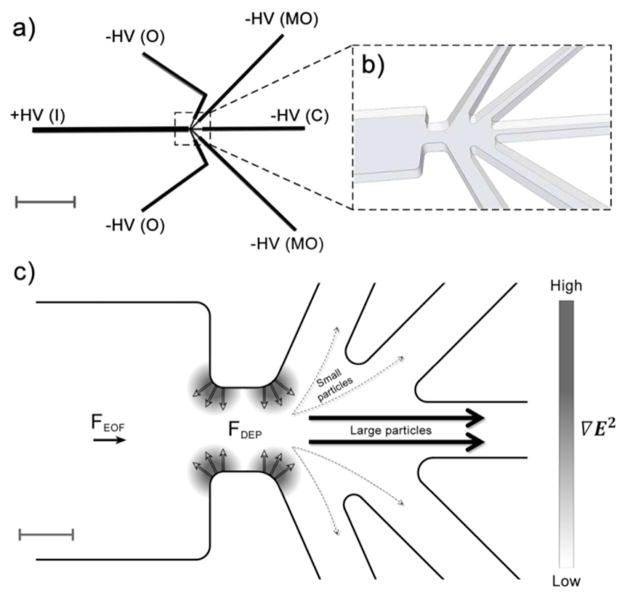
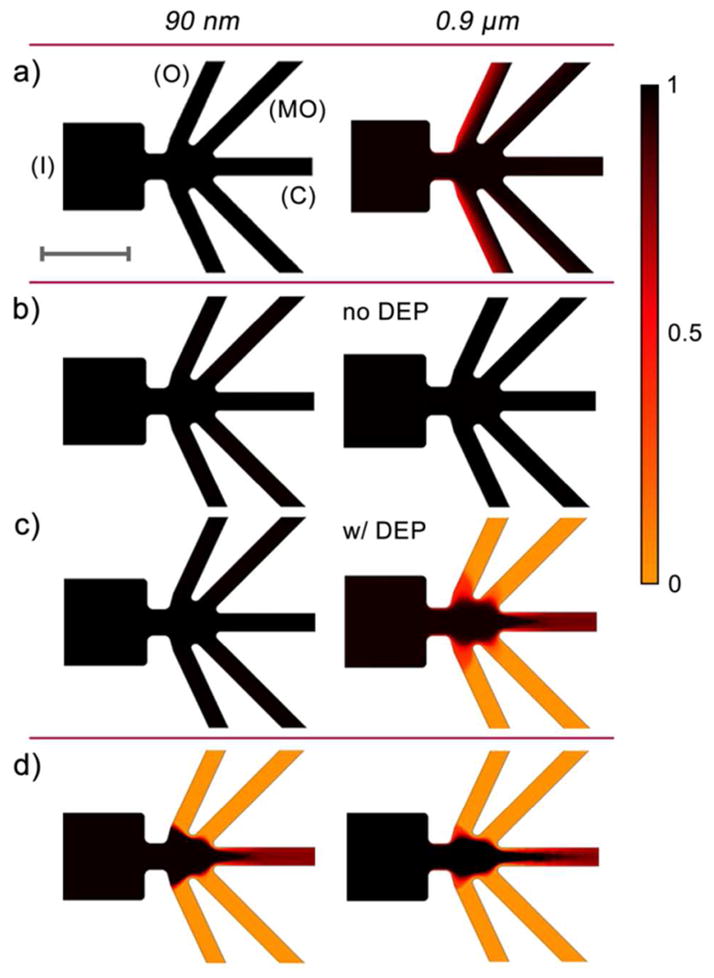
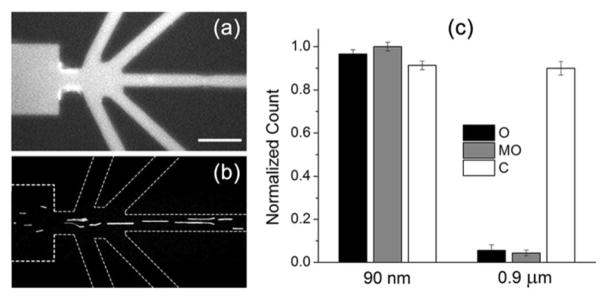
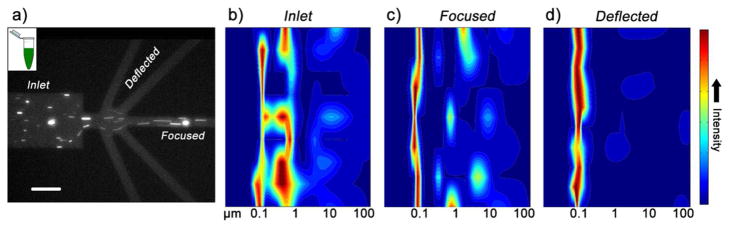
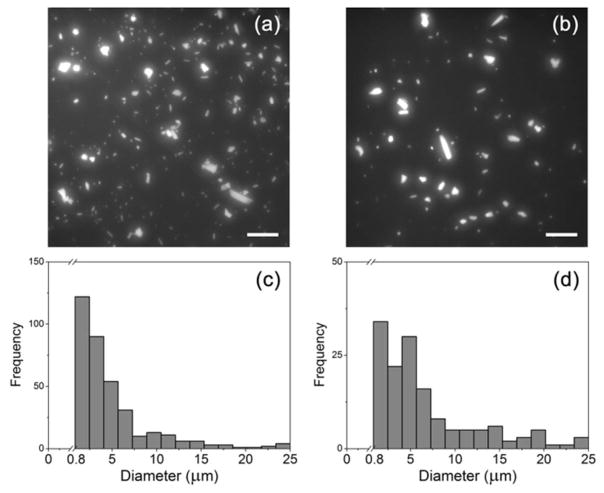
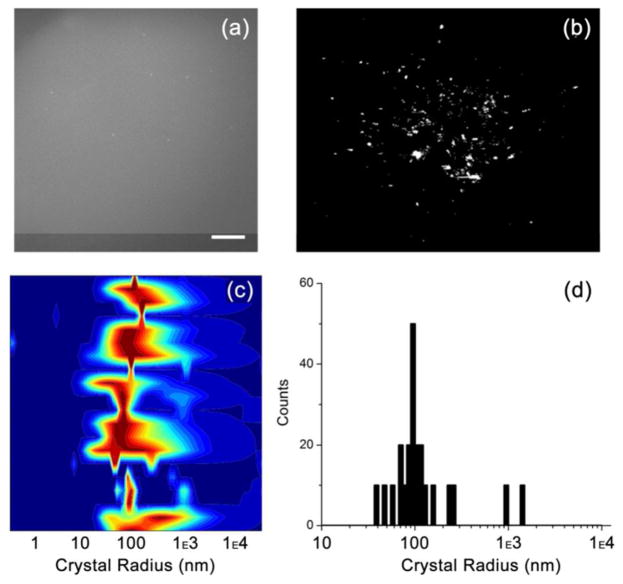
Structure elucidation of large membrane protein complexes is still a considerable challenge, yet is a key factor in drug development and disease combat. Femtosecond nanocrystallography is an emerging technique with which structural information of membrane proteins is obtained without the need to grow large crystals, thus overcoming the experimental riddle faced in traditional crystallography methods. Here, we demonstrate for the first time a microfluidic device capable of sorting membrane protein crystals based on size using dielectrophoresis. We demonstrate the excellent sorting power of this new approach with numerical simulations of selected submicrometer beads in excellent agreement with experimental observations. Crystals from batch crystallization broths of the huge membrane protein complex photosystem I were sorted without further treatment, resulting in a high degree of monodispersity and crystallinity in the ~100 nm size range. Microfluidic integration, continuous sorting, and nanometer-sized crystal fractions make this method ideal for direct coupling to femtosecond nanocrystallography.
Figures
Similar articles
-
Crystallization of the large membrane protein complex photosystem I in a microfluidic channel.ACS Nano. 2013 Dec 23;7(12):10534-43. doi: 10.1021/nn402515q. Epub 2013 Nov 14. ACS Nano. 2013. PMID: 24191698 Free PMC article.
-
Toward structure determination using membrane-protein nanocrystals and microcrystals.Methods. 2011 Dec;55(4):387-404. doi: 10.1016/j.ymeth.2011.12.006. Epub 2011 Dec 22. Methods. 2011. PMID: 22197730 Free PMC article. Review.
-
SIZE BASED NANOPARTICLE SEPARATION USING DIELECTROPHORETIC FOCUSING FOR FEMTOSECOND NANOCRYSTALLOGRAPHY OF MEMBRANE PROTEINS.Micro Total Anal Syst. 2012 Oct;2012:458-460. Micro Total Anal Syst. 2012. PMID: 25484634 Free PMC article.
-
High throughput protein nanocrystal fractionation in a microfluidic sorter.Anal Chem. 2015 Apr 21;87(8):4159-67. doi: 10.1021/acs.analchem.5b00589. Epub 2015 Apr 7. Anal Chem. 2015. PMID: 25794348 Free PMC article.
-
Femtosecond nanocrystallography using X-ray lasers for membrane protein structure determination.Curr Opin Struct Biol. 2011 Aug;21(4):509-16. doi: 10.1016/j.sbi.2011.06.001. Curr Opin Struct Biol. 2011. PMID: 21752635 Free PMC article. Review.
Cited by
-
Microfluidic Isolation and Enrichment of Nanoparticles.ACS Nano. 2020 Dec 22;14(12):16220-16240. doi: 10.1021/acsnano.0c06336. Epub 2020 Nov 30. ACS Nano. 2020. PMID: 33252215 Free PMC article. Review.
-
Dielectrophoresis for Biomedical Sciences Applications: A Review.Sensors (Basel). 2017 Feb 24;17(3):449. doi: 10.3390/s17030449. Sensors (Basel). 2017. PMID: 28245552 Free PMC article. Review.
-
Three-Dimensional Reservoir-Based Dielectrophoresis (rDEP) for Enhanced Particle Enrichment.Micromachines (Basel). 2018 Mar 10;9(3):123. doi: 10.3390/mi9030123. Micromachines (Basel). 2018. PMID: 30424057 Free PMC article.
-
Electrokinetic characterization of synthetic protein nanoparticles.Beilstein J Nanotechnol. 2020 Oct 13;11:1556-1567. doi: 10.3762/bjnano.11.138. eCollection 2020. Beilstein J Nanotechnol. 2020. PMID: 33134000 Free PMC article.
-
Development of the resolution theory for gradient insulator-based dielectrophoresis.Electrophoresis. 2015 May;36(9-10):1098-106. doi: 10.1002/elps.201400504. Epub 2015 May 5. Electrophoresis. 2015. PMID: 25781578 Free PMC article.
References
-
- Schubert WD, Klukas O, Krauss N, Saenger W, Fromme P, Witt HT. Photosystem I of Synechococcus Elongatus at 4 a Resolution: Comprehensive Structure Analysis. J Mol Biol. 1997;272:741–769. - PubMed
-
- Jordan P, Fromme P, Witt HT, Klukas O, Saenger W, Krauss N. Three-Dimensional Structure of Cyanobacterial Photosystem I at 2. 5 a Resolution. Nature. 2001;411:909–917. - PubMed
Publication types
MeSH terms
Substances
Grants and funding
LinkOut - more resources
Full Text Sources
Other Literature Sources
