. 2014 Feb 1;31(3):268-83.
doi: 10.1089/neu.2013.3108. Epub 2013 Dec 11.

The cancer drug tamoxifen: a potential therapeutic treatment for spinal cord injury

Affiliations

The cancer drug tamoxifen: a potential therapeutic treatment for spinal cord injury

Jutatip Guptarak et al. J Neurotrauma. .

Abstract

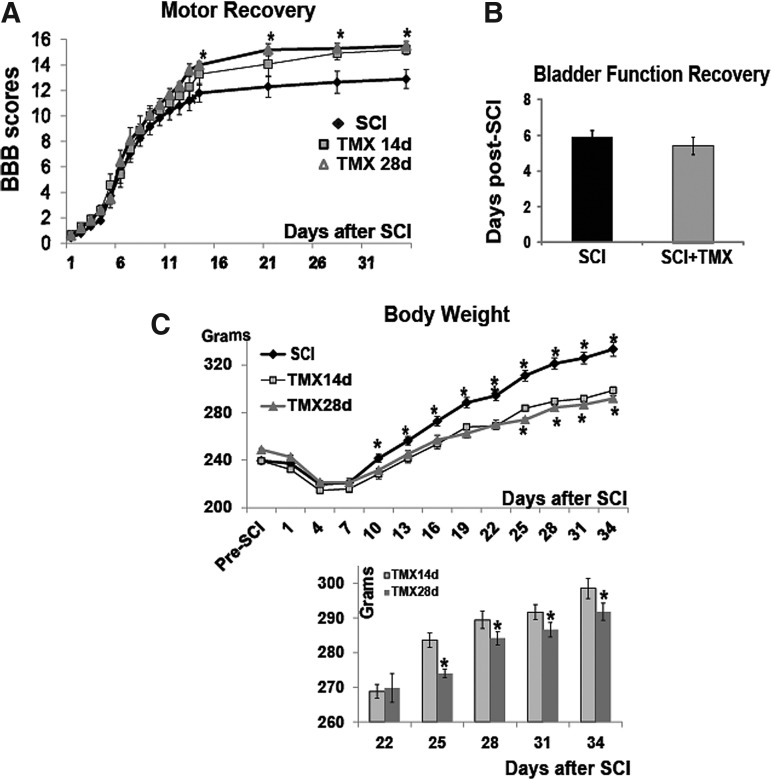
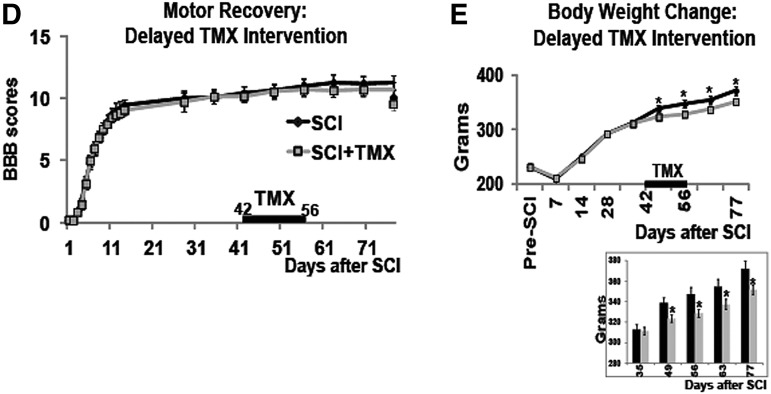
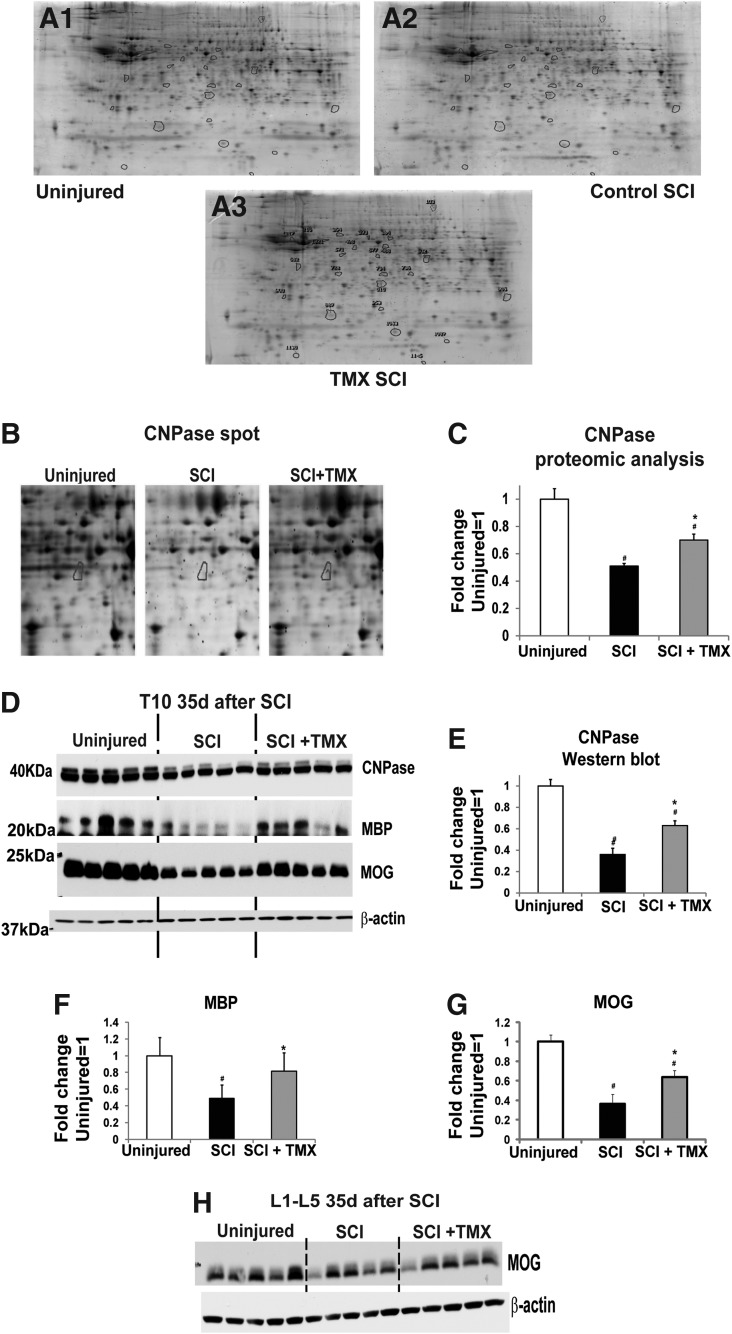
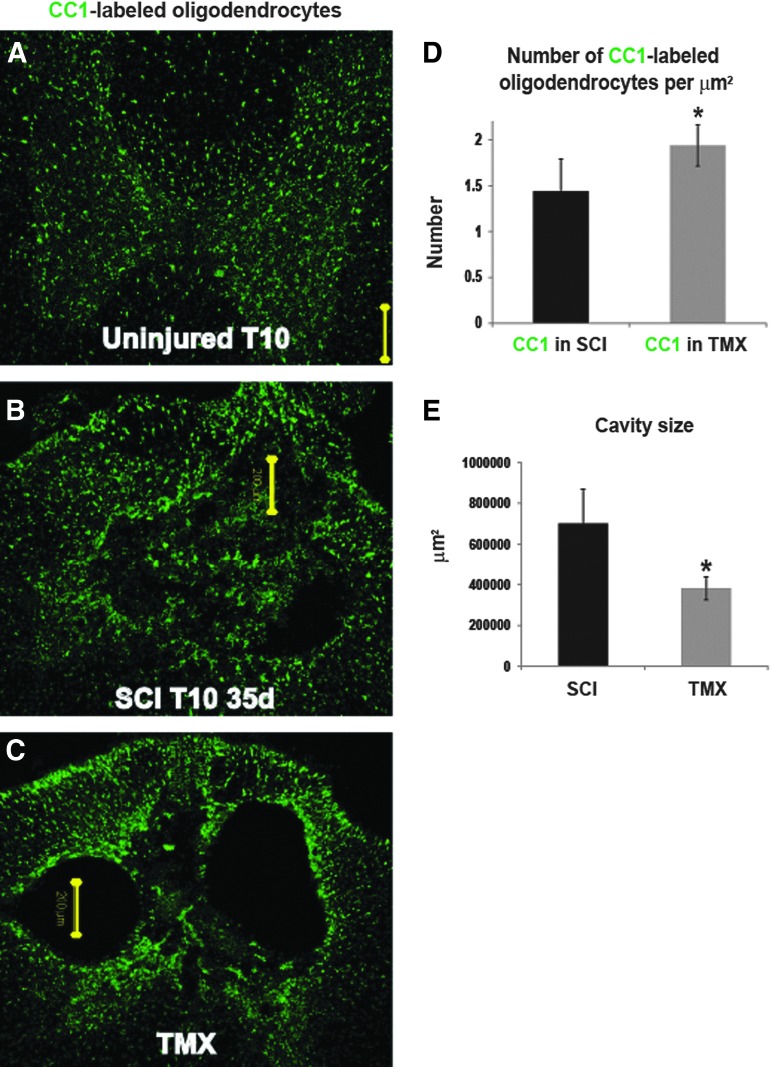
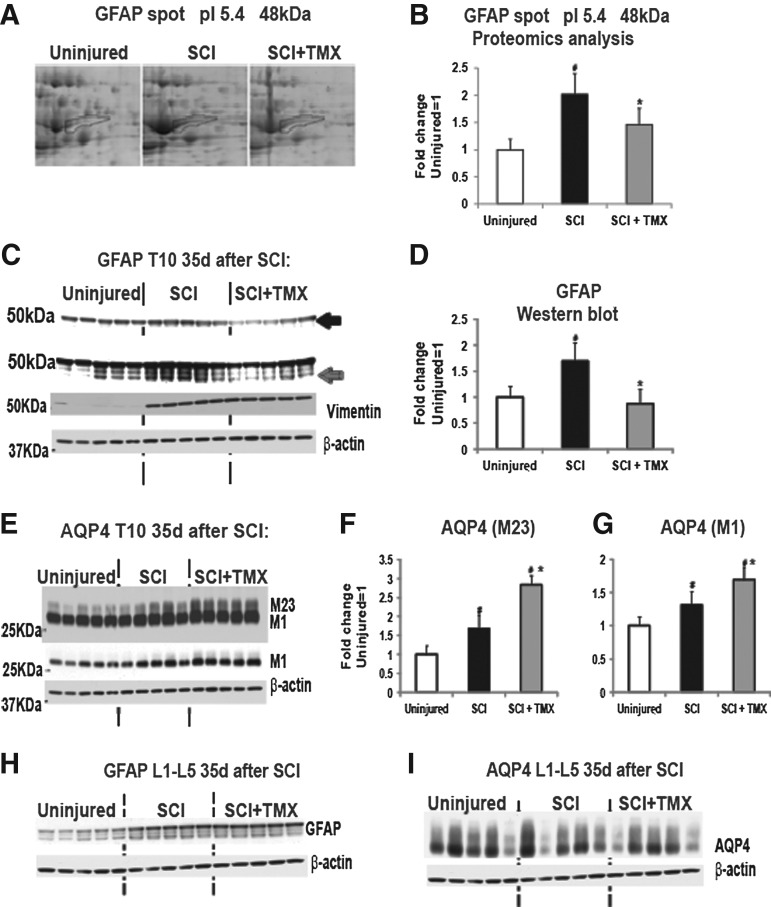
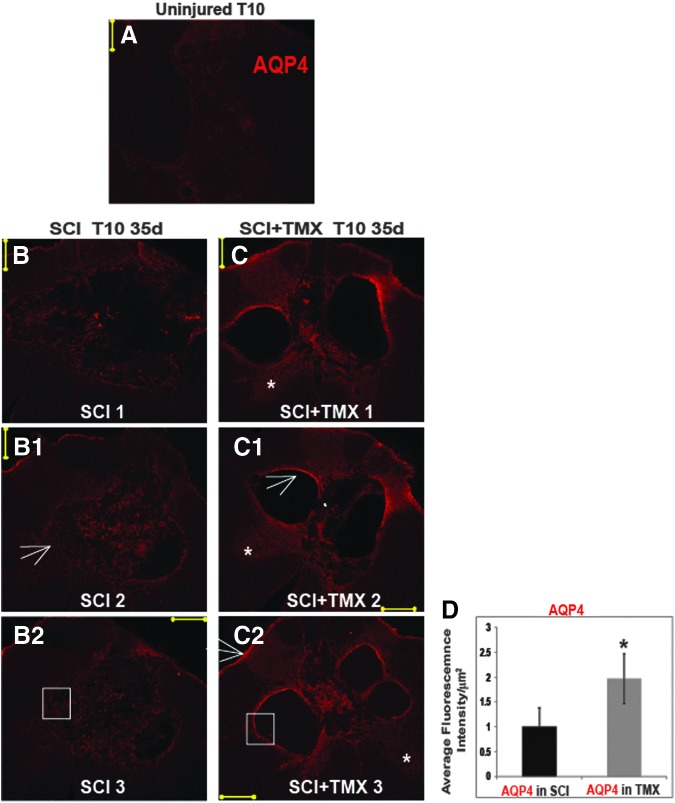
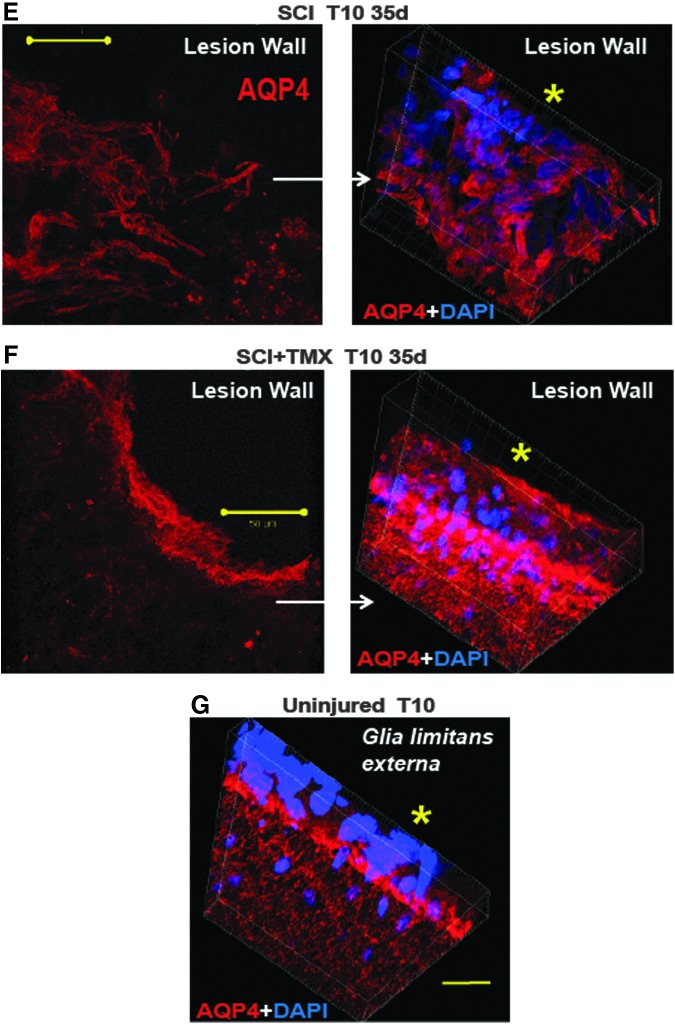
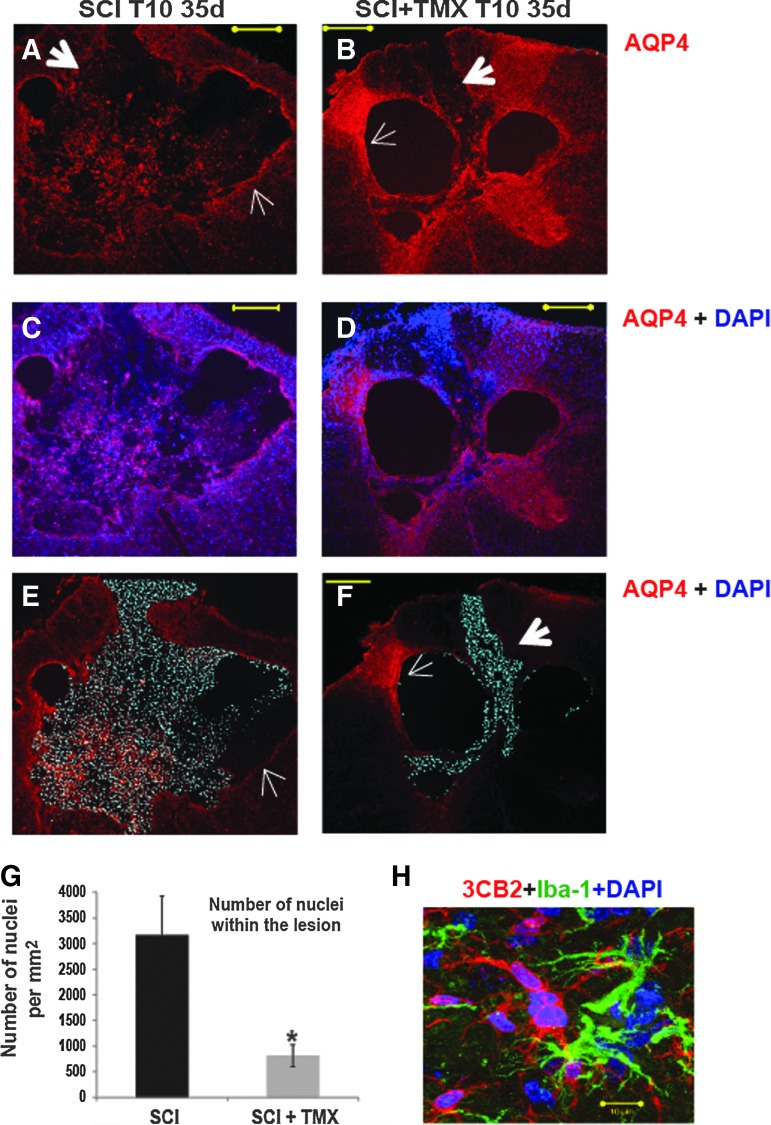
Tamoxifen (TMX) is a selective estrogen receptor modulator that can mimic the neuroprotective effects of estrogen but lacks its systemic adverse effects. We found that TMX (1 mg/day) significantly improved the motor recovery of partially paralyzed hind limbs of male adult rats with thoracic spinal cord injury (SCI), thus indicating a translational potential for this cancer medication given its clinical safety and applicability and the lack of currently available treatments for SCI. To shed light on the mechanisms underlying the beneficial effects of TMX for SCI, we used proteomic analyses, Western blots and histological assays, which showed that TMX treatment spared mature oligodendrocytes/increased myelin levels and altered reactive astrocytes, including the upregulation of the water channels aquaporin 4 (AQP4), a novel finding. AQP4 increases in TMX-treated SCI rats were associated with smaller fluid-filled cavities with borders consisting of densely packed AQP4-expressing astrocytes that closely resemble the organization of normal glia limitans externa (in contrast to large cavities in control SCI rats that lacked glia limitans-like borders and contained reactive glial cells). Based on our findings, we propose that TMX is a promising candidate for the therapeutic treatment of SCI and a possible intervention for other neuropathological conditions associated with demyelination and AQP4 dysfunction.


Figures

<b>FIG. 1.</b>
FIG. 1.
Tamoxifen (TMX) improves locomotor recovery. (A) The effect of TMX (1mg/day/rat) on locomotor recovery of the hind limbs of moderately injured rats using Basso, Beattie, and Bresnahan (BBB) scoring (Y axis) over time (1 to 35 days after spinal cord injury [SCI]. 21 is the BBB score of uninjured rats). TMX was delivered for either 14 days (gray squares) or 28 days (gray circles). Black circles represent motor recovery of control SCI rats. Graph presents mean±standard deviation (SD); *=p<0.05. (B) Bladder function recovery. Y-axis=days post-SCI. (C) Changes in body weight of SCI rats (grams) over time post-SCI. Bar graph represents the same data as in the graph above, but the Y-axis range is from 260 to 300 grams, so the changes between two TMX treatment paradigms (14 days and 28 days) are more apparent. Both graphs present mean±SD; *=p<0.05. (D) Locomotor recovery of hind limbs of SCI rats treated with TMX (1mg/day/rat) starting at 52 days after SCI. Graph presents mean±SD. (E) Body weight changes (grams) over time before (0–42 days post-SCI) and after TMX intervention (42–56 days). mean±SD. *=p<0.05. Bar graph presents the same data, but with a re-scaled Y-axis.
<b>Fig. 2.</b>
Fig. 2.
Tamoxifen (TMX) restores myelin loss at the lesion site. (A) Representative images of 2D gels from three experimental groups: uninjured, (A1); control spinal cord injury (SCI; A2) and TMX-treated SCI rats (A3); we used total cell extracts from the 10th thoracic segment (T10), 35 days after SCI. Spots in A3 are labeled with numbers corresponding to the “Spot No.” in Table 2. (B) Enlarged area of three representative 2D gels containing spot No. 498 (i.e., 2′,3′-cyclic-nucleotide 3′-phosphodiesterase [CNP-ase]; marked with blue circles). (C) Bar graph showing quantitative analysis of abundance values for spot No. 498 (CNP-ase) in proteomic analysis in three experimental groups (n=5 rats/group). All values were normalized to the mean value obtained in uninjured samples (=1). Mean±standard deviation (SD); #denotes a significant difference between uninjured and SCI groups; *a significant difference between SCI and SCI+TMX groups; #,*=p<0.05. (D) Western blot analysis of different myelin proteins (CNP-ase, myelin basic protein [MBP], and myelin oligodendrocyte glycoprotein [MOG]) at T10, 35 days after SCI in three experimental groups (n=5/group). β-actin was analyzed in all Western blots as a loading control, in addition to the Ponceau staining. (E) Quantitative analysis of CNP-ase Western blots. Mean±SD; #,*p<0.05. (F) Quantitative analysis of MBP Western blots. Mean±(SD); *=p<0.05. (G) Quantitative analysis of MOG Western blots. Mean±SD; #,*p<0.05. (H) MOG levels were also measured in lumbar segments 35 days after SCI using Western blots (n=5/group). No changes in MOG levels were detected among the three experimental groups.
<b>FIG. 3.</b>
FIG. 3.
Tamoxifen (TMX) spares oligodendrocytes and reduces cavitation. Representative confocal images of the CC1-immunolabeling at the 10th thoracic segment (T10), 35 days after spinal cord injury (SCI), in three experimental groups, an age-matched uninjured rat, (A), control SCI, (B) and TMX-treated SCI group (C). Calibration line: 200 μm. Calibration line was positioned within the cavity to indicate its size. (D) Quantitative analysis of the number of CC1-labeled cells per μm2 in control and TMX-treated groups. Five random sections of T10 sections from each group were chosen for the analysis; n=5 rats/experimental group. Mean±standard deviation; *p<0.05. (E) Cavity sizes were determined as described in the Methods section (also see supplementary material). Color image is available online at www.liebertpub.com/neu
<b>FIG. 4.</b>
FIG. 4.
Tamoxifen (TMX) affects reactive astrocytes. (A) Enlarged area of representative 2D gels containing spot No. 1321 (48kDa GFAP, marked in blue) from three experimental groups: uninjured, control spinal cord injury (SCI), and TMX-treated SCI. (B) Bar graph represents quantitative analysis of abundance values for Spot No. 1321 (48kDa GFAP, pI 5.4: n=5 rats/group). All values were normalized to the mean value for uninjured samples (=1). Mean±standard deviation (SD); #,*=p<0.05. (C) Western blot analysis of glial fibrillary acidic protein (GFAP) and vimentin levels at the tenth thoracic segment (T10), 35 days after SCI. GFAP bands marked with a black arrow represent lower exposure time to demonstrate changes in ∼50 kDa GFAP band, while multiple bands visible with longer exposures (marked with gray arrow) represent changes in GFAP bands/isoforms whose MW were below 50kDa. (D) Quantitative analysis of all GFAP bands obtained in Western blots. Mean±SD; #,*=p<0.05. (E) Western blot analysis of aquaporin 4 (AQP4) at T10, 35 days after SCI in three experimental groups; n=5 /group. The upper image represents a longer exposure that shows changes in the higher MW band (M23 isoform), while the lower Western blot image shows the same Western blot, but with a lower exposure time, so changes in the M1 isoform are clearly visible. (F) Quantitative analysis of the M23 AQP4 isoform measured using Western blots. Mean±SD; #,*=p<0.05. (G) Quantitative analysis of the M1 AQP4 isoform. Mean±SD; #,*p<0.05. (H) GFAP levels were also measured (using Western blots) in lumbar segments 35d after SCI (n=5/group). (I) Western blot analysis of AQP4 levels in lumbar segments 35 days after SCI.
<b>FIG. 5.</b>
FIG. 5.
Aquaporin 4 (AQP4) and the organization of the lesion wall. (A) AQP4 immunolabeling in the uninjured 10th thoracic segment (T10) segment of an age-matched uninjured rat. Calibration line: 200 μm. (B-B2) Representative confocal image of AQP4 immunolabeling in a control spinal cord injury (SCI) rat (T10, 35 days after SCI), three sections were taken 40 μm apart. (C-C2) Representative 3 sections from the lesion site of a tamoxifen (TMX)-treated SCI rat. White stars mark better preservation of gray matter in TMX-treated SCI rats, even when the size of the cavities did not significantly differ from a control SCI rat. White arrows: the lesion wall in a TMX-treated SCI rat demonstrated high AQP4 levels, in contrast to the lesion border of a control SCI rat. The organization of the lesion wall and the intensity of AQP4 immunolableing within the lesion border were similar to the organization and AQP4 immunolableing in glia limitans in a TMX-treated SCI rat (thin white arrow in C2). (D) Fluorescence Intensity quantitative analysis of AQP4 labeling shows two-fold increases in TMX-treated SCI rats. Five random sections were chosen from each lesion site (n=5/group). The intensity was normalized to SCI=1. Mean±SD; *=p<0.05. (E) High magnification image of AQP4 labeling in a segment of the lesion wall in a control SCI rat (area of the lesion wall is marked with white square in B2). Calibration line: 50 μm. The image of AQP4 labeling on the right represents a 3D rendering (done by z-stacks acquisition of confocal images) of a lesion wall segment facing the cavity (cavity is marked with the yellow star) and demonstrates disorganized AQP4-expressing astrocytes; nuclei were labeled in blue with 4′,6-diamidino-2-phenylindole, dihydrochloride. (F) The astrocytic organization of the lesion walls in a TMX-treated SCI rat resembled the astrocytic organization in glia limitans of an uninjured rat (G); yellow star marks the side facing the subarachnoid CSF). Calibration line: 20 μm. Color image is available online at www.liebertpub.com/neu
<b>FIG. 6.</b>
FIG. 6.
Spreading of cells within the lesion. (A) A representative image of aquaporin 4 (AQP4) immunolabeling at the lesion site in an spinal cord injury (SCI) rat. Thick white arrow: segments of disorganized lesion border with low intensity AQP4 labeling. Thin white arrow: more organized lesion border were associated with higher AQP4 levels. Calibration line: 200 μm. (B) AQP4 labeling at the lesion site in a tamoxifen (TMX)-treated SCI rat. (C) AQP4 (red, image A) co-labeled with nuclei (blue, 4′,6-diamidino-2-phenylindole, dihydrochloride [DAPI]). (D) Co-labeling of AQP4 (red) and nuclei (blue, DAPI). (E) DAPI channel (pseudo-colored in cyan) showing only the nuclei (cells) within the lesion in a SCI rat (the same section as presented in A and C). We found widespread cell infiltration within the lesion of all control SCI rats. The only regions of the cavity devoid of cells were associated with organized lesion borders and high AQP4 levels (marked with thin arrows). (F) DAPI channel (pseudo-colored in cyan) in a TMX-treated SCI rat. Thick white arrow: cell infiltration was also found within cavities of TMX-treated SCI rats, but only in limited regions where cavity walls were disorganized and expressed lower AQP4 levels. Thin white arrow: more organized lesion border were associated with higher AQP4 levels and lack of cell infiltration. (G) Quantitative analysis of the DAPI-labeled nuclei within the cavity (Y-axis: number of nuclei per μm2) showed two-fold fewer nuclei in TMX-treated SCI rats (five random 10th thoracic segment sections /rat; n=five rats/group). Mean±SD; *=p<0.05. (H) The cells within cavities included immature, radial glia-like astrocytes labeled with 3CB2, and reactive microglia labeled with Iba-1. Calibration line: 10 μm. Color image is available online at www.liebertpub.com/neu

Similar articles

Cited by

References

    1. Amtul Z., Wang L., Westaway D., and Rozmahel R. F. (2010). Neuroprotective mechanism conferred by 17beta-estradiol on the biochemical basis of Alzheimer's disease. Neuroscience 169, 781–786 - PubMed
    1. Bourque M., Dluzen D. E., and Di Paolo T. (2009). Neuroprotective actions of sex steroids in Parkinson's disease. Front Neuroendocrinol. 30, 142–157 - PubMed
    1. Garcia-Segura L. M. and Melcangi R. C. (2006). Steroids and glial cell function. Glia 54, 485–498 - PubMed
    1. Lebesgue D., Chevaleyre V., Zukin R. S., and Etgen A. M. (2009). Estradiol rescues neurons from global ischemia-induced cell death: multiple cellular pathways of neuroprotection. Steroids 74, 555–561 - PMC - PubMed
    1. Samantaray S., Sribnick E. A., Das A., Thakore N. P., Matzelle D., Yu S. P., Ray S. K., Wei L., and Banik N. L. (2010). Neuroprotective efficacy of estrogen in experimental spinal cord injury in rats. Ann. N. Y. Acad. Sci. 1199, 90–94 - PMC - PubMed

Publication types

LinkOut - more resources