Review
. 2013 Sep 4;3(9):130088.
doi: 10.1098/rsob.130088.

The control of branching morphogenesis

Affiliations
Review

The control of branching morphogenesis

Dagmar Iber et al. Open Biol. .

Abstract

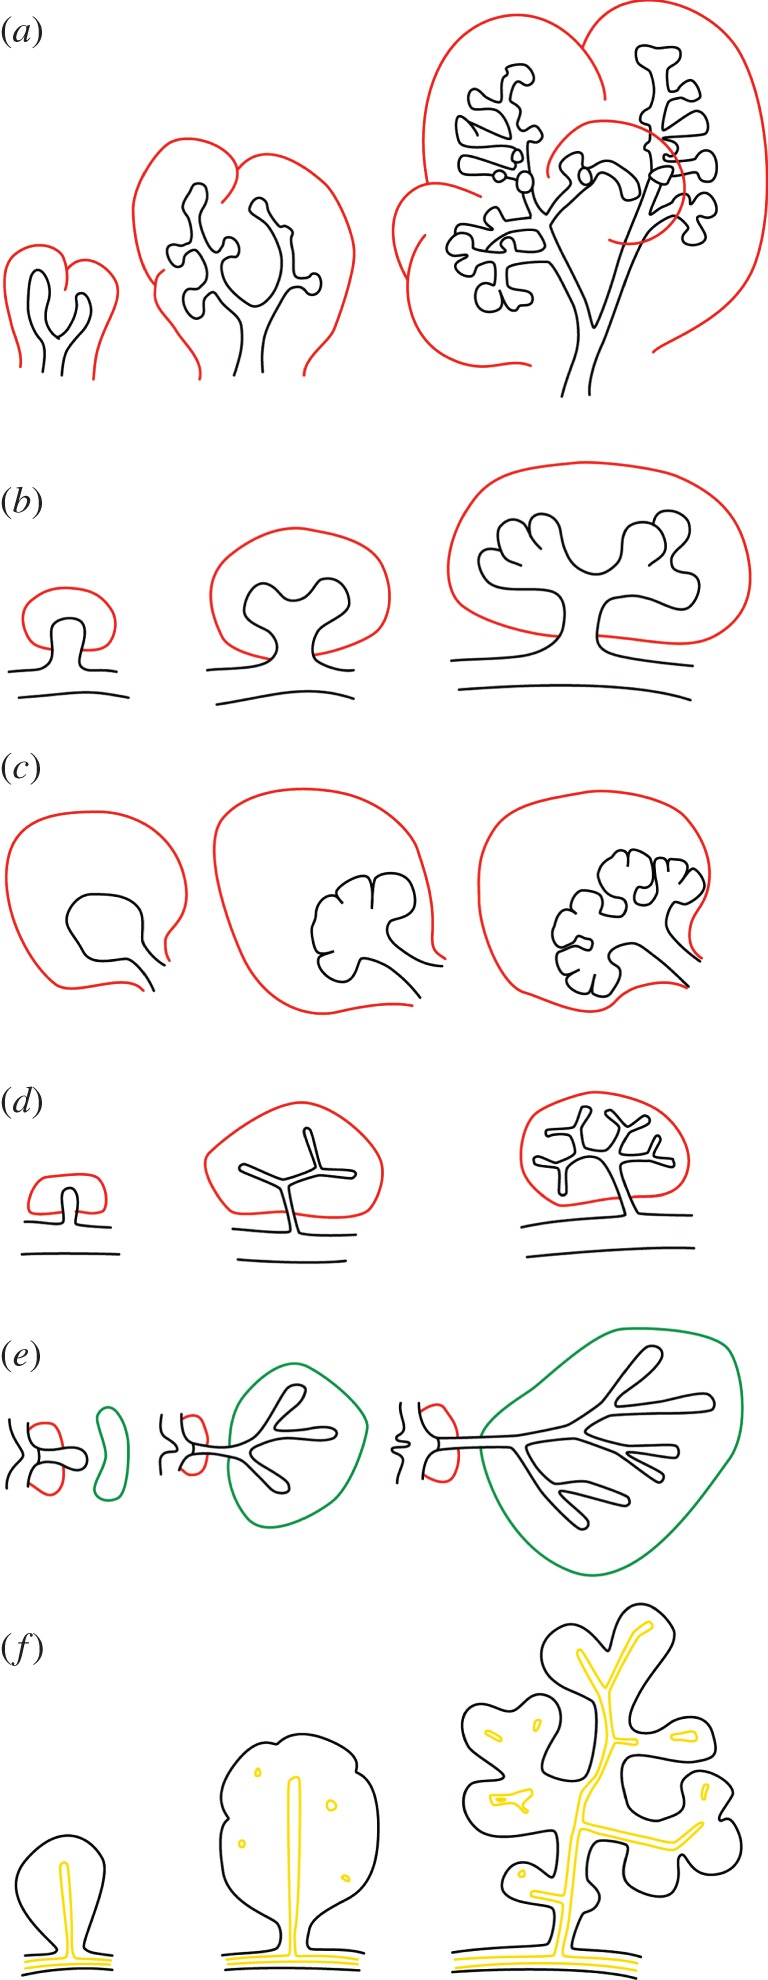
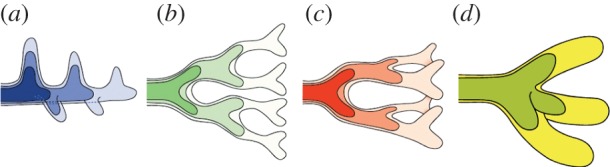
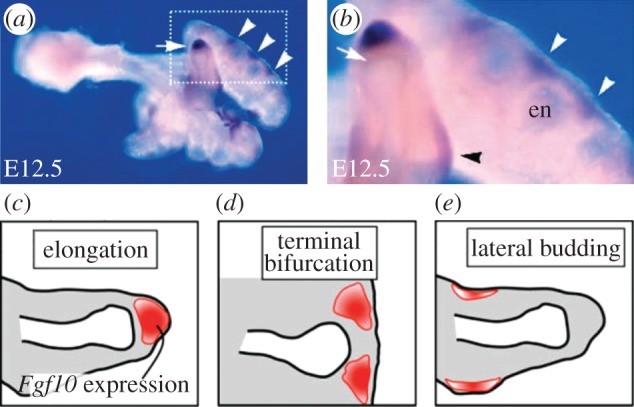
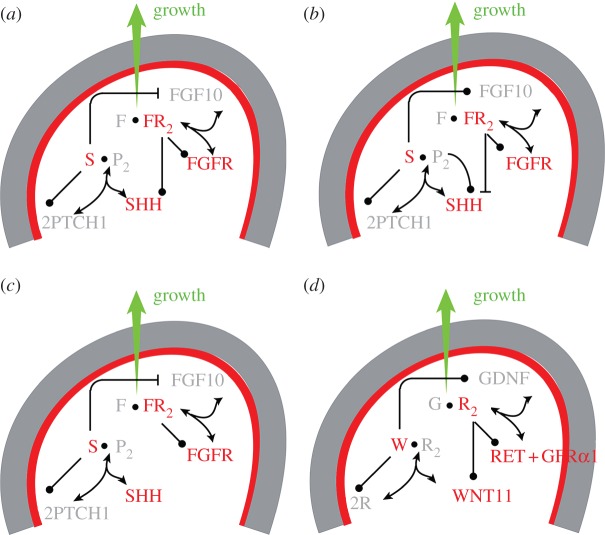
Many organs of higher organisms are heavily branched structures and arise by an apparently similar process of branching morphogenesis. Yet the regulatory components and local interactions that have been identified differ greatly in these organs. It is an open question whether the regulatory processes work according to a common principle and how far physical and geometrical constraints determine the branching process. Here, we review the known regulatory factors and physical constraints in lung, kidney, pancreas, prostate, mammary gland and salivary gland branching morphogenesis, and describe the models that have been formulated to analyse their impacts.

Keywords: branching; computational modelling; in silico organogenesis.


Figures

Figure 1.
Figure 1.
Branching morphogenesis. Typical branching pattern over developmental time in the (a) lung, (b) ureteric bud, (c) salivary gland, (d) prostate, (e) mammary gland and (f) pancreas. The epithelium is shown in black, the mesenchyme in red, the fat pad in the mammary gland in green and the lumen in the pancreas in yellow.
Figure 2.
Figure 2.
Modes of branching: (a) lateral branching, (b) planar bifurcation, (c) orthogonal bifurcation and (d) trifurcation. (ac) Reproduced from [1].
Figure 3.
Figure 3.
FGF10 in the developing lung. (a,b) Fgf10 expression at embryonic day (E) 12.5. High expression levels of Fgf10 are observed in the distal mesenchyme of the tip (white arrow), as well as on the sides of the tips of a bud (white arrowheads). (b) High magnification of the white dotted box in (a). Note that Fgf10 expression is absent in the mesenchyme adjacent to the endoderm (en) of the tip. Localized Fgf10 expression is also observed in the mesenchyme around the stalk (black arrowhead). (c–e) Schematic of the spatial distributions of Fgf10 expression in (a,b). Fgf10 is expressed in the red region. The white area indicates the lumen, the grey area the mesenchyme, the black line in between the epithelium. The outer black lines mark the mesothelium. The three types of spatial distributions of Fgf10 expression generate different branching modes: (c) elongation, (d) terminal bifurcation and (e) lateral budding. The entire figure is adapted from Hirashimi & Iwasa [11]; (a,b) adapted from the original publication of Bellusci et al. [12].
Figure 4.
Figure 4.
Signalling networks in branching morphogenesis. The core signalling networks that have been described to regulate branching morphogenesis in (a) lung and prostate, (b) salivary gland, (c) pancreas and (d) kidney are shown. In the lung, prostate, salivary gland and pancreas FGF10 (F) signalling directs outgrowth of the epithelium. Fgf10 is expressed in the mesenchyme (grey) and binds to its receptor (R) in the epithelium (red). FGF10-bound receptor not only directs outgrowth, but also regulates expression of Shh (S) ((a) upregulation in the lung and prostate, (b) downregulation in the salivary gland, (c) no reported regulation in the pancreas). SHH binds its receptor PTCH1 (P) and the SHH-receptor complex, in turn, regulates Fgf10 expression ((a,c) downregulation in the lung, prostate and pancreas, (b) upregulation in the salivary gland). All ligand–receptor signalling also upregulates the expression of the receptor. (d) In the case of the ureteric bud, GDNF (G) induces bud outgrowth and GDNF-receptor binding stimulates expression of the receptor Ret and of Wnt11 (W) in the epithelium. WNT11, in turn, causes upregulation of Gdnf expression in the mesenchyme.
Figure 5.
Figure 5.
Patterning and symmetry break. A cylinder with a homogeneous morphogen concentration exhibits cylindrical symmetry. Patterning mechanisms may introduce stripes or spots. The spotty cylinder exhibits rotational symmetry, and such pattern would support the outgrowth of defined branches.
Figure 6.
Figure 6.
A three-dimensional fractal model of an airway tree with 54 611 branches; branches distal to different segmental bronchi are shown in same colour as segmental bronchus. (a) Anterior view and (b) right lateral view. The figure and legend were adapted from Kitaoka et al. [24].
Figure 7.
Figure 7.
A fractal-like organization of the lung. A logarithmic plot of the airway branch diameter against the branching generation reveals two exponential laws with different scaling factor for conducting and respiratory airways. For the conducting part, the relation d(z) = d(0) × 2z/3 was observed for the diameters d in generation z. For such shrinkage factor in the diameter, the total volume of all branches remains constant for dichotomous branching and the entropy generation during breathing is minimal [27]. The plot is adapted from Bleuer [28].
Figure 8.
Figure 8.
Branching as a result of mechanical differences. (a) Branching driven by a viscosity difference between the fluid in the lumen and the mesenchyme; adapted from Lubkin & Murray [33]. (b) Viscous fingering is observed in a system with two immiscible fluids of differing viscosities; adapted from Jha et al. [34]. (c,d) The impact of internal pressure on branching; adapted from Unbekandt et al. [35].
Figure 9.
Figure 9.
Patterning models based on the local variations in the distance of the epithelium from the source of FGF10. (a) Branching as a result of diffusion-limited growth. Tissue (delimited by white line) that is placed into a solution with a low concentration of an outgrowth-inducing signalling factor (such as FGF10 in the lung) will degrade the signalling factor and thus induce a concentration gradient (red, high; blue, low). As a result of small irregularities in the tissue shape (white line), some part of the tissue will be closer to the higher concentration and accordingly start to grow out faster, thus experiencing even higher (relative) concentrations; adapted from Hartmann & Miura [48]. (b) With FGF10 produced mainly in the submesothelial mesenchyme and its receptor produced only in the epithelium, an FGF10 gradient can be expected to emerge. If the FGF10 concentration is homogeneous close to the mesothelium and on the epithelium, then the gradient would be steeper, the shorter the distance between epithelium and mesothelium. If cells read out gradients rather than concentration, then small differences in the distance could trigger self-avoiding outgrowth of branches; adapted from Clément et al. [49]. (c–e) Distance-based mechanism based on SHH and FGF10. SHH is produced only by the epithelium, and represses Fgf10 expression at high concentrations. Accordingly, Fgf10 expression can be expected to be lower, the closer are epithelium and mesothelium [12]. (c) Assuming that SHH induces Fgf10 expression at low concentrations, the FGF10 concentration is high as long as the bud is sufficiently far away from the boundary, thus supporting bud elongation. (d) As the bud approaches the impermeable boundary, the FGF10 profile splits, thus supporting bifurcating outgrowth. (e) The bifurcation in (d) requires an impermeable boundary and is not observed on an open domain. The FGF10 distribution in (ce) was calculated according to the model presented by Hirashima & Iwasa [11]. (ce) Adapted from Menshykau et al. [50].
Figure 10.
Figure 10.
Branching as a result of a diffusion-based geometry effect. (a) A cartoon of the proposed geometry-based branching mechanism. As a result of stronger diffusion-based loss at the edges, the concentration of the signal is highest in the centre of the domain (red line), and drives the outgrowth of a bud. As the bud elongates, more signal is lost at the tip than at the sides, because of the higher curvature, and a bifurcating concentration profile of the signalling factor emerges. Computational studies confirm that the geometry effect results in bifurcating concentration profiles, but reveals that it does not support bifurcating outgrowth (D. Menshykau & D. Iber 2013, unpublished data). (b) The simulated concentration profile of a ligand that is uniformly secreted from the epithelium of extracted three-dimensional chicken lung bud (Hamburger–Hamilton (HH) stage 27+) into a large computational bounding box [58]. The concentration profiles were normalized to the highest value (red, highest relative concentration; blue, lowest). (c) (i) A three-dimensional solid model representation of the region of highest ligand concentration represented by the red shading. (ii) The morphogen concentration in a cross-section through a bud. The bud stalk and branch point have a local maximum (solid white triangles), whereas the bud tip has a local minimum (empty black triangles) in the predicted ligand concentration [58].
Figure 11.
Figure 11.
A receptor–ligand-based Turing model for lung branching morphogenesis. (a,b) The regulatory network shown in figure 3f gives rise to a Turing pattern and results in distributions of FGF10 (colour code: red, highest; black, lowest) and SHH (black and white contour line plot) on bud-shaped domains as characteristic for (a) bifurcation or (b) lateral branching events. (c) The FGF10 concentration profile along the lung bud. (d) An extended network that includes also FGF9 also reproduces the observed patterns of smooth muscle (SM) formation from progenitors (PR) and Vegfa expression during lung branching morphogenesis. (e) Smooth muscles (colour code) emerge in the clefts between lung buds (contour lines mark FGF10 concentration levels) as the lung bud grows out. (f) Vegfa expression, an inducer of blood vessel formation, emerges in the distal subepithelial mesenchyme. (a–c) Adapted from Menshykau et al. [50]; (d–f) adapted from Celliere et al. [60].
Figure 12.
Figure 12.
Receptor–ligand-based Turing model for kidney branching morphogenesis. The reported regulatory interactions shown in figure 4d can result in self-emerging patterns of the GDNF-bound RET complex in the epithelium (grey scale: white, highest; black, lowest), and Gdnf expression in the mesenchyme (colour scale: red, highest; blue, lowest), when solved on a three-dimensional idealized bud-shaped domain. The different patterns can, in principle, (a) support elongation, or support the formation of (b) bifurcations, (c) trifurcations or (d) lateral branching. (ad) Adapted from Menshykau & Iber [72].
Figure 13.
Figure 13.
Branching of the ureteric bud into the metanephric mesenchyme. (a) The computational domain for the simulation of an ureteric bud after it has started to branch from the Wolffian duct into the metanephric mesenchyme. The double arrows illustrate the stalk length and the mesenchyme thickness. (b) The branching of the ureteric bud into the metanephric mesenchyme in response to GDNF signalling. Here, the bud grows out normal to its surface and at a speed proportional to the local concentration of the GDNF-receptor complex, as described by Iber et al. [73]. (c) The dependency of the length of the stalk to the first branching point on the thickness of the mesenchyme (both as defined in (a)). (d) The branching of the ureteric bud into the metanephric mesenchyme in a Sprouty–/– mutant. The concentration of the GDNF-bound RET complex in the epithelium is indicated as a grey scale (white, highest; black, lowest); the strength of Gdnf expression in the mesenchyme is represented by a colour scale (red, highest; blue, lowest). (ad) Adapted from Menshykau & Iber [72].
Figure 14.
Figure 14.
Cooperative receptor–ligand interactions can give rise to Turing patterns. The depicted receptor–ligand interaction can result in spatial patterns via Schnakenberg-type reaction kinetics. Here, m receptors (R) and n ligand molecules (L) (with m + n > 2) need to bind to form the complex RmLn. The receptor–ligand complex then upregulates the receptor concentration (by increasing its expression, limiting its turn-over or similar). To obtain Turing patterns, ligands must diffuse much faster than their receptors. As is characteristic for Schnakenberg-type Turing pattern, the highest receptor and ligand concentrations are then observed in different places.

References

    1. Affolter M, Zeller R, Caussinus E. 2009. Tissue remodelling through branching morphogenesis. Nat. Rev. Mol. Cell Biol. 10, 831–842 - PubMed
    1. Metzger RJ, Klein OD, Martin GR, Krasnow MA. 2008. The branching programme of mouse lung development. Nature 453, 745–750 (doi:10.1038/nature07005) - DOI - PMC - PubMed
    1. Blanc P, Coste K, Pouchin P, Azas J-M, Blanchon L, Gallot D, Sapin V. 2012. A role for mesenchyme dynamics in mouse lung branching morphogenesis. PLoS ONE 7, e41643 (doi:10.1371/journal.pone.0041643) - DOI - PMC - PubMed
    1. Watanabe T, Costantini F. 2004. Real-time analysis of ureteric bud branching morphogenesis in vitro. Dev. Biol. 271, 98–108 (doi:10.1016/j.ydbio.2004.03.025) - DOI - PubMed
    1. Meyer TN, Schwesinger C, Bush KT, Stuart RO, Rose DW, Shah MM, Vaughn DA, Steer DL, Nigam SK. 2004. Spatiotemporal regulation of morphogenetic molecules during in vitro branching of the isolated ureteric bud: toward a model of branching through budding in the developing kidney. Dev. Biol. 275, 44–67 (doi:10.1016/j.ydbio.2004.07.022) - DOI - PubMed

Publication types

LinkOut - more resources