. 2013 Oct;140(19):3965-76.
doi: 10.1242/dev.092155. Epub 2013 Sep 4.

BMP4-directed trophoblast differentiation of human embryonic stem cells is mediated through a ΔNp63+ cytotrophoblast stem cell state

Affiliations

BMP4-directed trophoblast differentiation of human embryonic stem cells is mediated through a ΔNp63+ cytotrophoblast stem cell state

Yingchun Li et al. Development. 2013 Oct.

Abstract

The placenta is a transient organ that is necessary for proper fetal development. Its main functional component is the trophoblast, which is derived from extra-embryonic ectoderm. Little is known about early trophoblast differentiation in the human embryo, owing to lack of a proper in vitro model system. Human embryonic stem cells (hESCs) differentiate into functional trophoblast following BMP4 treatment in the presence of feeder-conditioned media; however, this model has not been widely accepted, in part owing to a lack of proof for a trophoblast progenitor population. We have previously shown that p63, a member of the p53 family of nuclear proteins, is expressed in proliferative cytotrophoblast (CTB), precursors to terminally differentiated syncytiotrophoblast (STB) in chorionic villi and extravillous trophoblast (EVT) at the implantation site. Here, we show that BMP4-treated hESCs differentiate into bona fide CTB by direct comparison with primary human placental tissues and isolated CTB through gene expression profiling. We show that, in primary CTB, p63 levels are reduced as cells differentiate into STB, and that forced expression of p63 maintains cyclin B1 and inhibits STB differentiation. We also establish that, similar to in vivo events, hESC differentiation into trophoblast is characterized by a p63(+)/KRT7(+) CTB stem cell state, followed by formation of functional KLF4(+) STB and HLA-G(+) EVT. Finally, we illustrate that downregulation of p63 by shRNA inhibits differentiation of hESCs into functional trophoblast. Taken together, our results establish that BMP4-treated hESCs are an excellent model of human trophoblast differentiation, closely mimicking the in vivo progression from p63(+) CTB stem cells to terminally differentiated trophoblast subtypes.

Keywords: BMP4; Human embryonic stem cells; Placenta; Trophoblast; ΔNp63.


Figures

Fig. 1.
Fig. 1.
BMP4-treated hESCs most closely resemble placenta and primary CTB and express trophoblast-associated genes. (A) Hierarchical clustering shows that hESCs treated with FCM-BMP4 at days 4 and 6, most closely resemble placental tissues and primary CTB. Pearson correlation coefficients are shown for the FCM-BMP4-day4/day6/placental tissue/CTB cluster. (B) PCA shows that the first principal component (horizontal axis) distinctly separates differentiated hESC/placenta/CTB samples from a variety of fetal tissue samples, whereas the second principal component (vertical axis) accounts for the differences among the differentiated hESC/placenta/CTB samples. (C) Heatmap of trophoblast-specific genes during the 6-day FCM-BMP4-treatment timecourse (D0-D6) shows progressive differentiation of BMP4-treated hESCs from progenitor to terminally differentiated trophoblast phenotype. (D) qRT-PCR for indicated markers, confirming microarray data with peak days of expression indicated by asterisks. Data are expressed as fold change relative to day 0. (E) Heatmap of human trophectoderm-specific transcription factors (Bai et al., 2012): out of 16 genes, 12 are induced at one or more time points following FCM-BMP4 treatment of hESCs (top portion of the heatmap); three genes (TFEB, DLX4 and KLF5) do not show a consistent pattern of expression during differentiation (bottom portion of the heatmap) and one (MAFK) was not expressed at a detectable level in any of the samples (not shown). Some genes are listed twice on the heatmaps, as they are represented by more than one probe on the microarray.
Fig. 2.
Fig. 2.
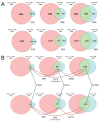
BMP4-treated hESCs show gene expression changes consistent with differentiation from pluripotency to cytotrophoblast. (A) Proportional Venn diagrams, showing overlap (green) of gene expression changes between PSCs-to-CTB (pink) and PSCs-to-FCM-BMP4-treated hESCs (blue). Comparisons including first trimester CTB (top row) and third trimester CTB (bottom row) are shown. Note the progressive increase in the percentage of overlapping genes between the two groups, reaching 64% in the first trimester CTB comparisons, and 56% in the third trimester CTB comparisons. (B) The majority of the changes in gene expression were maintained over the differentiation timecourse (red arrows), as well as between the first and third trimester primary CTBs (blue arrows).
Fig. 3.
Fig. 3.
Markers of CTB and STB in early placental tissues. (A) First trimester placental tissue, with consecutive sections stained for p63 (left) and Ki67 (right). (B) Term placental tissue: in fetal membranes (top left), p63 stains only chorionic trophoblast and not amnion. Amnion (top right) is KRT7-positive (red), but negative for p63 (brown). In term villous tissue (bottom panels), p63 (brown) highlights CTB whereas KRT7 (red) stains both CTB and STB. (C) Immunostaining of first trimester placental villi. Note that p63 highlights CTB, whereas KLF4 and hCGβ highlight STB. KRT7 more prominently stains CTB, but is also expressed in STB. (D) Archived human blastocyst sample, early after implantation, shows p63 and KRT7 in the proliferative (Ki67-positive) CTB layer, adjacent to the underlying mesenchyme, whereas inhibin and hCGβ stain the STB layer, adjacent to the maternal vascular space. Brown, immunostaining of indicated marker; blue, hematoxylin-stained nuclei.
Fig. 4.
Fig. 4.
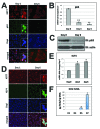
Primary CTB differentiates from a p63-positive state to KLF4+, hCGβ-secreting STB. (A) p63 and KRT7 staining of isolated third trimester CTB, 1 and 6 days after plating. (B,C) Expression of p63 by qRT-PCR (B) and western blot (C). (D) KLF4 and KRT7 staining of isolated third trimester CTB, 1 and 6 days after plating. (E,F) Expression of KLF4 by qRT-PCR (E) and hCG secretion by ELISA (F). Data are expressed as mean ± s.d. of triplicate samples at the time points shown, and are representative of experiments with eight separate CTB preparations from different placentas. *P<0.05, **P<0.01 in comparison with day 0 or day 1 values.
Fig. 5.
Fig. 5.
Overexpression of ΔNp63α in primary CTB inhibits differentiation. (A) Expression of ΔNp63α and CGB mRNA in uninfected and mock- and ΔNp63α-infected CTB by qRT-PCR at day 3 (D3) and day 5 (D5) post-infection. (B) Western blot for p63 and cyclin B1 in cells infected with lentivirus expressing either ΔNp63α or no transgene (‘mock’). (C) hCGβ secretion by uninfected and mock- and ΔNp63α-infected CTB. Data shown are from a single CTB preparation and are expressed as mean ± s.d. of triplicate samples; data are representative of experiments with five separate CTB preparations from different placentas. *P<0.05 in comparison with uninfected or mock-infected values.
Fig. 6.
Fig. 6.
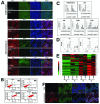
BMP4 treatment of hPSCs induces a trophoblast phenotype. (A) qRT-PCR of various markers in hESCs (H9/WA09) and an hiPSC line differentiated with FCM-BMP4 over 10 days (D1-D10). Data are representative of three independent experiments with each cell line. (B) hESCs differentiated with FCM-BMP4 transition through a p63+/KRT7+ cytotrophoblast phenotype at day 5, prior to differentiating into HLA-G+/KRT7+ and KLF4+/hCGβ+ trophoblast, characteristic of EVT and STB, respectively. (C) Fluorescent flow cytometry analysis of d0 and d5 hESC9s differentiated in FCM-BMP4. By day 5, almost 90% of cells are p63+/KRT7+ (right-hand panel). (D) At day 7, ∼25% of cells express surface HLA-G (based on FACS using MEMG9 antibody). (E) At day 3, p63+/CDX2+ cells are found among differentiating colonies. (F) FCM-BMP4-treated hESCs secrete hCGβ, including a hyperglycosylated form, which is unique to EVT. Data are normalized to DNA content and are expressed as mean ± s.d. of triplicate samples. (G) FCM-BMP4-treated cells at day 5 (D5), sorted based on EGFR expression, and subjected to qRT-PCR for the pluripotency marker OCT4, trophoblast-associated markers p63 and KRT7, and a panel of mesoderm markers. NS, non-sorted. Data are expressed as fold change over undifferentiated hESCs (D0); error bars indicate s.d. of technical triplicates. (H) FCM-BMP4-treated cells at day 5 are co-stained for KRT7 and the indicated mesoderm markers.
Fig. 7.
Fig. 7.
p63 is required for BMP4-induced trophoblast differentiation of hESCs. (A) hESCs expressing either scrambled or p63-specific shRNA (shp63), treated with FCM-BMP4 and stained with a panel of markers. Note lack of HLA-G and hCG expression, but similar expression of KRT7 in p63-shRNA-expressing cells. (B) FACS analysis of KRT7 and KRT18 in undifferentiated (D0, upper right) and FCM-BMP4-treated hESCs (day 6) expressing scrambled (D6-scram; bottom left) or p63-shRNA (D6-shp63; bottom right); percentage of double-positive cells is indicated. (C) qRT-PCR for markers of pluripotency and trophoblast in scrambled or p63-shRNA-expressing hESCs on days 0-8 following treatment with FCM-BMP4. For all graphs, y-axis represents fold change in mRNA relative to scrambled shRNA-infected cells at day 0. Error bars represent s.d. of technical triplicates. (D) Secretion of total hCGβ (left) and H-hCG (right) in scrambled or p63-shRNA-expressing hESCs. Data are normalized to DNA content and are expressed as mean ± s.d. of triplicate samples. (E) Heatmap of trophoblast-specific genes (same genes as in Fig. 1C) in scrambled- or p63-shRNA-expressing hESCs following treatment with FCM-BMP4. Note an overall decrease in trophoblast-specific gene expression in p63-shRNA versus scrambled-shRNA-expressing hESCs. Data shown are from a single shRNA infection experiment, and are expressed as mean ± s.d. of triplicate samples at the time points shown; data are representative of three independent experiments, with different preparations of hESCs and lentivirus. *P<0.05, **P<0.01, in comparison with scrambled shRNA-infected cells at the same time point. (F) ΔNp63α overexpression in hESCs, showing maintenance of the pluripotency marker OCT4.

References

    1. Adjaye J., Huntriss J., Herwig R., BenKahla A., Brink T. C., Wierling C., Hultschig C., Groth D., Yaspo M. L., Picton H. M., et al. (2005). Primary differentiation in the human blastocyst: comparative molecular portraits of inner cell mass and trophectoderm cells. Stem Cells 23, 1514–1525 - PubMed
    1. Amita M., Adachi K., Alexenko A. P., Sinha S., Schust D. J., Schulz L. C., Roberts R. M., Ezashi T. (2013). Complete and unidirectional conversion of human embryonic stem cells to trophoblast by BMP4. Proc. Natl. Acad. Sci. USA 110, E1212–E1221 - PMC - PubMed
    1. Apps R., Murphy S. P., Fernando R., Gardner L., Ahad T., Moffett A. (2009). Human leucocyte antigen (HLA) expression of primary trophoblast cells and placental cell lines, determined using single antigen beads to characterize allotype specificities of anti-HLA antibodies. Immunology 127, 26–39 - PMC - PubMed
    1. Baczyk D., Drewlo S., Proctor L., Dunk C., Lye S., Kingdom J. (2009). Glial cell missing-1 transcription factor is required for the differentiation of the human trophoblast. Cell Death Differ. 16, 719–727 - PubMed
    1. Bai Q., Assou S., Haouzi D., Ramirez J. M., Monzo C., Becker F., Gerbal-Chaloin S., Hamamah S., De Vos J. (2012). Dissecting the first transcriptional divergence during human embryonic development. Stem Cell Rev. 8, 150–162 - PMC - PubMed

Publication types

Substances