. 2013 Sep 4;33(36):14288-300.
doi: 10.1523/JNEUROSCI.5102-12.2013.

Effects of sleep and wake on oligodendrocytes and their precursors

Affiliations

Effects of sleep and wake on oligodendrocytes and their precursors

Michele Bellesi et al. J Neurosci. .

Abstract

Previous studies of differential gene expression in sleep and wake pooled transcripts from all brain cells and showed that several genes expressed at higher levels during sleep are involved in the synthesis/maintenance of membranes in general and of myelin in particular, a surprising finding given the reported slow turnover of many myelin components. Other studies showed that oligodendrocyte precursor cells (OPCs) are responsible for the formation of new myelin in both the injured and the normal adult brain, and that glutamate released from neurons, via neuron-OPC synapses, can inhibit OPC proliferation and affect their differentiation into myelin-forming oligodendrocytes. Because glutamatergic transmission is higher in wake than in sleep, we asked whether sleep and wake can affect oligodendrocytes and OPCs. Using the translating ribosome affinity purification technology combined with microarray analysis in mice, we obtained a genome-wide profiling of oligodendrocytes after sleep, spontaneous wake, and forced wake (acute sleep deprivation). We found that hundreds of transcripts being translated in oligodendrocytes are differentially expressed in sleep and wake: genes involved in phospholipid synthesis and myelination or promoting OPC proliferation are transcribed preferentially during sleep, while genes implicated in apoptosis, cellular stress response, and OPC differentiation are enriched in wake. We then confirmed through BrdU and other experiments that OPC proliferation doubles during sleep and positively correlates with time spent in REM sleep, whereas OPC differentiation is higher during wake. Thus, OPC proliferation and differentiation are not perfectly matched at any given circadian time but preferentially occur during sleep and wake, respectively.


Figures

Figure 1.
Figure 1.
CNP-eGFP expression is specific for oligodendrocytes. A, CNP-eGFP+ cell distribution in frontal cortex and white matter (WM). Roman numerals indicate cortical layers. Scale bar, 45 μm. B, Double-labeling studies showing colocalization (arrows) of CNP-eGFP (green) and the oligodendrocyte marker CNP (red). C, D, Double-labeling studies showing the absence of colocalization between CNP-eGFP (green) and the astrocytic marker GFAP (red) or the neuronal marker NeuN (red). B–D, Scale bar, 15 μm.
Figure 2.
Figure 2.
Sleep/wake pattern and response to sleep deprivation in CNP-eGFP-L10a mice. A, Representative EEG recordings (frontal cortex) of a CNP-eGFP-L10a mouse during wake, NREM sleep, and REM sleep. B, Twenty-four hour sleep and wake patterns. In this and the next panels, white and black bars indicate the light and dark period, respectively. Values are mean ± SEM. C, Twenty-four hour wake, NREM sleep, and REM sleep EEG power density spectra (0–20 Hz) in CNP-eGFP-L10a mice (0.25 Hz frequency bin). D, Hypnogram, SWA time course, and motion activity in a representative CNP-eGFP-L10a mouse during baseline (BSL, top) and after 4 h of sleep deprivation (SD, bottom). E, F, Twenty-four hour time course of NREM duration and SWA for BSL and SD. *p < 0.05, significant increase during the first 2 h of recovery sleep after SD relative to BSL (paired t test).
Figure 3.
Figure 3.
Enrichment analysis of CNP-eGFP-L10a IP samples. A, qPCR expression (mean ± SD, n = 18, 6 per group) of the cell-specific marker for oligodendrocytes (Mbp) is consistently enriched in the IP RNA across all groups (W, S, and SD), whereas the negative controls (Gfap for astrocytes, Syt1 for neurons) are consistently enriched in the UB samples. B, Scatter plots show normalized mean expression values for IP (x-axis, n = 18, 6 per group) and UB (y-axis, n = 18, 6 per group) samples of S, W, and SD groups. The middle diagonal red line indicates equal expression, and the black lines to each side indicate one log-fold enrichment or depletion. Left column, in all three experimental groups, the top 200 genes identified by Cahoy et al. (2008) as specific for mature oligodendrocytes (yellow) are enriched in IP samples, whereas the top 200 genes specific for astrocytes (red) and neurons (blue) are enriched in S, W, and SD UB samples. The remaining columns show enrichment based on the top 500 genes identified by Cahoy et al. (2008) as specific for OPCs (green), premyelinating oligodendrocytes (orange, preOLs), and mature oligodendrocytes (yellow, OLs). C, Histogram shows the percentage (mean ± SD) of eGFP+ cells that colocalize with PDGFRα, O4, and CNP. D, qPCR expression (mean ± SD, n = 18, 6 per group) of the OPC marker Pdgfrα is consistently enriched in the UB RNA across all groups (W, S, and SD). E, Histogram shows the percentage (mean ± SD) of eGFP+ cells that colocalize with PDGFRα and CNP in S (n = 3) and SD mice (n = 3).
Figure 4.
Figure 4.
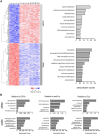
Functional characterization of genes differentially expressed in sleep (S) and wake (W + SD). A, Right, Heat diagrams show the probe set intensity for each individual animal in the three experimental groups. Left, A total of 286 genes for S and 379 genes for W + SD were recognized and mapped for functional annotation analysis (DAVID default settings, except for final group > 4 and multiple linkage threshold = 0.25). Top 10 functional annotation clusters in order of enrichment score are shown for S (top) and W + SD (bottom). B, Functional characterization of genes regulated in S and W + SD relative to genes preferentially expressed in OPCs, premyelinating oligodendrocytes (preOLs), and mature oligodendrocytes (OLs) (DAVID default settings, except for multiple linkage threshold = 0.25). Top 5 functional annotation clusters in order of enrichment score are shown for S (top) and W + SD (bottom).
Figure 5.
Figure 5.
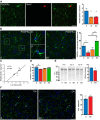
OPC proliferation and differentiation are affected by sleep and wake. A, Left, Double-labeling studies showing a colocalization of PDGFRα+ cell (green) and a BrdU+ cell in a representative microscopic field from a sleeping animal. Scale bar, 25 μm. Right, Number of PDGFRα+/BrdU+ cells in S (n = 6 mice), W (n = 6), and SD (n = 6). Values are mean ± SD. *p < 0.05 (Tukey's post hoc test). B, Left, Examples of PDGFRα+ cells (green) in S and SD. The framed regions representing two examples of cell doublet are enlarged in B′ and B″; cell nuclei were counterstained with propidium-iodide (blue). Scale bar, 20 μm. Right, PDGFRα+ cells forming a doublet in frontal cortex of sleeping (S, n = 6), sleep-deprived (SD, n = 6), spontaneously awake (W, n = 6), and recovering sleep after sleep deprivation (RS, n = 6) mice. Values are mean ± SD. *p < 0.01 (Tukey's post hoc test). **p < 0.001 (Tukey's post hoc test). C, Correlation of the number of PDGFRα+/BrdU+ cells with duration of REM sleep (r indicates Pearson coefficient). D, Quantitative analysis of PDGFRα+ cells in frontal cortex of S (n = 6), SD (n = 6), W (n = 6), and RS (n = 6) mice. Values are mean ± SD. *p < 0.05 (Tukey's post hoc test). Cells forming a doublet are indicated in gray bars. E, Western blotting results from three independent experiments (exp I-III), showing an increase of PDGFRα expression in S relative to SD (n = 12, 4 S, and 4 SD/experiment). Values are mean ± SD. *p < 0.05 (t test). F, Left, Examples of O4+ cells (green) in S and SD; cell nuclei were counterstained with propidium-iodide (blue). Arrowheads indicate the cells scored as O4+. Scale bar, 20 μm. Right, Relative quantitative analysis of O4+ cells in frontal cortex of S (n = 6) and SD (n = 5) mice. Values are mean ± SD. *p < 0.05 (t test).

Similar articles

Cited by

References

    1. Aguirre AA, Chittajallu R, Belachew S, Gallo V. NG2-expressing cells in the subventricular zone are type C-like cells and contribute to interneuron generation in the postnatal hippocampus. J Cell Biol. 2004;165:575–589. doi: 10.1083/jcb.200311141. - DOI - PMC - PubMed
    1. Barisone GA, Yun JS, Díaz E. From cerebellar proliferation to tumorigenesis: new insights into the role of Mad3. Cell Cycle. 2008;7:423–427. doi: 10.4161/cc.7.4.5413. - DOI - PubMed
    1. Baumann N, Pham-Dinh D. Biology of oligodendrocyte and myelin in the mammalian central nervous system. Physiol Rev. 2001;81:871–927. - PubMed
    1. Belachew S, Chittajallu R, Aguirre AA, Yuan X, Kirby M, Anderson S, Gallo V. Postnatal NG2 proteoglycan-expressing progenitor cells are intrinsically multipotent and generate functional neurons. J Cell Biol. 2003;161:169–186. doi: 10.1083/jcb.200210110. - DOI - PMC - PubMed
    1. Bergles DE, Roberts JD, Somogyi P, Jahr CE. Glutamatergic synapses on oligodendrocyte precursor cells in the hippocampus. Nature. 2000;405:187–191. doi: 10.1038/35012083. - DOI - PubMed

Publication types