. 2013 Sep 4;33(36):14331-41.
doi: 10.1523/JNEUROSCI.1681-13.2013.

Dopamine-dependent long-term depression at subthalamo-nigral synapses is lost in experimental parkinsonism

Affiliations

Dopamine-dependent long-term depression at subthalamo-nigral synapses is lost in experimental parkinsonism

Julien Pierre Dupuis et al. J Neurosci. .

Abstract

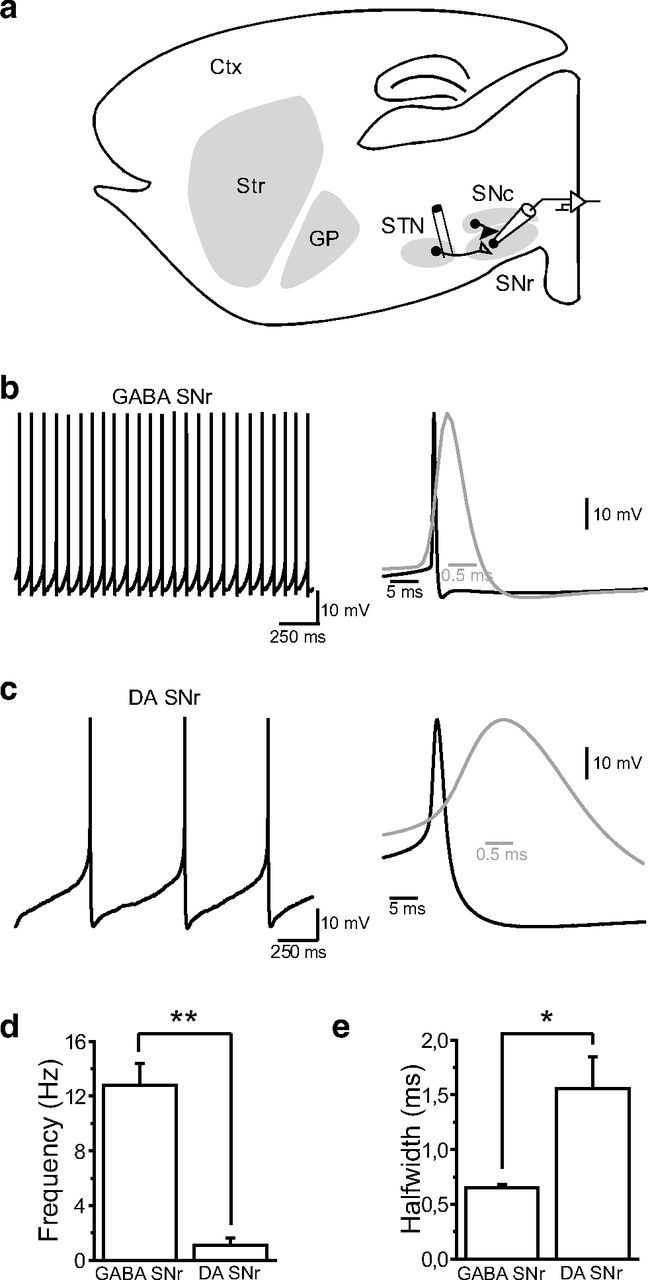
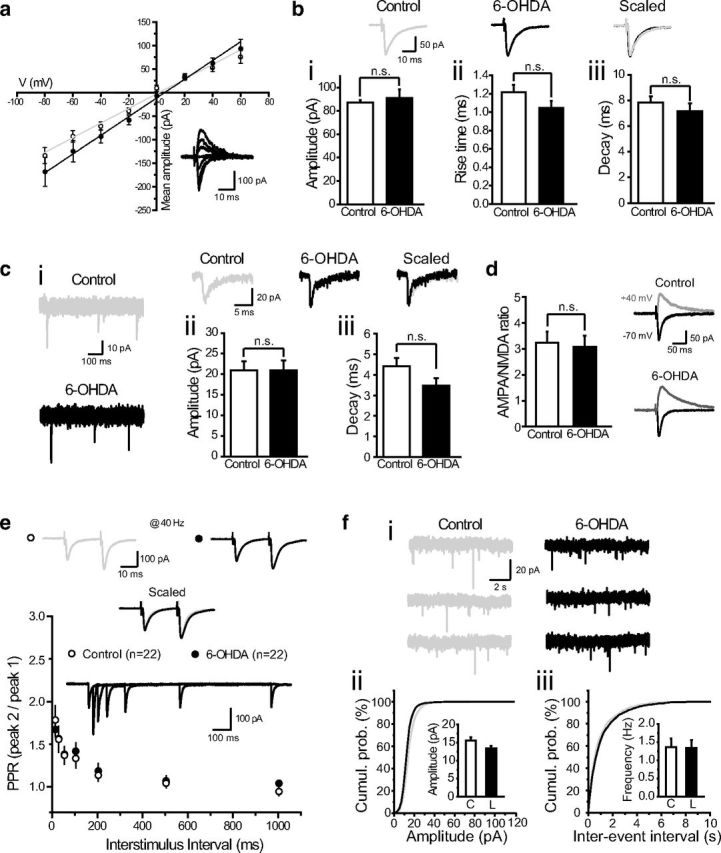
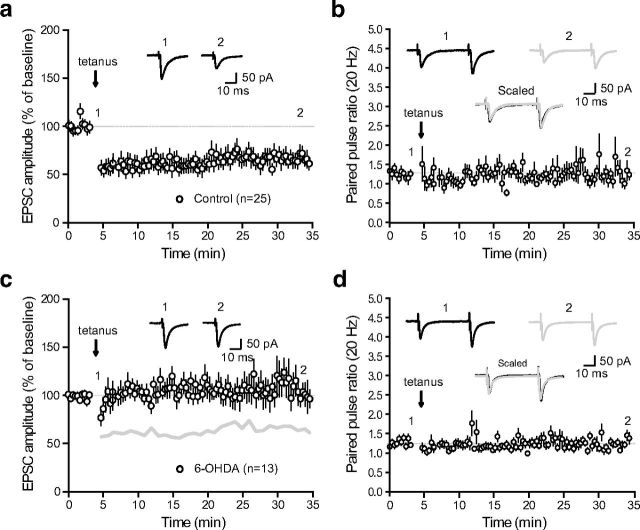
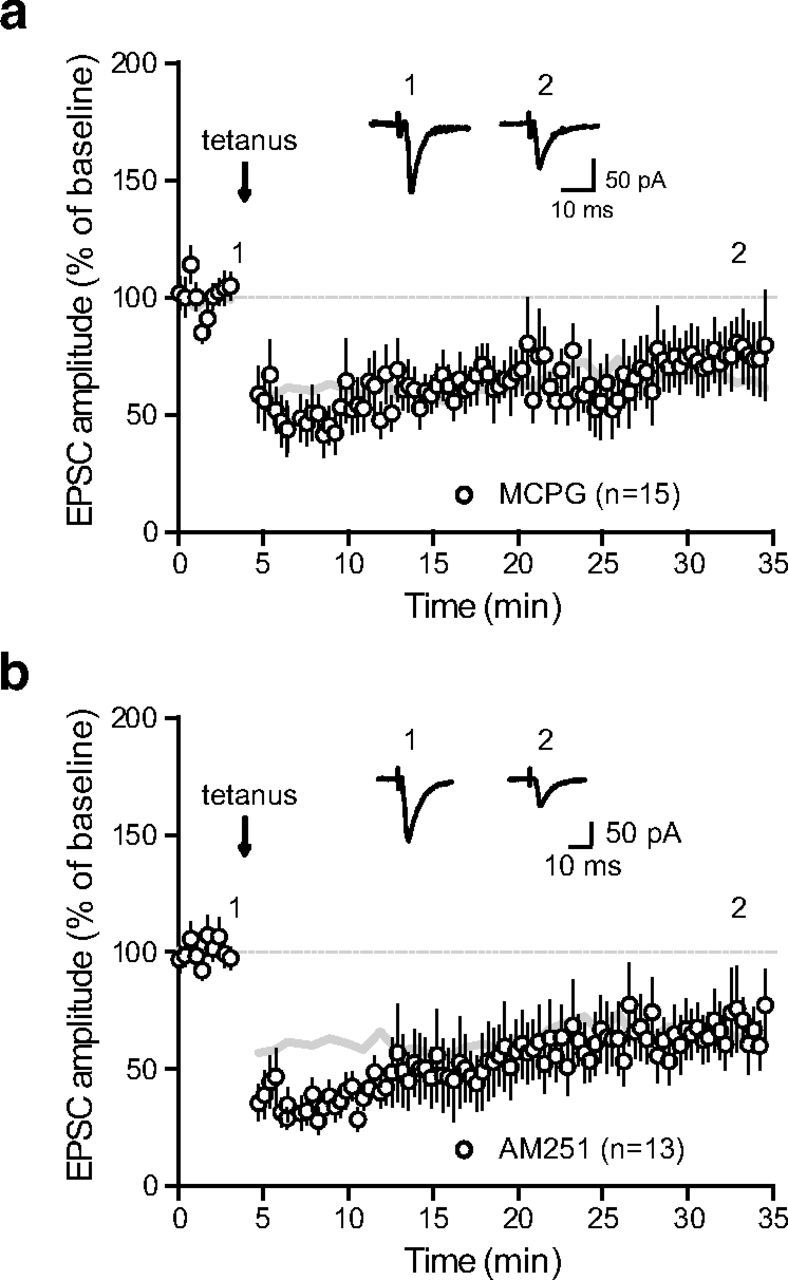
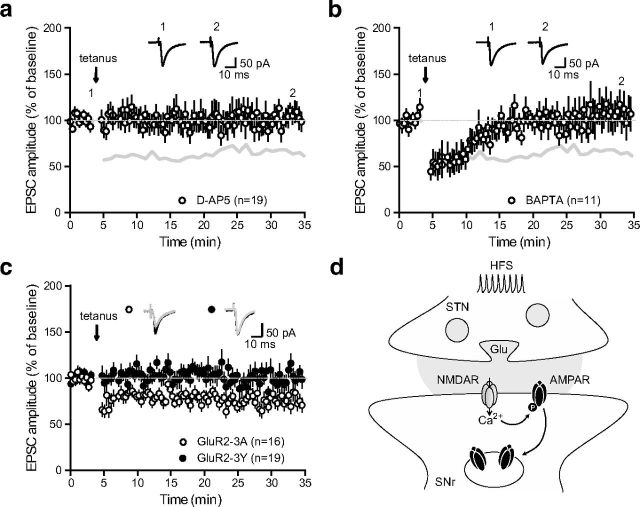
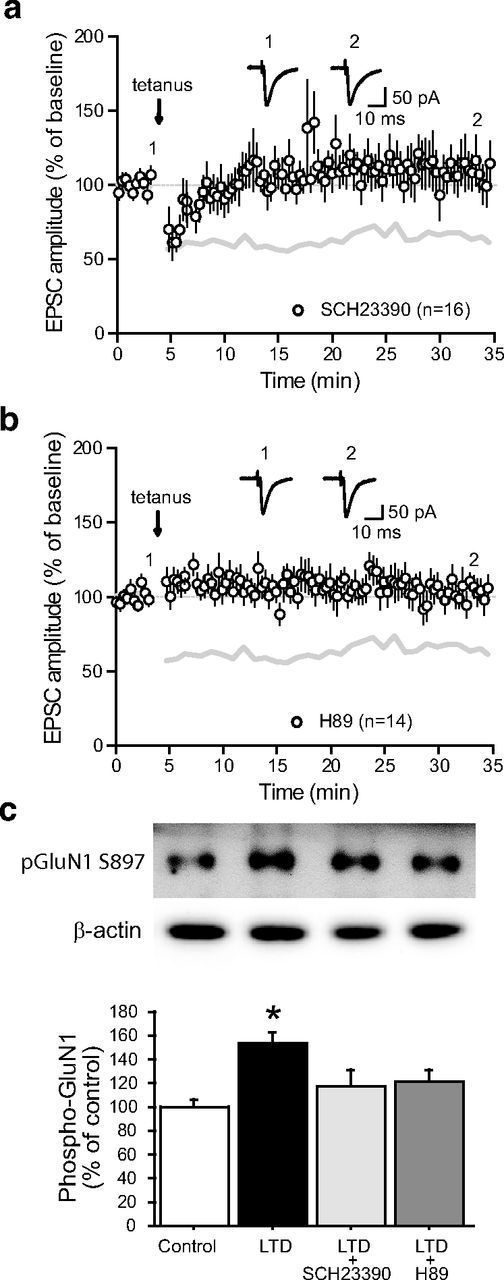
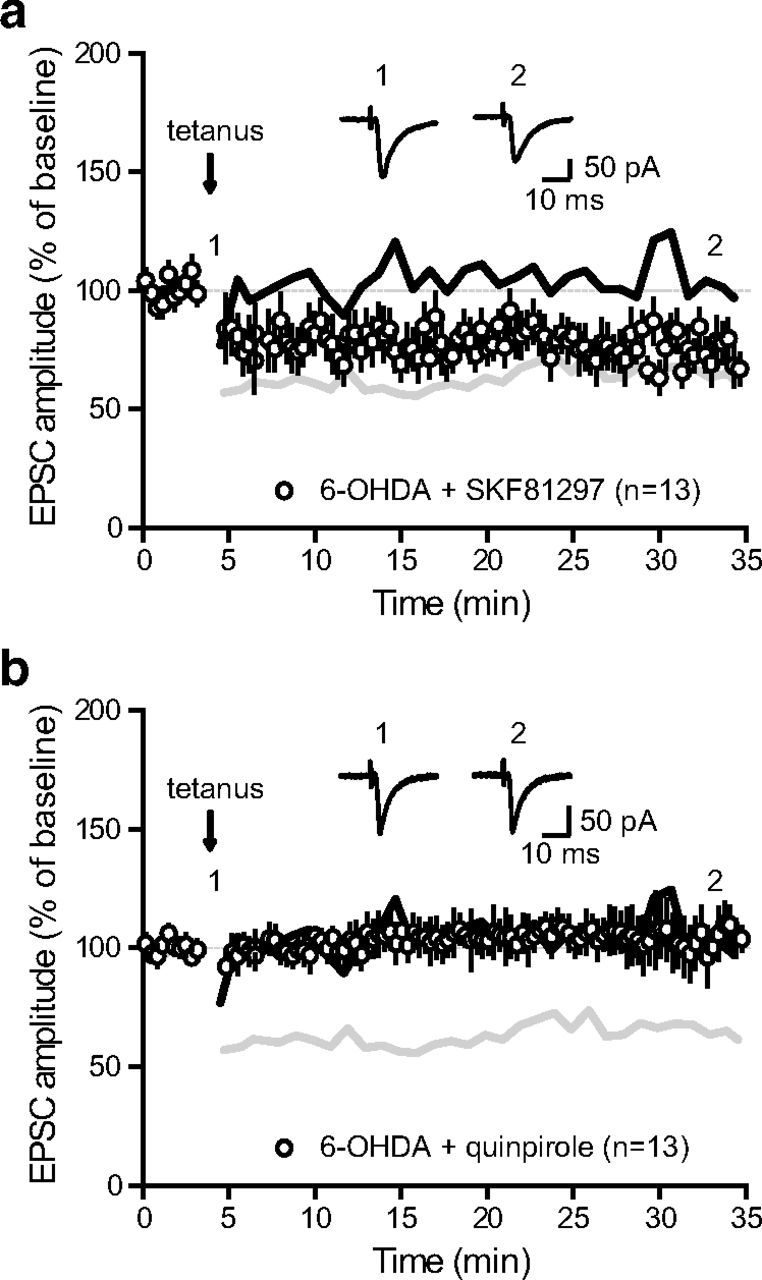
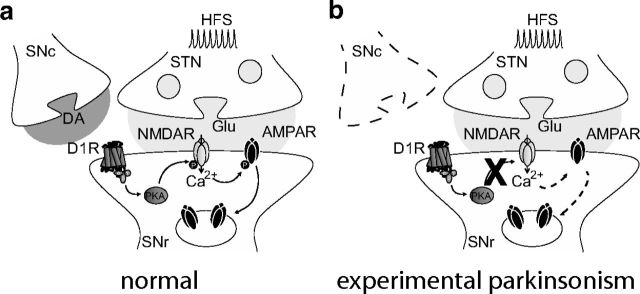
Impairments of synaptic plasticity are a hallmark of several neurological disorders, including Parkinson's disease (PD) which results from the progressive loss of dopaminergic neurons of the substantia nigra pars compacta leading to abnormal activity within the basal ganglia (BG) network and pathological motor symptoms. Indeed, disrupted plasticity at corticostriatal glutamatergic synapses, the gateway of the BG, is correlated to the onset of PD-related movement disorders and thus has been proposed to be a key neural substrate regulating information flow and motor function in BG circuits. However, a critical question is whether similar plasticity impairments could occur at other glutamatergic connections within the BG that would also affect the inhibitory influence of the network on the motor thalamus. Here, we show that long-term plasticity at subthalamo-nigral glutamatergic synapses (STN-SNr) sculpting the activity patterns of nigral neurons, the main output of the network, is also affected in experimental parkinsonism. Using whole-cell patch-clamp in acute rat brain slices, we describe a molecular pathway supporting an activity-dependent long-term depression of STN-SNr synapses through an NMDAR-and D1/5 dopamine receptor-mediated endocytosis of synaptic AMPA glutamate receptors. We also show that this plastic property is lost in an experimental rat model of PD but can be restored through the recruitment of dopamine D1/5 receptors. Altogether, our findings suggest that pathological impairments of subthalamo-nigral plasticity may enhance BG outputs and thereby contribute to PD-related motor dysfunctions.


Figures

Figure 1.
Figure 1.
Electrophysiological properties of putative GABAergic and dopaminergic neurons in substantia nigra. a, Schematic parasagittal section of a rat brain, showing the cortex and the BG nuclei (Str, striatum; GP, globus pallidus; STN, subthalamic nucleus; SNc, substantia nigra pars compacta; SNr, substantia nigra pars reticulata). Stimulation electrodes were implanted in the posterior part of the STN and eEPSCs in SNr neurons were recorded in whole-cell voltage-clamp. b, Typical example of autonomous pacemaking of a putative GABAergic neuron from the substantia nigra pars reticulata. Right, Average action potential from the neuron in left panel. c, Typical example of autonomous pacemaking of a putative DAergic neuron from the substantia nigra pars reticulata. Right, Average action potential from the neuron in left panel. d, e, Summary histograms showing the differences in action potential firing frequency (d, GABAergic, 12.8 ± 1.56 Hz; dopaminergic, 1.12 ± 0.48 Hz; **p < 0.01) and action potential kinetics (e, GABAergic, 0.648 ± 0.031 ms; dopaminergic, 1.559 ± 0.286 ms; p < 0.05) between the two substantia nigra pars reticulata cell types.
Figure 2.
Figure 2.
Properties of subthalamo-nigral glutamatergic synapses derived from intact and dopamine-denervated animals. a, Current–voltage relationships of AMPAR-mediated eEPSCs at STN-SNr synapses in control (open circles, n = 9) and DA-depleted animals (6-OHDA; filled circles, n = 8). Insets, Representative STN-SNr AMPAR-mediated eEPSCs recorded at membrane potentials of −80 mV to +60 mV (20 mV-step increments). b, Average amplitude (bi, peak current at −70 mV), rise time (bii), and decay (biii) of eEPSCs in control (white, n = 35) or DA-depleted (black, n = 35) conditions. Insets, Representative eEPSCs recorded at −70 mV from control (gray) and 6-OHDA-treated (black) slices. c, Spontaneous subthalamo-nigral EPSCs (ci, sEPSCs). Average amplitude (cii, peak current at −70 mV) and decay (ciii) of sEPSCs in control (white, n = 10) or DA-depleted (black, n = 10) conditions. Insets, Representative sEPSCs recorded at −70 mV from control (gray) and 6-OHDA-treated (black) slices. d, AMPA/NMDA ratio at STN-SNr synapses in control (n = 13) and DA-depleted conditions (n = 7). Insets, Representative eEPSC traces recorded at −70 mV (black) and +40 mV (gray) from control (top) and DA-depleted slices (bottom). e, Paired-pulse facilitation of STN-SNr transmission. PPRs (peak EPSC2/peak EPSC1) in control (open circles, n = 22) and DA-depleted slices (black circles, n = 22) are represented as a function of interstimulus interval. Control versus DA-depleted, p = 0.98, two-way ANOVA with Bonferroni's post hoc test. Insets, Traces from a representative individual trial, and eEPSCs from control (gray) and lesioned (black) slices recorded at a stimulation frequency of 40 Hz. f, Miniature EPSCs (fi, mEPSCs) recorded from control (gray) or lesioned (black) animals in the presence of tetrodotoxin (1 μm). Cumulative probability plots for mEPSC amplitude (fii) and interevent interval (fiii) in control (gray line, n = 7) and DA-depleted conditions (black line, n = 6). Insets, Average amplitude and frequency of mEPSCs in control (white, n = 7) or DA-depleted (black, n = 6) conditions (control vs DA-depleted, p > 0.05).
Figure 3.
Figure 3.
LTD of subthalamo-nigral transmission is lost in dopamine-depleted animals. a, Tetanic stimulation-induced (tetanus) LTD of STN-SNr transmission. Normalized eEPSC amplitudes (normalization to the mean amplitude of eEPSCs recorded during baseline acquisition) are plotted against time (n = 25). ad, Arrow indicates the time of induction (tetanus), and error bars represent SEM. Inset, Traces from a representative experiment illustrating the average eEPSC from 0 to 5 min (1) and 30 to 35 min (2). b, Evolution of the PPR during LTD induction experiments. PPRs are plotted against time. Inset, Traces from a representative experiment illustrating the average eEPSC from 0 to 5 min (1, black) and 30 to 35 min (2, gray). c, LTD induction protocol at STN-SNr synapses from DA-depleted animals (n = 13). The gray line represents the shape of control tetanus-induced LTD from Figure 2a for comparison (control vs 6-OHDA, p < 0.0001; one-way ANOVA with Tukey's post hoc test). Inset, Traces from a representative experiment illustrating the average eEPSC from 0 to 5 min (1) and 30 to 35 min (2). d, Evolution of the PPR during LTD induction experiments performed on slices from DA-depleted animals. PPRs are plotted against time. Insets, Traces from a representative experiment illustrating the average eEPSC from 0 to 5 min (1, black) and 30 to 35 min (2, gray).
Figure 4.
Figure 4.
LTD is mGluR-, eCB-independent. a, LTD induction protocol in the presence of the group I/II metabotropic glutamate receptor antagonist, MCPG (250 μm; n = 15). Inset: traces from a representative experiment illustrating the average eEPSC from 0 to 5 min (1) and 30 to 35 min (2). The gray lines in panels (a) and (b) represent the shape of control tetanus-induced LTD from Figure 2a for comparison. b, LTD induction protocol in the presence of the cannabinoid CB1 receptor antagonist AM251 (10 μm; n = 13; control vs AM251, p = 0.0002, one-way ANOVA with Tukey's post hoc test). Insets, Traces from a representative experiment illustrating the average eEPSC from 0 to 5 min (1) and 30 to 35 min (2).
Figure 5.
Figure 5.
LTD occurs through postsynaptic, NMDA-dependent endocytosis of GluA2-containing AMPA receptors. a, LTD induction protocol in the presence of the NMDA receptor antagonist d-APV (50 μm; n = 19). Inset, Traces from a representative experiment illustrating the average eEPSC from 0 to 5 min (1) and 30 to 35 min (2). The gray lines in a and b represent the shape of control tetanus-induced LTD from Figure 2a for comparison (control vs d-APV, p < 0.0001; one-way ANOVA with Tukey's post hoc test). b, LTD induction protocol in the presence of the calcium chelator BAPTA inside the patch pipette (10 μm; n = 11). Inset, Traces from a representative experiment illustrating the average eEPSC from 0 to 5 min (1) and 30 to 35 min (2). c, LTD induction is prevented in the presence of GluA23Y peptide (filled circles, n = 19) but not GluA23A peptide (open circles, n = 16) inside the patch pipette (GluA23A vs GluA23Y, p < 0.0001; one-way ANOVA with Tukey's post hoc test). Inset, Traces from representative experiments illustrating the average eEPSC from 0 to 5 min (black) and 30 to 35 min (gray), in the presence of GluA23A (open circles) or GluA23Y (filled circles). d, Schematic representation illustrating the potential signaling pathway underlying tetanus-induced LTD. Tetanic-stimulation induced calcium entry through NMDA receptors activates phosphorylation cascades, leading to the C-terminal phosphorylation of AMPA receptors and their subsequent internalization.
Figure 6.
Figure 6.
Acute dopaminergic modulation of subthalamo-nigral LTD. a, LTD induction protocol in the presence of the D1/5 receptor antagonist SCH23390 (5 μm; n = 16). Inset, Traces from a representative experiment illustrating the average eEPSC from 0 to 5 min (1) and 30 to 35 min (2). The gray lines in a and b represent the shape of control tetanus-induced LTD from Figure 2a for comparison (control vs SCH23390, p < 0.0001; one-way ANOVA with Tukey's post hoc test). b, LTD induction protocol in the presence of the PKA antagonist H89 (10 μm; n = 14; control vs H89, p < 0.0001; one-way ANOVA with Tukey's post hoc test). Inset, Traces from a representative experiment illustrating the average eEPSC from 0 to 5 min (1) and 30 to 35 min (2). c, D1/5 receptors and PKA are specifically involved in the phosphorylation of the NMDA receptor GluN1 subunit during LTD induction. The levels of phospho[Ser-897]-GluN1 were determined as described in Materials and Methods. Top, Representative autoradiograms. Bottom, Summary of data expressed as means ± SEM (n = 3). The amount of phosphorylated GluN1 is expressed as a percentage of that determined in basal condition (control). The increased phosphorylation of GluN1 triggered by LTD induction was prevented by the D1/5 receptor antagonist SCH23390 (10 μm) and the PKA inhibitor H89 (10 μm). *p = 0.007 versus respective control group; one-way ANOVA followed by Bonferroni post hoc test.
Figure 7.
Figure 7.
Activation of D1 receptors restores LTD induction in dopamine-depleted animals. a, LTD induction protocol at STN-SNr synapses from DA-depleted animals in the presence of the D1/5 receptor agonist SKF81297 (2 μm; n = 13). The gray and black lines in a and b represent the shapes of control LTD from Figure 2a and deficient LTD in DA-depleted animals from Figure 3c, respectively (6-OHDA + SKF81297 vs 6-OHDA, p < 0.0001; one-way ANOVA with Tukey's post hoc test). Inset, Traces from a representative experiment illustrating the average eEPSC from 0 to 5 min (1) and 30 to 35 min (2). b, LTD induction protocol at STN-SNr synapses from DA-depleted animals in the presence of the D2 receptor agonist quinpirole (5 μm; n = 13; 6-OHDA + quinpirole vs 6-OHDA, p > 0.05; one-way ANOVA with Tukey's post hoc test). Inset, Traces from a representative experiment illustrating the average eEPSC from 0 to 5 min (1) and 30 to 35 min (2).
Figure 8.
Figure 8.
Schematic representation illustrating the proposed signaling pathway by which D1/5 receptors modulate tetanus-induced LTD. Through the Gs-protein they are coupled with, D1/5 receptors enhance PKA activity which in turn modulates NMDA-dependent pathways including NMDA-dependent AMPA receptor endocytosis (a). This signaling pathway is lost in PD, preventing D1/5 receptor-mediated phosphorylation of the NMDA receptor GluN1 subunit and subsequent NMDA-dependent endocytosis of AMPAR (b).

Similar articles

Cited by

References

    1. Aceves JJ, Rueda-Orozco PE, Hernandez-Martinez R, Galarraga E, Bargas J. Bidirectional plasticity in striatonigral synapses: a switch to balance direct and indirect basal ganglia pathways. Learn Mem. 2011;18:764–773. doi: 10.1101/lm.023432.111. - DOI - PubMed
    1. Ahmadian G, Ju W, Liu L, Wyszynski M, Lee SH, Dunah AW, Taghibiglou C, Wang Y, Lu J, Wong TP, Sheng M, Wang YT. Tyrosine phosphorylation of GluR2 is required for insulin-stimulated AMPA receptor endocytosis and LTD. EMBO J. 2004;23:1040–1050. doi: 10.1038/sj.emboj.7600126. - DOI - PMC - PubMed
    1. Alexander GE, Crutcher MD. Functional architecture of basal ganglia circuits: neural substrates of parallel processing. Trends Neurosci. 1990;13:266–271. doi: 10.1016/0166-2236(90)90107-L. - DOI - PubMed
    1. Atherton JF, Bevan MD. Ionic mechanisms underlying autonomous action potential generation in the somata and dendrites of GABAergic substantia nigra pars reticulata neurons in vitro. J Neurosci. 2005;25:8272–8281. doi: 10.1523/JNEUROSCI.1475-05.2005. - DOI - PMC - PubMed
    1. Belluscio MA, Kasanetz F, Riquelme LA, Murer MG. Spreading of slow cortical rhythms to the basal ganglia output nuclei in rats with nigrostriatal lesions. Eur J Neurosci. 2003;17:1046–1052. doi: 10.1046/j.1460-9568.2003.02543.x. - DOI - PubMed

Publication types

LinkOut - more resources