. 2013 Sep 4;33(36):14369-78.
doi: 10.1523/JNEUROSCI.1954-13.2013.

Protein tyrosine phosphatase α in the dorsomedial striatum promotes excessive ethanol-drinking behaviors

Affiliations

Protein tyrosine phosphatase α in the dorsomedial striatum promotes excessive ethanol-drinking behaviors

Sami Ben Hamida et al. J Neurosci. .

Erratum in

  • J Neurosci. 2015 Dec 9;35(49):16295-6

Abstract

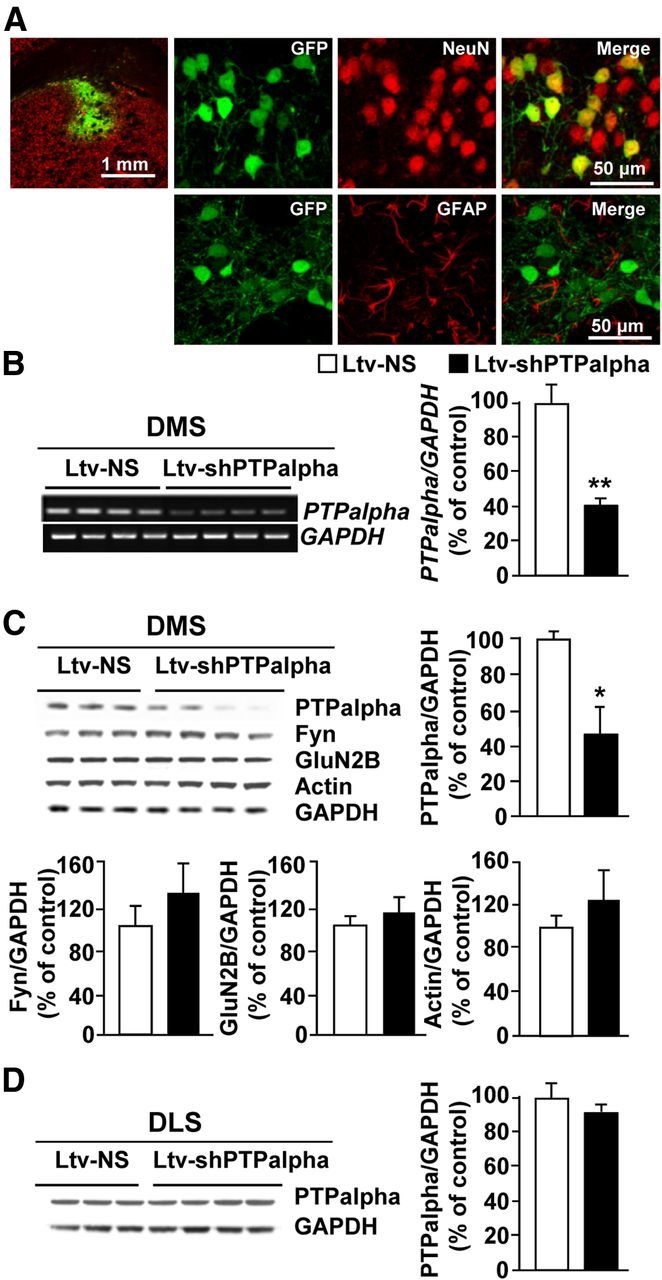
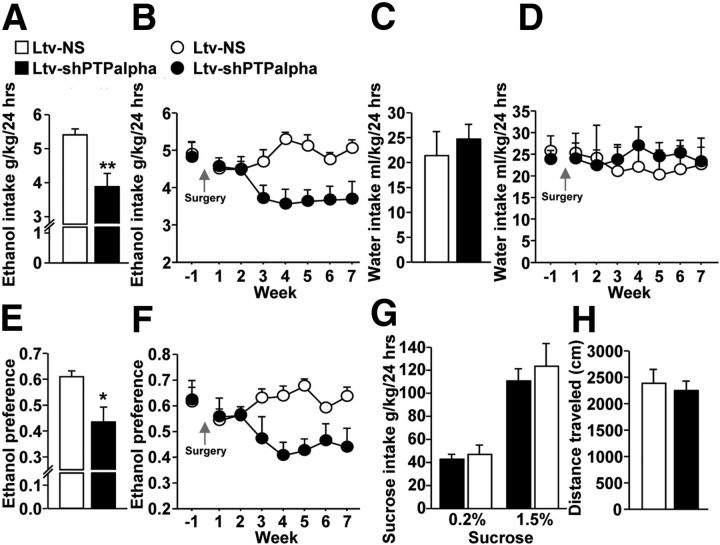
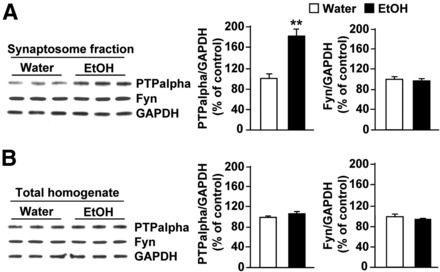
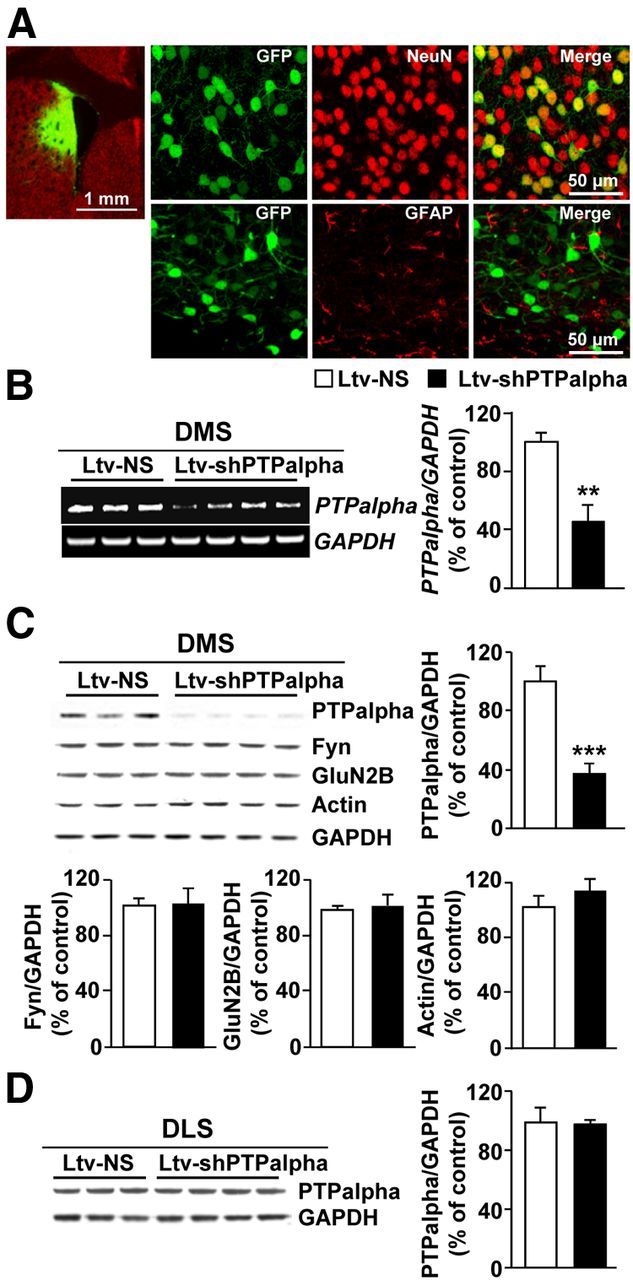
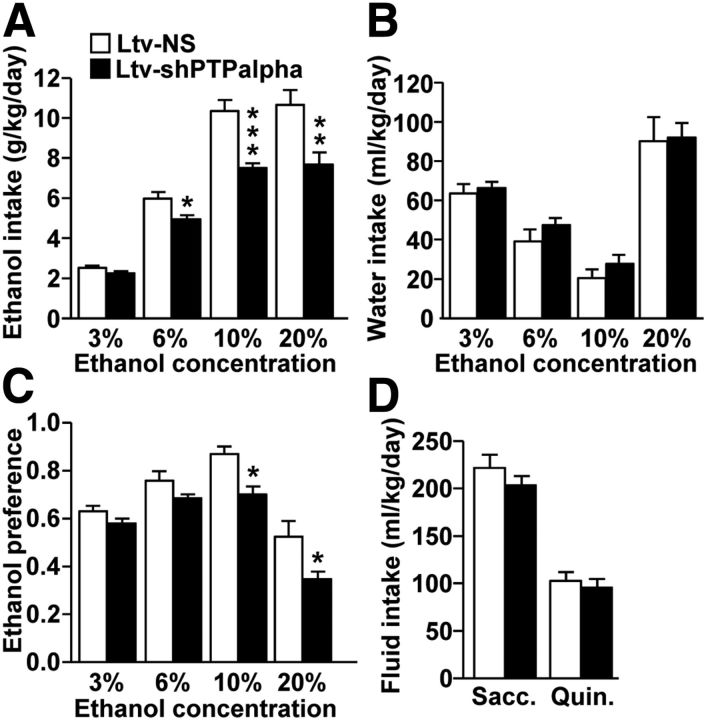
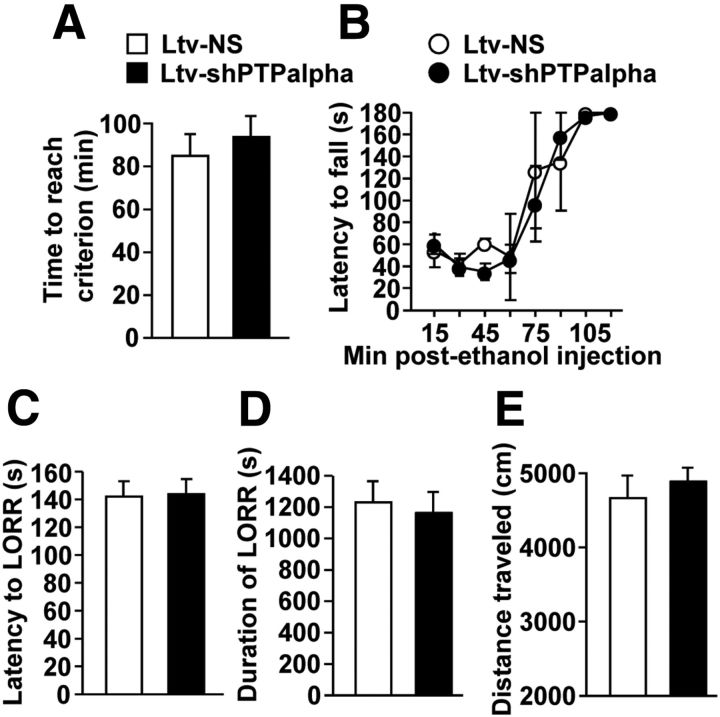
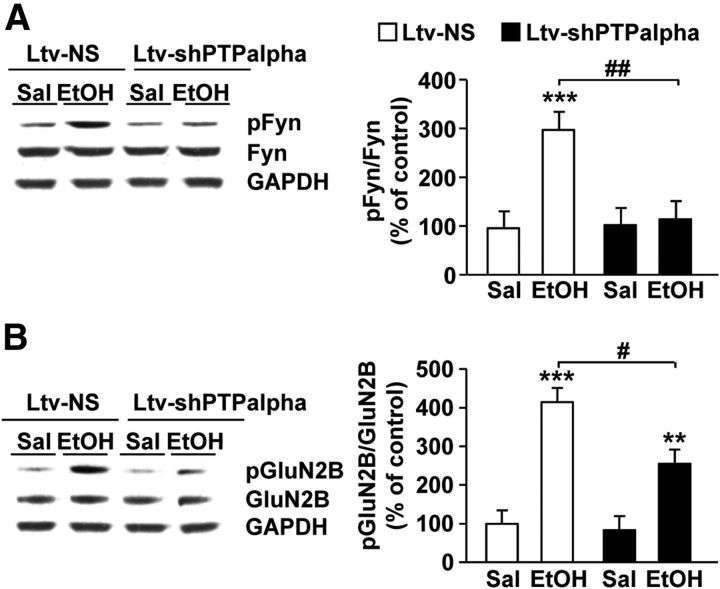
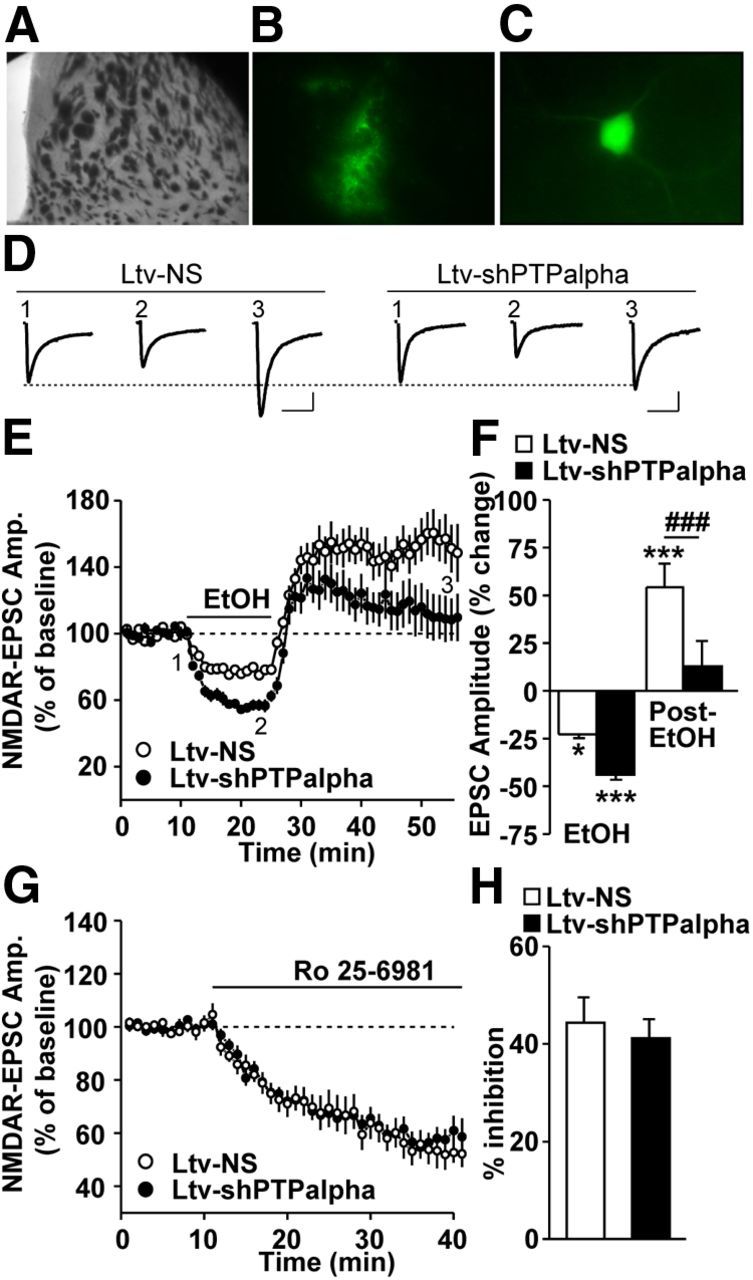
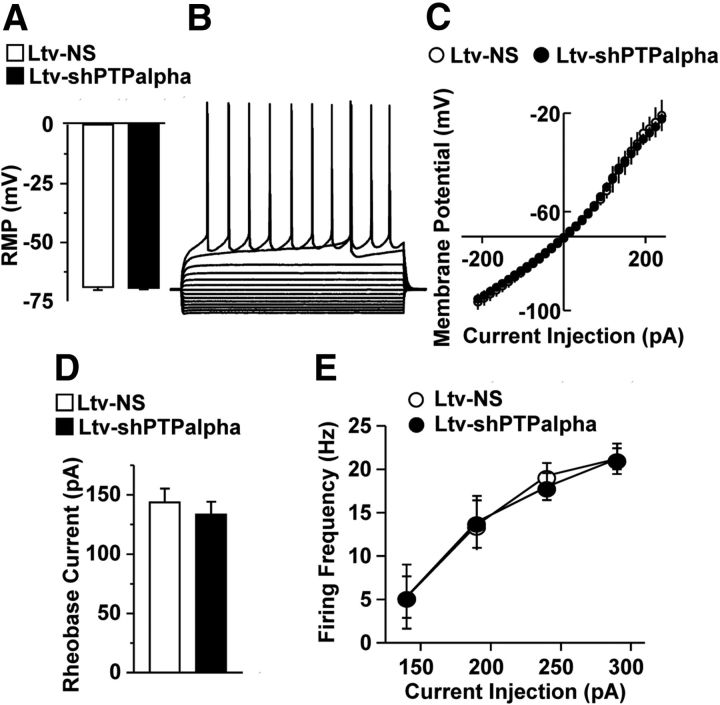
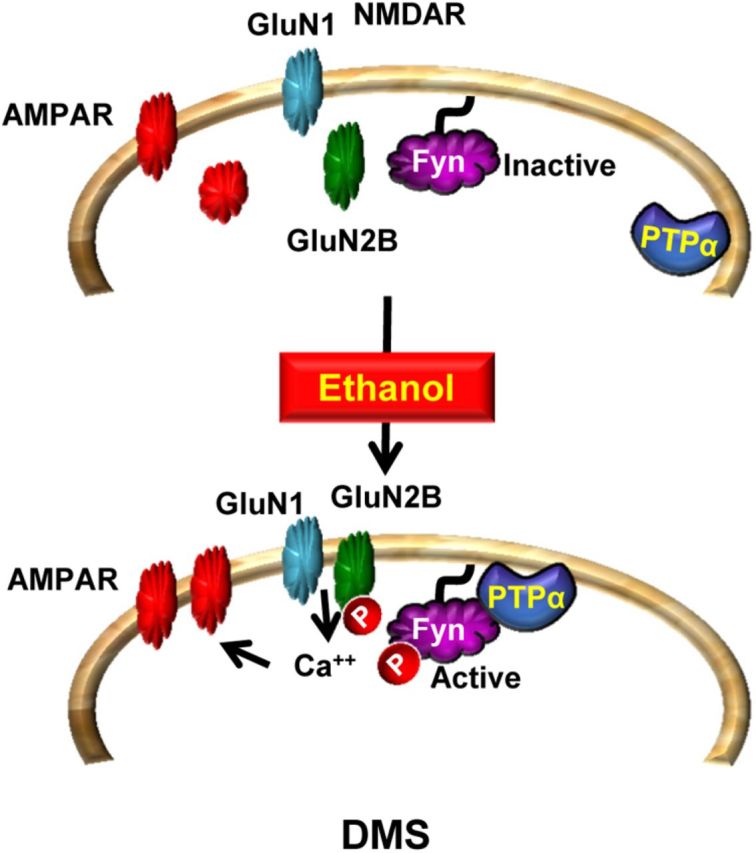
We previously found that excessive ethanol drinking activates Fyn in the dorsomedial striatum (DMS) (Wang et al., 2010; Gibb et al., 2011). Ethanol-mediated Fyn activation in the DMS leads to the phosphorylation of the GluN2B subunit of the NMDA receptor, to the enhancement of the channel's activity, and to the development and/or maintenance of ethanol drinking behaviors (Wang et al., 2007, 2010). Protein tyrosine phosphatase α (PTPα) is essential for Fyn kinase activation (Bhandari et al., 1998), and we showed that ethanol-mediated Fyn activation is facilitated by the recruitment of PTPα to synaptic membranes, the compartment where Fyn resides (Gibb et al., 2011). Here we tested the hypothesis that PTPα in the DMS is part of the Fyn/GluN2B pathway and is thus a major contributor to the neuroadaptations underlying excessive ethanol intake behaviors. We found that RNA interference (RNAi)-mediated PTPα knockdown in the DMS reduces excessive ethanol intake and preference in rodents. Importantly, no alterations in water, saccharine/sucrose, or quinine intake were observed. Furthermore, downregulation of PTPα in the DMS of mice significantly reduces ethanol-mediated Fyn activation, GluN2B phosphorylation, and ethanol withdrawal-induced long-term facilitation of NMDAR activity without altering the intrinsic features of DMS neurons. Together, these results position PTPα upstream of Fyn within the DMS and demonstrate the important contribution of the phosphatase to the maladaptive synaptic changes that lead to excessive ethanol intake.


Figures

Figure 1.
Figure 1.
Infection of rat DMS neurons with a Ltv-shPTPα produces downregulation of the expression of the phosphatase. Recombinant Ltv-shPTPα or a Ltv-NS was bilaterally infused at a titer of 2 × 10⁷ pg/ml into the DMS of rats. Striatal tissues were collected 6 weeks after virus infusions and used for immunohistochemistry (A), RT-PCR (B), and Western blot (C, D) analysis. A, Ltv-shPTPα infects DMS neurons. Top left, Specificity of the site of infection. Slices were costained with anti-GFP and anti-NeuN antibodies. Scale bar, 1 mm. Right, Costaining of GFP with NeuN (top) or GFAP (bottom). Scale bar, 50 μm. B–D, Ltv-shPTPα infection in the DMS decreases the mRNA (B) and protein levels (C) of PTPα in the DMS but not in the DLS (D). Ltv-shPTPα infection in the DMS does not change the protein levels of Fyn, GluN2B, or actin (C). GAPDH immunoreactivity was used as an internal loading control. Histograms represent the mean ratio of PTPα, Fyn, GluN2B, or actin/GAPDH ± SEM. Data are expressed as the percentage of control (Ltv-NS infected mice). *p < 0.05 (two-tailed unpaired t test). **p < 0.01 (two-tailed unpaired t test). B, n = 4. C, D, n = 3–4 for each group.
Figure 2.
Figure 2.
Knockdown of PTPα in the DMS of rats reduces excessive ethanol but not water or sucrose intake without altering locomotion. Rats were trained to consume a 20% ethanol solution in an intermittent access two bottle choice drinking paradigm. Animals were given 24 h of concurrent access to one bottle of 20% ethanol (v/v) and one bottle of water every other day for 6 weeks. After a stable baseline level of excessive ethanol intake was established, Ltv-shPTPα or the control virus Ltv-NS were infused into the rat DMS. One week after virus infusion, the two bottle choice drinking procedure was resumed, and levels of ethanol and water intake, as well as preference for the ethanol solution over water were measured. Average of ethanol (A) and water (C) intake, and ethanol preference (E) in a 24 h drinking session during the last month of the experiment (from week 4 to week 7). Average of ethanol (B) and water (D) intake, and ethanol preference (F) in a 24 h drinking session per week over 8 weeks (one week before and 7 weeks after virus infusion). A, B, Average of 24 h ethanol consumption per month (A) and per week (B). C, D, Average 24 h water intake per month (C) and per week (D). E, F, Average of ethanol preference per 24 h drinking session per month (E) and per week (F). Ethanol preference was calculated as the percentage of ethanol solution consumed in 24 h relative to total fluid intake (ethanol + water). G, Downregulation of PTPα in the rat DMS does not affect sucrose intake. One week after the end of the ethanol drinking experiment, rats were tested for sucrose intake in an intermittent access two bottle choice drinking procedure. Each concentration of sucrose (0.2% and 1.5%) was tested for 2 weeks. Shown is an average of sucrose intake in a 24 h drinking session. H, Knockdown of PTPα in the DMS of rats does not affect locomotor activity. Three days after the end of sucrose experiments, animals were tested for spontaneous locomotor activity. Rats were placed in locomotor activity chambers, and the distance traveled was recorded for 1 h. Data represent the cumulative locomotor activity (cm) during the testing period. Data are mean ± SEM. *p < 0.05 (two-way RM-ANOVA with SNK post hoc test and two-tailed unpaired t test). **p < 0.01 (two-way RM-ANOVA with SNK post hoc test and two-tailed unpaired t test). n = 7 or 8 for each group.
Figure 3.
Figure 3.
Ethanol consumption compartmentalizes PTPα in the synaptosomal fraction of the DMS of mice. Mice had continuous access to 10% ethanol for 21 d in a two bottle choice paradigm. At the end of the last 24 h ethanol drinking session, DMS tissue was collected and the protein levels of PTPα (top) and Fyn (middle) in synaptosomal fraction (A) and in the total homogenate (B) were measured. Control animals underwent the same paradigm but had access to water only. GAPDH immunoreactivity was used as an internal loading control. Histograms represent the mean ratio of PTPα or Fyn/GAPDH ± SEM, and data are expressed as the percentage of control (mice with access only to water). **p < 0.01 (two-tailed unpaired t test). n = 3.
Figure 4.
Figure 4.
Infection of mouse DMS neurons with Ltv-shPTPα produces a knockdown of the expression of the phosphatase. Recombinant lentivirus containing Ltv-shPTPα or Ltv-NS was bilaterally infused at a titer of 2 × 10⁷ pg/ml into the DMS of mice. Striatal tissues were collected 4 weeks after virus infusions and used for immunohistochemistry (A), RT-PCR (B), and Western blot (C,D) analysis. A, Ltv-shPTPα infects DMS neurons. Slices were costained with anti-GFP and anti-NeuN antibodies. Left, Specificity of the infection site. Scale bar, 1 mm. Right, Costaining of GFP with NeuN (top) or GFAP (bottom). Scale bar, 50 μm. B–D, Ltv-shPTPα decreases the mRNA (B) and protein level (C) of PTPα in the DMS but not the DLS (D). Ltv-shPTPα infection in the DMS does not change the protein levels of Fyn, GluN2B, or actin (C). GAPDH immunoreactivity was used as an internal loading control. Histograms represent the mean ratio of PTPα, Fyn, GluN2B, or actin/GAPDH ± SEM. Data are expressed as the percentage of control (Ltv-NS-infected mice). **p < 0.01 (two-tailed unpaired t test). ***p < 0.001 (two-tailed unpaired t test). B–D, n = 3–4 for each group.
Figure 5.
Figure 5.
Knockdown of PTPα in the mouse DMS reduces ethanol but not water intake. A–C, Knockdown of PTPα in the DMS of mice reduces ethanol intake. Mice were infused with Ltv-shPTPα or Ltv-NS in the DMS. Four weeks later, animals were tested in a continuous access two bottle choice drinking protocol. Mice were allowed access to a bottle containing an ethanol solution and a bottle of tap water for 4 weeks. Ethanol concentrations were progressively increased from 3% to 20% (3%, 6%, 10%, and 20%) ethanol with 7 d access for each concentration. A, Average of daily ethanol intake. B, Average of daily water intake. C, Average of daily ethanol preference per week. Ethanol preference was calculated as the percentage of ethanol solution consumed relative to total fluid intake (ethanol + water). D, Knockdown of PTPα in the DMS of mice does not alter intake of saccharin or quinine. Animals had access to saccharine (0.066%) or quinine (0.06 mm) in a continuous access two bottle choice drinking protocol. Each solution was provided for 3 consecutive days. Group data represent mean ± SEM. *p < 0.05 (two-way ANOVA with SNK post hoc test). **p < 0.01 (two-way ANOVA with SNK post hoc test). ***p < 0.001 (two-way ANOVA with SNK post hoc test). n = 10–12 for each group.
Figure 6.
Figure 6.
Downregulation of PTPα expression in the DMS of mice does not alter motor coordination, ethanol-induced LORR, and spontaneous locomotor activity in mice. Experiments were conducted at the end of the drinking experiments described in the legend of Figure 5. A, B, Rotarod test. On the first day of the experiment, the time to reach 180 s criterion was recorded (A). One day later, animals were administered ethanol (1.5 g/kg) and placed and latency to fall from the rotarod was recorded every 15 min (B). C, D, LORR test. Three days after the Rotarod test, mice were given 3.2 g/kg ethanol and the latency to (C) and duration of (D) the LORR were recorded. E, Knockdown of PTPα in the DMS of mice does not affect spontaneous locomotor activity. One week after the end of the LORR experiment, animals were tested for spontaneous locomotor activity. Mice were placed in locomotor activity chambers, and the distance traveled was recorded for 30 min. Data are presented as cumulative locomotor activity (cm) during the testing period. Data are mean ± SEM. A, B, n = 6–9 for each group. C, D, n = 6–8 for each group. E, n = 10–12 for each group.
Figure 7.
Figure 7.
PTPα knockdown in the DMS decreases ethanol-induced Fyn activation and GluN2B phosphorylation. Mice were infused with Ltv-NS or Ltv-shPTPα in the DMS. Four weeks after the virus infusion, animals were treated with an acute administration of saline (Sal) or ethanol (EtOH, 2.5 g/kg, i.p.) and the DMS was collected 15 min later. Anti-[pY418/420]Src/Fyn and anti-Fyn antibodies (A) and anti-[pY1472] GluN2B and anti-GluN2B antibodies (B) were used to detect the activated form and the total amount of Fyn (A) and the phosphorylated and total amount of GluN2B (B), respectively. Optical density of immunoreactivity of phosphorylated-protein bands was normalized to total protein and plotted as percentage of Ltv-NS/saline treatment. A, ***p < 0.001 versus Ltv-NS/Sal. ##p < 0.01 versus Ltv-NS/EtOH. B, **p < 0.01, versus Ltv-NS/Sal. ***p < 0.001 versus Ltv-NS/Sal. #p < 0.05 versus Ltv-NS/EtOH. n = 8 or 9 for each group.
Figure 8.
Figure 8.
Downregulation of PTPα in the DMS increases ethanol-mediated inhibition and decreases ethanol withdrawal-induced LTF of NMDAR activity. Mice were infused with Ltv-NS or Ltv-shPTPα in the DMS. DMS slices were prepared 4 weeks after infusion. A–C, Imaging striatal infected neurons. A, A sample image of a coronal striatal slice. B, An image showing the fluorescence of the infected area in A. C, Representative image of an infected neuron that was selected for whole-cell recording. D–F, NMDAR-mediated EPSCs were measured in fluorescent neurons in response to bath application of 50 mm ethanol. D, Sample traces of EPSCs from Ltv-NS (left)- and Ltv-shPTPα (right)-infused mice at time periods 1–3 that are indicated in E. The stimulus artifacts have been omitted for clarity. Calibration: 200 ms, 60 pA. E, Time course of NMDAR-mediated EPSCs before, during (15 min, as indicated by the horizontal bar), and after ethanol treatment in Ltv-NS- and Ltv-shPTPα-infected neurons. F, Bar graph comparing the ethanol (EtOH) and washout (post-EtOH) effects on EPSCs. EPSCs were averaged from 10 to 15 min after ethanol application (EtOH) and from 20 to 30 min after ethanol washout (post-EtOH). G, H, inhibition of ethanol-mediated LTF of NMDAR activity is not the result of an alteration in the basal level of NMDAR activity in response to PTPα knockdown. G, Time course of NMDAR-mediated EPSCs before and during bath application of Ro 25–6981 (0.5 μm). H, Summary of the mean inhibition magnitude of NMDAR-EPSCs by Ro 25–6981 in Ltv-NS- and Ltv-shPTPα-infected neurons in the DMS. E, F, Two-way RM-ANOVA with SNK post hoc test. *p < 0.05 versus baseline, ***p < 0.001 versus baseline, ###p < 0.001 Ltv-NS versus Ltv-shPTPα. E, F, n = 10 (Ltv-NS) and 9 (Ltv-shPTPα). G, H, n = 9 (Ltv-NS) and 13 (Ltv-shPTPα).
Figure 9.
Figure 9.
Downregulation of PTPα does not alter intrinsic features of MSNs in the DMS. Mice were infused with Ltv-NS or Ltv-shPTPα in the DMS, striatal slices were prepared 4 weeks after infusion, and whole-cell current-clamp recordings were conducted in fluorescent neurons. A, Bar graph showing no significant differences in resting membrane potentials (RMP) between Ltv-NS- and Ltv-shPTPα-infected neurons. B, Representative traces of membrane potentials in response to a series of 1 s current injections in a Ltv-shPTPα-infected neuron. The injected currents were increased from −210 to 180 pA, in increments of 30 pA. C, Current–voltage (I-V) curves were plotted with membrane potentials in response to a series of current injections from −210 to 210 pA, in increments of 15 pA. The membrane potentials were measured during the last 100 ms of the current injection. No significant difference in the I-V relationship between Ltv-NS- and Ltv-shPTPα-infected neurons was observed. D, Bar graph comparing the rheobase currents of Ltv-NS- and Ltv-shPTPα-infected neurons. E, Excitability of Ltv-NS- and Ltv-shPTPα-infected neurons. Neurons were injected with 140, 190, 240, and 290 pA currents, and the firing frequency was measured. A–C, n = 7 (Ltv-NS) and 12 (Ltv-shPTPα). D, E, n = 7 (Ltv-NS) and 9 (Ltv-shPTPα).
Figure 10.
Figure 10.
PTPα in the DMS of rodents promotes ethanol excessive drinking via Fyn. At resting state, PTPα is localized away from Fyn. Upon exposure of DMS neurons to ethanol, PTPα moves to the synaptosomal fraction where Fyn resides (Gibb et al., 2011; and herein). PTPα dephosphorylates the inhibitory site on Fyn, resulting in kinase activation. Fyn in turn phosphorylates GluN2B, leading to an increase in the synaptic membranal localization and activity of the channel (Wang et al., 2007, 2010, 2011). The sustained activation of NMDAR (Wang et al., 2007, 2010, 2011) leads to the movement of AMPARs to the synaptic membrane and to the enhancement of LTP (Wang et al., 2012). These plasticity events in the DMS promote excessive drinking of ethanol.

Similar articles

Cited by

References

    1. Ben Hamida S, Neasta J, Lasek AW, Kharazia V, Zou M, Carnicella S, Janak PH, Ron D. The small G protein H-Ras in the mesolimbic system is a molecular gateway to alcohol-seeking and excessive drinking behaviors. J Neurosci. 2012;32:15849–15858. doi: 10.1523/JNEUROSCI.2846-12.2012. - DOI - PMC - PubMed
    1. Bhandari V, Lim KL, Pallen CJ. Physical and functional interactions between receptor-like protein-tyrosine phosphatase α and p59fyn. J Biol Chem. 1998;273:8691–8698. doi: 10.1074/jbc.273.15.8691. - DOI - PubMed
    1. Bodrikov V, Leshchyns'ka I, Sytnyk V, Overvoorde J, den Hertog J, Schachner M. RPTPα is essential for NCAM-mediated p59fyn activation and neurite elongation. J Cell Biol. 2005;168:127–139. doi: 10.1083/jcb.200405073. - DOI - PMC - PubMed
    1. Carnicella S, Amamoto R, Ron D. Excessive alcohol consumption is blocked by glial cell line-derived neurotrophic factor. Alcohol. 2009;43:35–43. doi: 10.1016/j.alcohol.2008.12.001. - DOI - PMC - PubMed
    1. Chen M, Chen SC, Pallen CJ. Integrin-induced tyrosine phosphorylation of protein-tyrosine phosphatase-α is required for cytoskeletal reorganization and cell migration. J Biol Chem. 2006;281:11972–11980. doi: 10.1074/jbc.M600561200. - DOI - PubMed

Publication types

MeSH terms

Substances