. 2013 Sep 4;33(36):14379-91.
doi: 10.1523/JNEUROSCI.0287-13.2013.

Chronic stress-induced alterations of dendritic spine subtypes predict functional decrements in an hypothalamo-pituitary-adrenal-inhibitory prefrontal circuit

Affiliations

Chronic stress-induced alterations of dendritic spine subtypes predict functional decrements in an hypothalamo-pituitary-adrenal-inhibitory prefrontal circuit

Jason J Radley et al. J Neurosci. .

Abstract

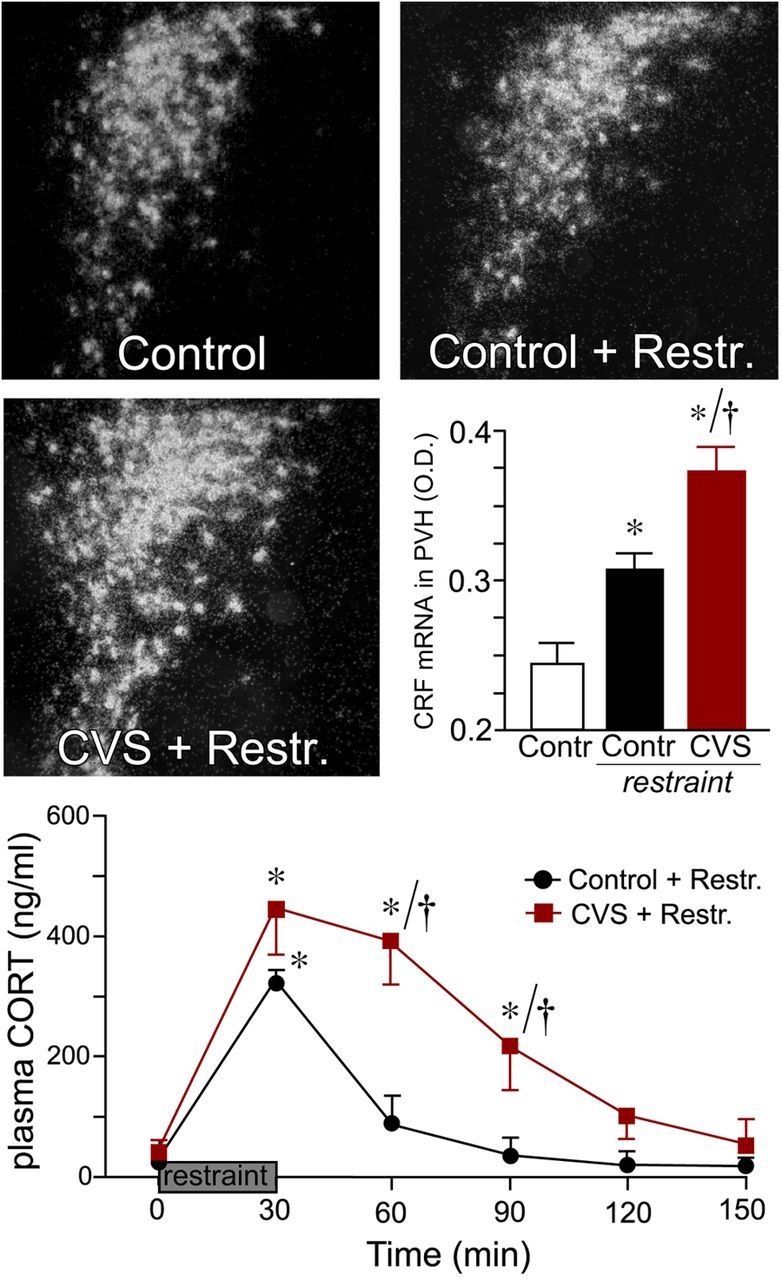
Activation of the hypothalamo-pituitary-adrenal (HPA) axis plays a vital role in promoting adaptation during acute stress, but adverse effects of chronic stress may result from overactivity of this system. Recent evidence highlights a subdivision of GABAergic neurons within anterior bed nuclei of the stria terminalis (aBST) that integrates and relays inhibitory influences to HPA-effector neurons in paraventricular hypothalamus during acute stress, notably from medial prefrontal [prelimbic (PL)] and hippocampal [ventral subiculum (vSUB)] cortical fields. Here we localize the site and candidate mechanism of neuroplasticity within upstream regions of this inhibitory network after chronic variable stress (CVS). Rats bearing retrograde tracer injections in aBST underwent CVS for 14 d. Retrogradely labeled and unlabeled neurons in vSUB and PL were selected for intracellular dye filling, followed by three-dimensional imaging and analysis of dendritic arborization and spine morphometry. Whereas PL neurons displayed decreases in dendritic branching and spine density after CVS, aBST-projecting cells showed a selective loss of mature mushroom-shaped spines. In a follow-up experiment, CVS-treated and control rats were exposed to a novel restraint challenge for assay of HPA activation and engagement of aBST-projecting cortical regions. CVS animals showed enhanced HPA output and decreased Fos activation in aBST-projecting PL neurons compared with acutely stressed controls. In contrast, vSUB failed to show any significant differences in structural plasticity or functional activation patterns after CVS. These findings define a mechanism whereby synaptic destabilization in the PL → aBST pathway may dampen its ability to impart inhibitory control over the HPA axis after chronic stress exposure.


Figures

Figure 1.
Figure 1.
Reconstructions of FB tracer injection placements in aBST in control and CVS rats (left and right columns, respectively). Epifluorescence photomicrographs (top row) depict examples of FB tracer deposits. The shaded regions in the diagrams (below) indicate areas of overlap common to all tracer injections and their approximate extent of diffusion into adjacent-lying structures. In the diagrams, four representative examples are shown from each treatment group. ac, Anterior commissure; AP, anteroposterior; dl, dorsolateral subdivision of aBST; dm, dorsomedial subdivision of aBST; fu, fusiform subdivision of aBST; ic, internal capsule; LPO, lateral preoptic area; mg, magnocellular subdivision of posterior BST (pBST); MPN, median preoptic nucleus; MPO, medial preoptic area; och, optic chiasm; PS, parastrial nucleus; rh, rhomboid subdivision of pBST; v3, third ventricle.
Figure 2.
Figure 2.
Digital images showing examples of retrograde labeling in PL (top row) and vSUB (bottom row). Left column, Examples of retrogradely labeled patterns after FB injections in aBST. Right column, Images approximating the actual level of magnification used (40×) when injecting LY fluorescent dye into FB-labeled cell bodies (cyan). In these images, dye-impregnated neurons (orange) were minimally filled to optimally illustrate colocalization of each label. Maximal loading with LY is necessary to perform the high-resolution imaging and spine analysis, but the resultant intensity of fluorescence would obscure visualization for illustrative purposes. CA1, Cornu ammoni of hippocampus; Ent, entorhinal cortex. Scale bar: top left, 500 μm; bottom left, 300 μm; right column, 100 μm.
Figure 3.
Figure 3.
Top left, Example neuron in layer 2/3 of PL that was iontophoretically filled (left) and the rendering of its dendritic tree (middle) using computer-assisted morphometry. The apical dendritic tree points up toward the pial surface, whereas the axon and basal dendrites radiate from the opposite pole of the cell body. The red dashed circle demarcates the 150 μm boundary used to partition the dendritic tree for spine analyses. Bottom left, Histograms for dendritic length and number of branch endings for apical and basal dendrites. CVS produced significant decreases in both dendritic indices, regardless of whether neurons were aBST-projecting (FB+) or unlabeled (FB). Preliminary analyses in control animals did not show any differences between aBST-projecting and non-projecting neurons and were pooled together into a single group (i.e., FB+/−). Bottom middle, The Sholl analysis for summed dendritic length as a function of radial distance shows that the effects of CVS were most pronounced in the distal apical dendritic tree. Data represent mean ± SEM for each index and are based on overall animal averages (i.e., n = 5 animals per group; n = 1 arbor per neuron; n = 5 neurons per animal). Top right, Examples of deconvolved confocal laser-scanning microscopy images of dendritic segments as a function of treatment status. Bottom right, CVS induced a significant, comparable degree of decreases in overall spine density in both subpopulations of LY-labeled PL neurons. *p < 0.05, statistically significant differences from unstressed controls. Data represent mean ± SEM for each index and are based on animal averages (i.e., n = 5 animals per group; n = 1–3 segments per neuron; n = 5 neurons per animal). Scale bar: top left, middle images, 100 μm; three images in top right, 5 μm.
Figure 4.
Figure 4.
Top row, Example high-resolution deconvolved optical z-stack of a dendritic segment used for spine analysis with NeuronStudio software. Open colored circles designate spine subtypes based on user-defined parameters in the software (see Materials and Methods). Bottom panel, Histograms showing the effects of CVS on mushroom, stubby, and thin spine density and mean spine head diameter. CVS resulted in a significant decrease in overall, >150 apical, and <150 μm basal categories of mushroom spine density in aBST-projecting PL neurons (FB+) compared with unlabeled PL counterparts (FB) and unstressed controls. Significant decreases in stubby spine densities were also evident in basal dendrites in FB+ cells compared with FB cells in the CVS and unstressed control group. *p < 0.05, differs significantly from unstressed controls; p < 0.05, differs significantly from unlabeled neurons in CVS-treated animals. Data are represented as mean ± SEM and based on animal averages for each index (i.e., n = 5 animals per group; n = 1–3 segments per neuron; n = 5 neurons per animal). Scale bar, 5 μm (applies to both images).
Figure 5.
Figure 5.
Top left, Example iontophoretically filled pyramidal neuron in vSUB (left) and the rendering of its dendritic tree (right) using computer-assisted morphometry. The apical dendritic tree is pointing upward and extends into the molecular layer, whereas the axon and basal dendrites radiate from the opposite pole of the cell body. The red dashed circle demarcates the 150 μm boundary used to partition the dendritic tree for spine analyses. Top right, Examples of deconvolved confocal laser-scanning microscopy images of dendritic segments from vSUB neurons as a function of treatment status. Neurons in vSUB appear to be insensitive to the effects of CVS, because no differences were found in any of the structural indices examined in the treatment groups (middle and bottom rows). Data are represented as mean ± SEM and are based on animal averages for each index (i.e., n = 5 animals per group; n = 1–3 segments per neuron; n = 5 neurons per animal). Scale bar: top left, middle images, 50 μm; three images in top right, 5 μm.
Figure 6.
Figure 6.
Dark-field photomicrographs (top) show representative examples of CRF mRNA expression in PVH as a function of treatment status. Middle right, Histogram showing mean ± SEM for relative levels of CRF mRNA expression in treatment groups. Restraint led to increases in CRF mRNA expression in PVH after 30 min restraint stress compared with unstressed control animals, whereas this effect was further enhanced after CVS exposure. *p < 0.05, differs significantly from the unstressed control group; p < 0.05, differs significantly from the acute stress group. n = 4–5 per group. Bottom row, Mean ± SEM plasma corticosterone (CORT) levels in control and CVS groups before (0 min) and at 30 min intervals after exposure to restraint (Restr.). Whereas stress significantly increased levels of plasma CORT in both treatment groups, CVS animals showed prolonged increases at 60 and 90 min based on within-group comparison with pre-stress levels and between-group measures at each of these time points (p < 0.05 for each). *p < 0.05, differs significantly from basal (0 min) values within each group; p < 0.05, differs significantly from acutely restrained animals. n = 6 per group.
Figure 7.
Figure 7.
Photomicrographs show representative examples of dual immunoperoxidase staining of FB and Fos (arrows) at high magnification in treatment groups (rows) in PL and vSUB (columns). Thirty minutes of restraint increased overall levels of Fos expression and colocalization for Fos and tracer in PL and vSUB. CVS-treated animals showed a marked reduction in dual labeling for Fos and FB in PL compared with previously unstressed animals in response to the restraint challenge, whereas overall Fos levels remained elevated in this cortical subfield. In contrast, no significant decrements in either Fos plus FB or Fos were noted in vSUB as a function of CVS treatment. Bottom, Histograms showing mean ± SEM for Fos plus FB (white bars) and Fos only (blue bars). Although PL showed decreases in dual colocalization for Fos and FB after CVS, Fos plus FB labeled cells in vSUB were not significantly different between acute and CVS groups. Contr, Control. *p < 0.05, differs significantly from unstressed controls; p < 0.05, differs significantly from the acute stress group. n = 4–5 per group.

Similar articles

Cited by

References

    1. Bailey CH, Kandel ER. Structural changes accompanying memory storage. Annu Rev Physiol. 1993;55:397–426. doi: 10.1146/annurev.ph.55.030193.002145. - DOI - PubMed
    1. Bentivoglio M, Kuypers HG, Catsman-Berrevoets CE, Loewe H, Dann O. Two new fluorescent retrograde neuronal tracers which are transported over long distances. Neurosci Lett. 1980;18:25–30. doi: 10.1016/0304-3940(80)90208-6. - DOI - PubMed
    1. Bhatnagar S, Dallman M. Neuroanatomical basis for facilitation of hypothalamic-pituitary-adrenal responses to a novel stressor after chronic stress. Neuroscience. 1998;84:1025–1039. doi: 10.1016/S0306-4522(97)00577-0. - DOI - PubMed
    1. Bhatnagar S, Huber R, Nowak N, Trotter P. Lesions of the posterior paraventricular thalamus block habituation of hypothalamic-pituitary-adrenal responses to repeated restraint. J Neuroendocrinol. 2002;14:403–410. doi: 10.1046/j.0007-1331.2002.00792.x. - DOI - PubMed
    1. Bloss EB, Janssen WG, Ohm DT, Yuk FJ, Wadsworth S, Saardi KM, McEwen BS, Morrison JH. Evidence for reduced experience-dependent dendritic spine plasticity in the aging prefrontal cortex. J Neurosci. 2011;31:7831–7839. doi: 10.1523/JNEUROSCI.0839-11.2011. - DOI - PMC - PubMed

Publication types

MeSH terms

LinkOut - more resources