. 2013 Sep 4;33(36):14417-30.
doi: 10.1523/JNEUROSCI.1236-13.2013.

Synaptotagmin interaction with SNAP-25 governs vesicle docking, priming, and fusion triggering

Affiliations

Synaptotagmin interaction with SNAP-25 governs vesicle docking, priming, and fusion triggering

Ralf Mohrmann et al. J Neurosci. .

Abstract

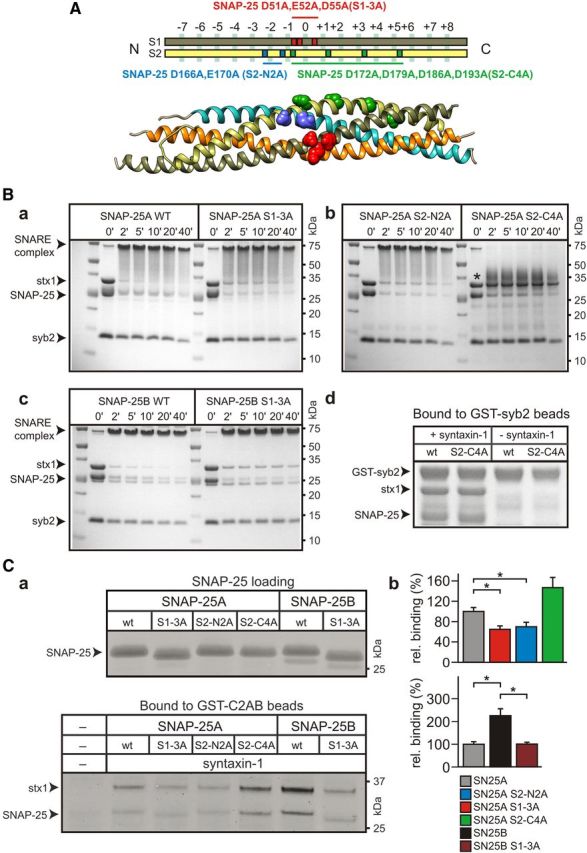
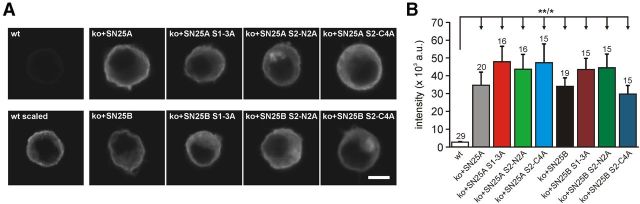
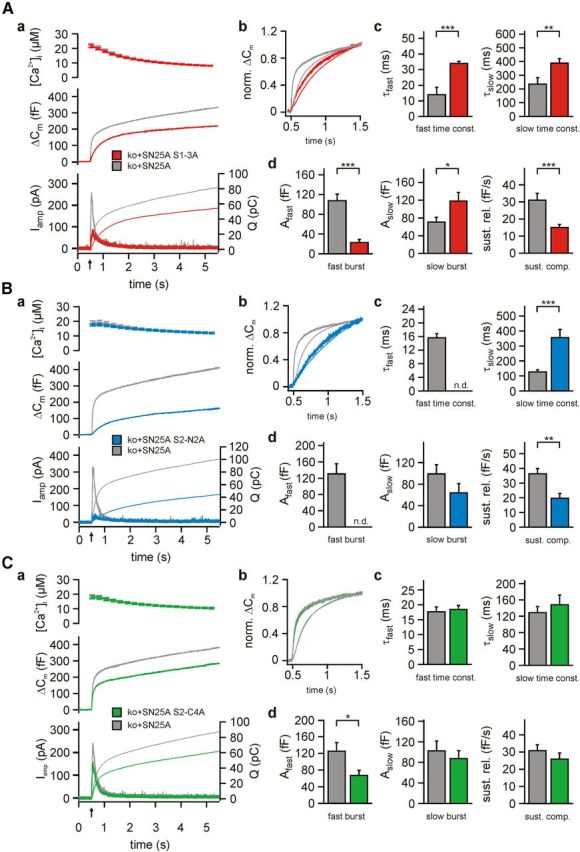
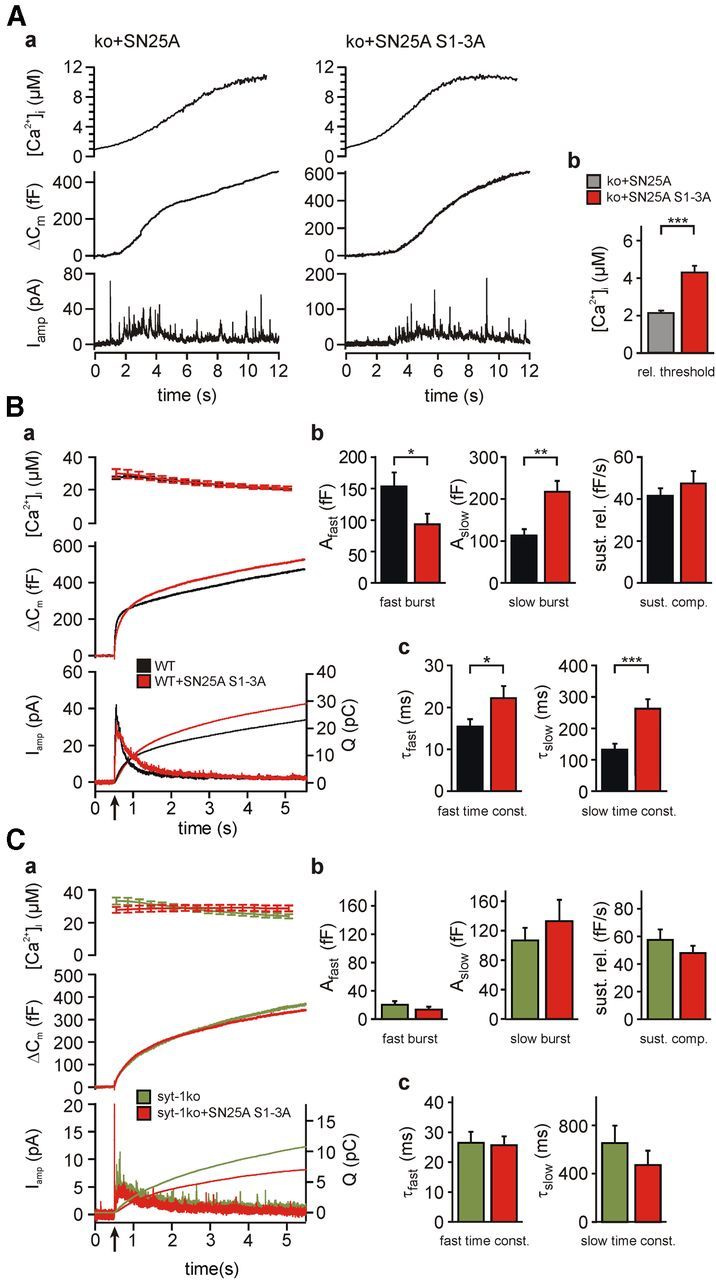
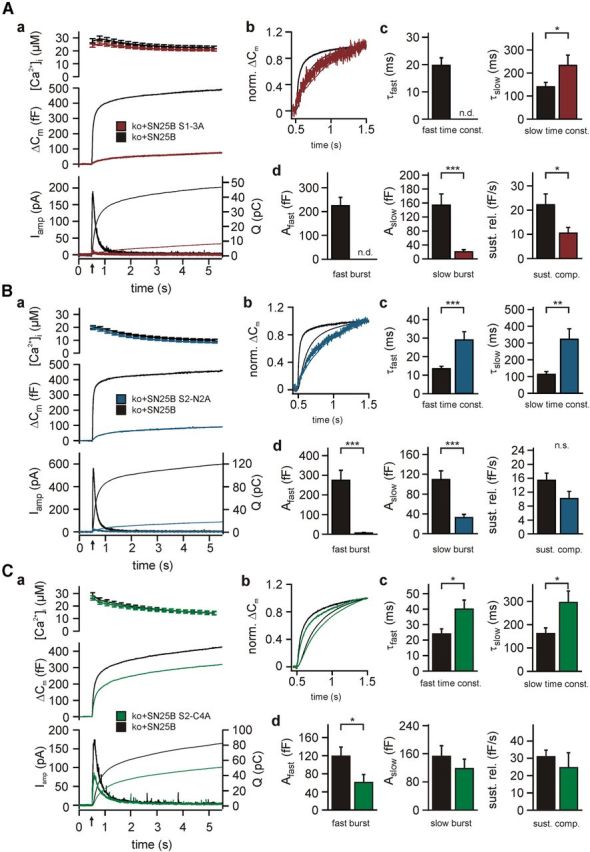
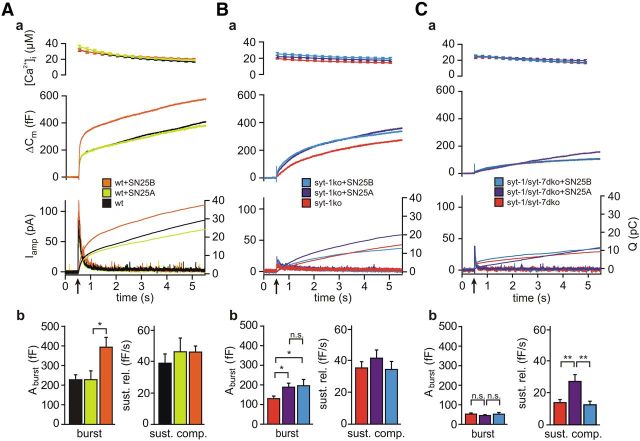
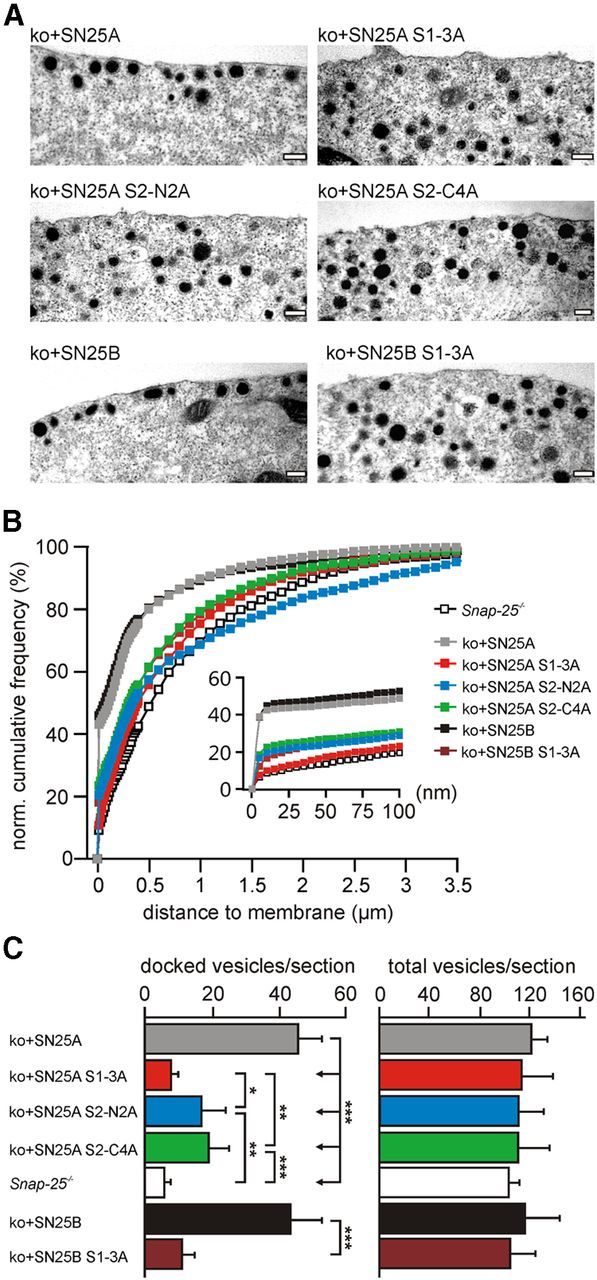
SNARE complex assembly constitutes a key step in exocytosis that is rendered Ca(2+)-dependent by interactions with synaptotagmin-1. Two putative sites for synaptotagmin binding have recently been identified in SNAP-25 using biochemical methods: one located around the center and another at the C-terminal end of the SNARE bundle. However, it is still unclear whether and how synaptotagmin-1 × SNARE interactions at these sites are involved in regulating fast neurotransmitter release. Here, we have used electrophysiological techniques with high time-resolution to directly investigate the mechanistic ramifications of proposed SNAP-25 × synaptotagmin-1 interaction in mouse chromaffin cells. We demonstrate that the postulated central binding domain surrounding layer zero covers both SNARE motifs of SNAP-25 and is essential for vesicle docking, priming, and fast fusion-triggering. Mutation of this site caused no further functional alterations in synaptotagmin-1-deficient cells, indicating that the central acidic patch indeed constitutes a mechanistically relevant synaptotagmin-1 interaction site. Moreover, our data show that the C-terminal binding interface only plays a subsidiary role in triggering but is required for the full size of the readily releasable pool. Intriguingly, we also found that mutation of synaptotagmin-1 interaction sites led to more pronounced phenotypes in the context of the adult neuronal isoform SNAP-25B than in the embryonic isoform SNAP-25A. Further experiments demonstrated that stronger synaptotagmin-1 × SNAP-25B interactions allow for the larger primed vesicle pool supported by SNAP-25 isoform B. Thus, synaptotagmin-1 × SNARE interactions are not only required for multiple mechanistic steps en route to fusion but also underlie the developmental control of the releasable vesicle pool.


Figures

Figure 1.
Figure 1.
Syt-1 binding of t-SNARE dimers containing SNAP-25A/B and mutants. A, Localization of the different groups of acidic residues mutated in this study: S1–3A (SNARE helix 1 D51A, E52A, E55A) shown in red, S2–N2A (SNARE helix 2 D166A, E170A) in blue, and S2–C4A (D172A, D179A, D186A, D193A) in green. S1 of SNAP-25 is displayed in olive green, and S2 in yellow. Bottom, Crystal structure of the SNARE complex (PDB ID: 1SFC) (Sutton et al., 1998), rendered with UCSF Chimera 1.7, highlighting the mutated residues. B, Formation of the ternary SNARE complex. SNAP25 proteins were incubated with syntaxin-1A (stx1) and fivefold excess of VAMP-2 (syb2) for indicated times, and subsequently complex assembly was stopped by the addition of SDS. The complexes were visualized in Coomassie-stained SDS-PAGE gels. Low levels of syntaxin dimers caused faint bands at 75 kDa in all samples at zero incubation time (0′). In the case of SN25A S1–3A (Ba), SN25A S2–N2A (Bb), and SN25B S1–3A (Bc), SNARE complex formation did not exhibit major differences compared with the corresponding SNAP-25 wild-type (WT) isoforms. For SN25A S2–C4A (Bb), SNARE complex exhibited markedly different physicochemical properties and ran as a “smear” just above the syntaxin band (*). When tested in a GST-syb2 pull-down assay, SN25A S2–C4A supported syntaxin-dependent complex formation as well as the wild-type SNAP-25A protein (Bd). C, Normalized mutant and wild-type SNAP-25 protein (Ca; loading control in top) was incubated with brain-purified syntaxin-1A to allow for formation of t-SNARE dimers, which were then incubated in a threefold molar excess with Sepharose-immobilized GST-syt-1C2AB for 30 min. Bound protein was analyzed by SDS-PAGE followed by Sypro Ruby quantitative protein staining (Ca; bottom). Cb, Quantification by densitometry. There is a pronounced binding of SNAP-25B-containing dimers to GST-syt-1C2AB. Binding data are shown as a percentage of maximum binding relative to wild-type SNAP-25A. Error bars indicate SEM (n = 3 each). Pairwise comparisons (Student's t test, paired, two-tailed) were made between wild-type SNAP-25A and SNAP-25B, or between the wild-type protein and its corresponding mutants. *p < 0.05.
Figure 2.
Figure 2.
Analysis of virally driven SNAP-25 expression. A, Example microphotographs of chromaffin cells stained against SNAP-25. To test expression levels, Snap-25−/− cells were infected with Semliki Forest viruses and stained 5–6 h after infection. Displayed images represent single confocal slices acquired near the midline of the cell body in z-dimension. Endogenous SNAP-25 expression in wild-type control cells (leftmost column) was on average 15 times lower than virally expressed levels; the image of the wild-type cells was accordingly scaled to demonstrate the native distribution pattern of SNAP-25. Scale bar, 5 μm. B, Quantification of total SNAP-25 immunofluorescence intensity (per cell). Intensity throughout all confocal slices was summed up in a region of interest enclosing the whole-cell body. Total intensity was corrected for background fluorescence using an identically shaped, blank region as reference. Immunofluorescence in wild-type cells and infected cells was compared using ANOVA and Dunnett test, yielding p < 0.01 for all comparisons, except wild-type versus SN25B S2-C4A, which resulted in p < 0.05. The number of analyzed cells is indicated above each bar. Error bars indicate SEM. *p < 0.05. **p < 0.01.
Figure 3.
Figure 3.
Comparative functional characterization of secretion properties in cells expressing SN25A S1–3A, SN25A S2-N2A, or SN25A S2-C4A. A, Electrophysiological measurement of secretion in Snap-25−/− chromaffin cells expressing SN25A S1–3A. Aa, Averaged traces of [Ca2+]i (top), capacitance measurements (middle), and amperometric recordings (bottom) in Snap-25−/− cells expressing either wild-type protein (gray; n = 28) or SN25A S1–3A (red; n = 30). Uncaging flash was applied at 0.5 s (arrow). Ab, Averaged capacitance changes (bold lines) and amperometric charge traces (thin lines) were normalized to their respective values 1 s after the uncaging flash to compare the kinetics of burst release. Ac, Ad, For the burst release component, mean values for release amplitudes Afast and Aslow as well as the corresponding time constants τfast and τslow are shown. Further, the mean release rate for the linear, sustained component of secretion is shown (lower right). B, Characterization of secretion in Snap-25−/− chromaffin cells expressing SN25A S2-N2A (blue, n = 25; control: gray, n = 28). Panel organization as in A. There is a more prominent decrease in burst release compared with SN25A S1–3A. C, Secretion properties of Snap-25−/− cells expressing either wild-type protein (gray; n = 32) or SN25A S2-C4A (green; n = 26). Panel organization as in A. No alterations in time constants could be observed, but the fast burst component was significantly reduced. Error bars indicate SEM. Statistical comparisons were done using Student's t test (unpaired, two-tailed). *p < 0.05. **p < 0.01. ***p < 0.001. n.d., not detectable.
Figure 4.
Figure 4.
Extended functional characterization of SNAP-25 S1–3A variants. Aa, Expression of SN25A S1–3A increased the Ca2+-threshold of release. A prolonged train of weak light flashes was applied to cells loaded with a calcium cage, generating a slow increase in [Ca2+]i (top). Release was studied by capacitance measurements and amperometric recordings to determine the threshold Ca2+ level that induces a steep increase in secretion (middle, bottom). Ab, Quantification of Ca2+-ramp experiments (ko+SNAP-25A, n = 21; ko+SN25A S1–3A, n = 17). B, Overexpression of SN25A S1–3A in wild-type cells slows down secretion. Ba, Averaged traces of [Ca2+]i (top), capacitance measurements (middle), and amperometric recordings (bottom) in uninfected wild-type cells (black, n = 20) or wild-type cells expressing additional SN25A S1–3A (red; n = 21). Bb, Bc, Quantitative analysis demonstrates functional alterations similar to the rescue phenotype (compare Fig. 3A), albeit without a reduction in total release. C, Analysis of the secretion properties of syt-1−/− cells overexpressing SN25A S1–3A (red, n = 22) compared with uninfected syt-1−/− cells (green, n = 22). Depicted are the intracellular Ca2+ elevation (top), the average capacitance change (middle), and amperometry (bottom). Cb, Cc, Kinetic analysis confirmed the absence of kinetic changes upon SN25A S1–3A overexpression. Error bars indicate SEM. Statistical comparisons were done using Student's t test (unpaired, two-tailed). *p < 0.05. **p < 0.01. ***p < 0.001.
Figure 5.
Figure 5.
Isoform-specific alterations of phenotypes in the context of the SNAP-25B isoform. A, Electrophysiological characterization of secretion in Snap-25−/− chromaffin cells expressing SN25B S1–3A. Aa, Averaged traces of [Ca2+]i (top), capacitance measurements (middle), and amperometric recordings (bottom) in Snap-25−/− cells expressing either wild-type protein (black; n = 32) or SN25B S1–3A (dark red, n = 30). Ab, Averaged capacitance changes (bold lines) and amperometric charge traces (thin lines) were normalized to their respective values at 1 s after the flash for a kinetic comparison of burst release. Ac, Ad, Kinetic analysis presenting the mean amplitudes and time constants, as well as the average rate of sustained release. There is a dramatic loss of total release compared with the moderate phenotype of the SN25A S1–3A variant. B, Electrophysiological characterization of secretion in Snap-25−/− cells expressing SN25B S2-N2A (dark blue, n = 27; control: black, n = 21). Panel organization as in A. This mutant variant largely exhibited the same phenotypic features as SN25A S2-N2A. C, Analysis of secretion in SN25B S2-C4A-expressing cells (dark green, n = 31; control: black, n = 27). Panel organization as in A. There is a significant slowdown of secretion indicated by the increase of both time constants and a decrease in Afast, which suggest an isoform-specific effect on fusion triggering. Error bars indicate SEM. Statistical comparisons were done using Student's t test (unpaired, two-tailed). *p < 0.05. **p < 0.01. ***p < 0.001. n.s., Not significant; n.d., not detectable.
Figure 6.
Figure 6.
Syt-1 interactions are essential for maintenance of an expanded primed vesicle pool in SNAP-25B-expressing cells. A, Functional analysis of secretion in uninfected wild-type cells (black, n = 14) and cells overexpressing SNAP-25A (yellow, n = 13) or SNAP-25B (orange, n = 14). Aa, Averaged traces of [Ca2+]i (top), capacitance traces (middle), amperometric currents, and cumulative charge (bottom) after uncaging flash (arrow). Ab, Secretion measured 0–1 s after uncaging (burst) and 1–5 s after uncaging (sustained) was quantified and compared. Only SNAP-25B overexpression caused an increase in burst release. B, Analysis of the effects of SNAP-25A (purple, n = 17) and SNAP-25B (blue, n = 18) overexpression in syt-1−/− cells (uninfected, red, n = 18). Isoform-specific alterations of secretion were abolished, but burst size was slightly increased. C, Characterization of secretion in syt-1−/−; syt-7−/− chromaffin cells (uninfected, red, n = 23) either overexpressing SNAP-25A (purple, n = 23) or SNAP-25B (blue, n = 24). Error bars indicate SEM. Statistical comparisons were done using Student's t test (unpaired, two-tailed). *p < 0.05. **p < 0.01. n.s., not significant.
Figure 7.
Figure 7.
Mutant SNAP-25 variants do not restore docking of secretory granules in Snap-25−/− chromaffin cells. A, Electron micrographs of Snap-25−/− chromaffin cells expressing syt-1-binding mutants. Scale bar, 200 nm. B, Normalized cumulative vesicle distribution as a function of distance to the plasma membrane. Inset, The cumulative vesicle distribution in a membrane-proximal region of 0–100 nm. C, For each section, the number of docked vesicles and the total vesicle number were quantified. Vesicles were considered “docked” if there was no detectable separation from the plasma membrane. For each condition, 20 infected Snap-25−/− cells were analyzed in a blind fashion; 12 uninfected cells were used as controls. Error bars indicate SEM. Data were statistically compared using ANOVA and post hoc test (Tukey-Kramer). *p < 0.05. **p < 0.01. ***p < 0.001.

Similar articles

Cited by

References

    1. Araç D, Chen X, Khant HA, Ubach J, Ludtke SJ, Kikkawa M, Johnson AE, Chiu W, Südhof TC, Rizo J. Close membrane-membrane proximity induced by Ca(2+)-dependent multivalent binding of synaptotagmin-1 to phospholipids. Nat Struct Mol Biol. 2006;13:209–217. doi: 10.1038/nsmb1056. - DOI - PubMed
    1. Bai J, Tucker WC, Chapman ER. PIP2 increases the speed of response of synaptotagmin and steers its membrane-penetration activity toward the plasma membrane. Nat Struct Mol Biol. 2004a;11:36–44. doi: 10.1038/nsmb709. - DOI - PubMed
    1. Bai J, Wang CT, Richards DA, Jackson MB, Chapman ER. Fusion pore dynamics are regulated by synaptotagmin × t-SNARE interactions. Neuron. 2004b;41:929–942. doi: 10.1016/S0896-6273(04)00117-5. - DOI - PubMed
    1. Bark IC, Wilson MC. Human cDNA clones encoding two different isoforms of the nerve terminal protein SNAP-25. Gene. 1994;139:291–292. doi: 10.1016/0378-1119(94)90773-0. - DOI - PubMed
    1. Bark IC, Hahn KM, Ryabinin AE, Wilson MC. Differential expression of SNAP-25 protein isoforms during divergent vesicle fusion events of neural development. Proc Natl Acad Sci U S A. 1995;92:1510–1514. doi: 10.1073/pnas.92.5.1510. - DOI - PMC - PubMed

Publication types

MeSH terms

LinkOut - more resources