. 2013 Sep 4;33(36):14455-65.
doi: 10.1523/JNEUROSCI.1162-13.2013.

Dorsal parietal area 5 encodes immediate reach in sequential arm movements

Affiliations

Dorsal parietal area 5 encodes immediate reach in sequential arm movements

Yuhui Li et al. J Neurosci. .

Abstract

To generate a coherent action sequence, it is essential to integrate all component movements beforehand, and such sequence-related information has been observed in numerous brain regions. However, this high-level sequential plan encompassing multiple motor elements in parallel ultimately must be decomposed into serial motor commands to be executed by the musculoskeletal system. In the present study, we recorded single-neuron activity from dorsal parietal area 5 (area 5d) while monkeys performed a double-reach task, and found that area 5d conveys the immediate upcoming reach, but not the subsequent movement, as opposed to the entire movement sequence being encoded as in other cortical sensorimotor areas. The elementary movement coded in area 5d suggests that unfolding of the motor sequence begins in the parietal-frontal cortex, instead of being exclusively implemented by downstream subcortical and spinal circuits.


Figures
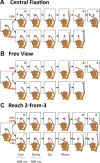
Figure 1.
Figure 1.
Behavioral tasks. A, The main task: interleaved double- (top) and single-reach (bottom) trials in which the monkeys were required to maintain the central fixation throughout each trial. B, Free-view condition: monkeys performed the same arm movements as in Figure 1A but were allowed to look anywhere. C, Reach 2-from-3 condition: three targets (a square, a triangle, and a circle) were simultaneously presented at three peripheral locations spaced 120° apart, and the monkey was trained to reach the square and triangle in correct order. The second target (triangle) could be either +120° or −120° to the first target (square). The peripheral circle was presented as distracter in a half the trials, but absent in the other half.
Figure 2.
Figure 2.
Temporal profile of area 5d cells. Each colored line indicates one cell's normalized mean firing rate across all trials in single (A) and double (B) reaches. The cells are sorted by time of the peak firing rate in single-reach trials, while the activity is aligned to the GO signal and reach onset in A and the GO signal, first reach onset, and second reach onset in B.
Figure 3.
Figure 3.
Three typical area 5d cells. Blue and red indicate results from single-reach trials and double-reach trials, respectively. Each panel presents activity during one single reach (blue) and one double reach (red) for the reach directions indicated by arrows on the left. Each raster shows spike train in each single- (blue) and double-reach (red) trials. The black, green, and cyan dots mark the GO signal time, the first movement onset, and the second movement onset, respectively. The curves are PSTHs, smoothed using a Gaussian kernel (SD = 50 ms).
Figure 4.
Figure 4.
Population activity of area 5d cells. Top, Firing rate averaged across the 33 cells with significant directional tuning during the delay period (400 ms before GO), aligned to the GO signal. Middle, Bottom, The mean firing rates for the 87 premovement cells and 72 perimovement cells, respectively, both aligning to the first movement onset. Each panel plots the population activity for Single-In (blue thick line), Single-Out (blue thin line), Inside-Out (red thick line), and Outside-In (red thin line) conditions.
Figure 5.
Figure 5.
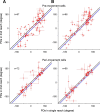
PD in single-reach trials versus that of the first movement in double-reach trials. Scatter plots comparing the PDs of single- and double-reach trials in delay, premovement, and perimovement periods, respectively. The length of the bar on each circle represents the SE estimated with bootstrap method (n = 5000). The data points in all three plots are scattered along the unity line, indicating that PDs of area 5d neurons before the first reach were not systematically modulated by the second movement.
Figure 6.
Figure 6.
Three typical area 5d cells recorded in free-view condition. Same conventions as Figure 3.
Figure 7.
Figure 7.
Population activity of area 5d cells recorded in the free-view condition (A) and reach-2-from-3 condition (B). Top, Firing rate averaged across the cells with significant directional tuning during the delay period, aligned to the GO signal. Middle, Bottom, The mean firing rates for the premovement cells and perimovement cells, respectively, both aligning to the first movement onset. Each panel plots the population activity for Single-In (blue thick line), Single-Out (blue thin line), counter-clockwise (CCW), Inside-Out (red thick line), CCW Outside-In (red thin line), clockwise (CW) Inside-Out (green thick line), and CW Outside-In (green thin line) conditions.
Figure 8.
Figure 8.
PDs in single-reach trials versus those of the first movement in double-reach trials for area 5d cells recorded in the free-view condition (A) and Reach-2-from-3 condition (B). Scatter plots comparing the PDs of single- and double-reach trials in delay, premovement, and perimovement periods, respectively. The red dots indicate that the second target was CCW to the first target, while the green dots represent CW displacement. The length of the bar on each circle represents the SE.
Figure 9.
Figure 9.
Time series of population vectors. A, Population vector decoded from cells sampled from monkey A and P in single- (blue) and double-reaches (red) under the central-fixation condition (Fig. 1A). B, Population vector decoded from cells sampled from monkey A and P in single (blue) and double-reaches (red) under the free-view condition (Fig. 1B). C, Population vector decoded from cells sampled from monkey A in single (blue), CW double- (green), and CCW double-reaches (red) in the reach 2-from-3 condition (Fig. 1C).
Figure 10.
Figure 10.
Comparison of activity of four representative area 5d cells between single-reach trials and the second movement during double-reach trials. As in Figures 3 and 6, blue and red indicate results from single- and double-reach trials, respectively. The black and green dots mark the GO signal and the first movement onset, respectively. However, in contrast to those figures, each panel presents activity for one single-reach (blue) and one double-reach (red) condition with movement directions indicated by arrows on the left, so that movements aimed the same location are compared, instead of those launched along the same direction. In addition, spike rasters in double-reach trials (red) were aligned to the second movement onset. Because there was no delay period for the second reach, only four cells with pre- and perimovement tuning (Cells 2 and 3 from Fig. 3, and Cells 5 and 6 from Fig. 6) are shown here.
Figure 11.
Figure 11.
Comparison of population activity of area 5d cells between single-reach trials and the second movement of double-reach trials in the central fixation (A) and free-view conditions (B). Top, Bottom, Mean firing rates for the premovement and perimovement cells, respectively. Each panel plots the population activity for Single-In (blue thick line), Single-Out (blue thin line), Inside-Out (red thick line), and Outside-In (red thin line) conditions. Unlike Figures 4 and 7, the activity curves for the double-reach trials are aligned to the second movement onset.
Figure 12.
Figure 12.
PDs in single-reach trials versus those of the second movement during double-reach trials in the central fixation (A) and free-view condition (B). Top, Bottom, Scatter plots comparing the PDs of single reaches and second movements in double-reach trials in premovement and perimovement periods, respectively, calculated based on the direction of the movement goal relative to the center. The length of the bars on each circle represents SEs, estimated with a bootstrap method (n = 5000). The black and blue diagonal lines indicate the 0° and 22.5° differences between the PDs for second reach and single reaches. The scattered points are not significantly shifted from the black (unity) line (p > 0.1, circular t test), whereas, with the exception of A (p > 0.1), they are significantly shifted above the blue line (p < 0.01).

Similar articles

Cited by

References

    1. Alstermark B, Isa T. Circuits for skilled reaching and grasping. Annu Rev Neurosci. 2012;35:559–578. doi: 10.1146/annurev-neuro-062111-150527. - DOI - PubMed
    1. Archambault PS, Caminiti R, Battaglia-Mayer A. Cortical mechanisms for online control of hand movement trajectory: the role of the posterior parietal cortex. Cereb Cortex. 2009;19:2848–2864. doi: 10.1093/cercor/bhp058. - DOI - PubMed
    1. Ashe J, Georgopoulos AP. Movement parameters and neural activity in motor cortex and area 5. Cereb Cortex. 1994;4:590–600. doi: 10.1093/cercor/4.6.590. - DOI - PubMed
    1. Ashe J, Taira M, Smyrnis N, Pellizzer G, Georgakopoulos T, Lurito JT, Georgopoulos AP. Motor cortical activity preceding a memorized movement trajectory with an orthogonal bend. Exp Brain Res. 1993;95:118–130. - PubMed
    1. Averbeck BB, Chafee MV, Crowe DA, Georgopoulos AP. Parietal representation of hand velocity in a copy task. J Neurophysiol. 2005;93:508–518. - PubMed

Publication types

LinkOut - more resources