. 2013 Sep 4;33(36):14475-88.
doi: 10.1523/JNEUROSCI.0710-13.2013.

Neural representation of a target auditory memory in a cortico-basal ganglia pathway

Affiliations

Neural representation of a target auditory memory in a cortico-basal ganglia pathway

Jennifer M Achiro et al. J Neurosci. .

Abstract

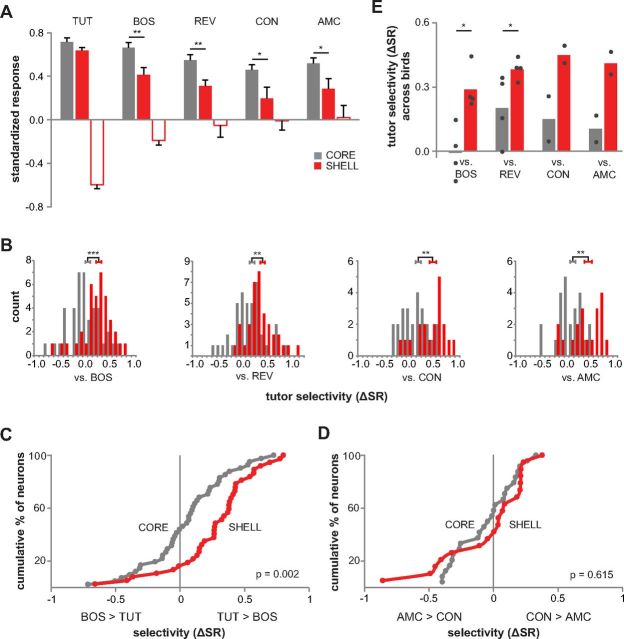
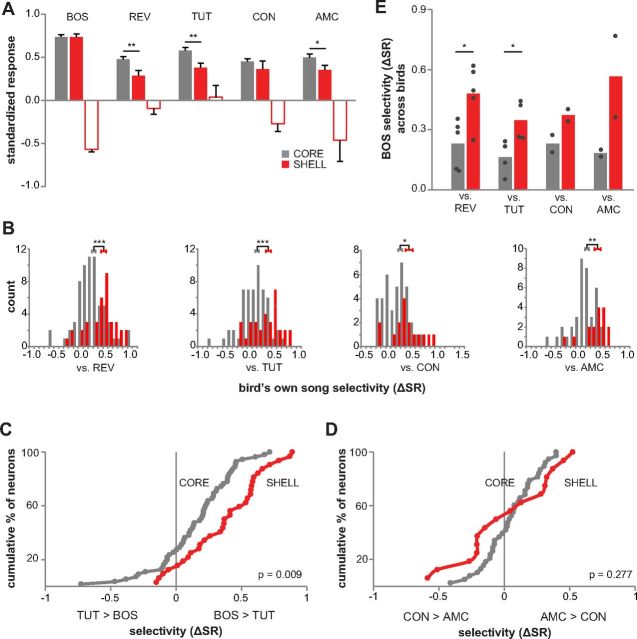
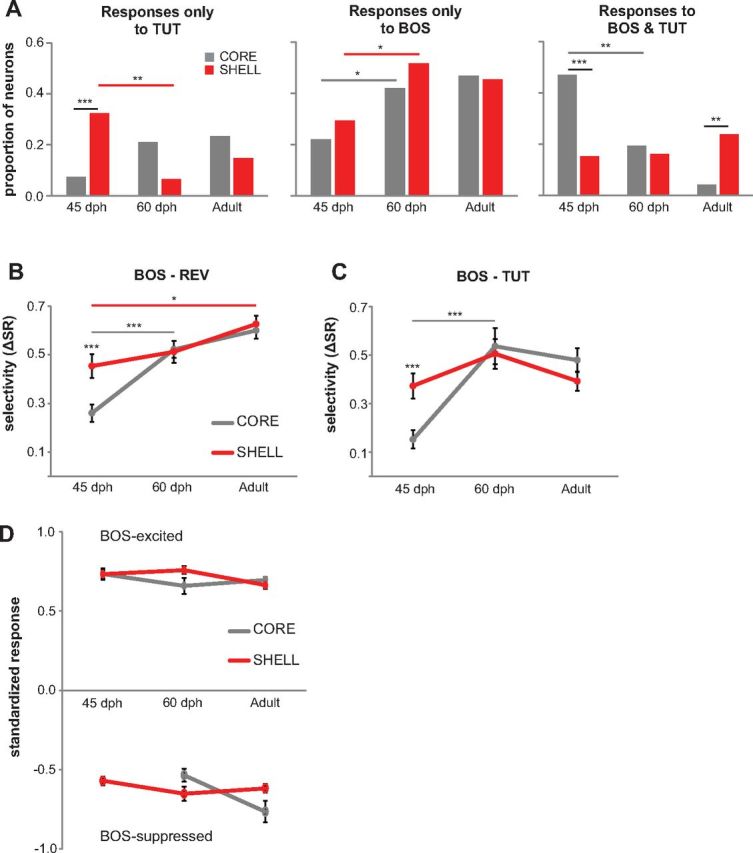
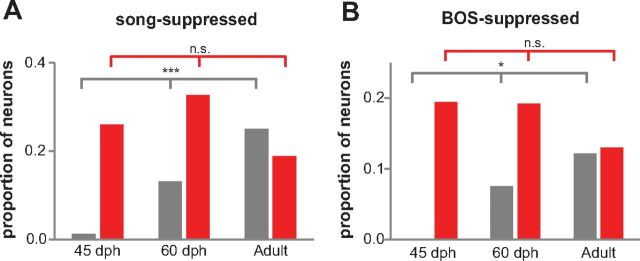
Vocal learning in songbirds, like speech acquisition in humans, entails a period of sensorimotor integration during which vocalizations are evaluated via auditory feedback and progressively refined to achieve an imitation of memorized vocal sounds. This process requires the brain to compare feedback of current vocal behavior to a memory of target vocal sounds. We report the discovery of two distinct populations of neurons in a cortico-basal ganglia circuit of juvenile songbirds (zebra finches, Taeniopygia guttata) during vocal learning: (1) one in which neurons are selectively tuned to memorized sounds and (2) another in which neurons are selectively tuned to self-produced vocalizations. These results suggest that neurons tuned to learned vocal sounds encode a memory of those target sounds, whereas neurons tuned to self-produced vocalizations encode a representation of current vocal sounds. The presence of neurons tuned to memorized sounds is limited to early stages of sensorimotor integration: after learning, the incidence of neurons encoding memorized vocal sounds was greatly diminished. In contrast to this circuit, neurons known to drive vocal behavior through a parallel cortico-basal ganglia pathway show little selective tuning until late in learning. One interpretation of these data is that representations of current and target vocal sounds in the shell circuit are used to compare ongoing patterns of vocal feedback to memorized sounds, whereas the parallel core circuit has a motor-related role in learning. Such a functional subdivision is similar to mammalian cortico-basal ganglia pathways in which associative-limbic circuits mediate goal-directed responses, whereas sensorimotor circuits support motor aspects of learning.


Figures

Figure 1.
Figure 1.
Parallel cortico-basal ganglia pathways in songbirds. A, Parallel circuits are formed by the axonal connections of core (gray) and shell (red) regions of LMAN. These parallel projections form recurrent loops through both the basal ganglia (Area X, a nucleus containing both striatal and pallidal neurons) and through other cortical regions: RA (robust nucleus of arcopallium) and AId (dorsal intermediate arcopallium), which are located in the analog of mammalian motor cortex. AId was referred to as Ad (dorsal arcopallium) in previous papers from our laboratory, but we have changed the terminology here to conform to the nomenclature suggested by Reiner et al. (2004). Core and shell regions of LMAN receive input from separate subgroups of neurons in the thalamic nucleus DLM (dorsolateral medial thalamus; VM, ventromedial; DL, dorsolateral). B, Anterograde label in coronal sections of RA and AId after iontophoretic injections of biotinylated dextran amine into LMANcore. Individual core neurons send axons exclusively into RA in adult birds but send numerous collateral branches into AId in juvenile (35 dph) birds (Miller-Sims and Bottjer, 2012) (dorsal is up, medial is left; scale bar, 0.5 mm). Thus, LMANcore neurons make a robust transient projection into the shell pathway during sensorimotor integration that is completely gone by adulthood.
Figure 2.
Figure 2.
Histological and electrophysiological methods used. A, Photomicrograph of LMAN core and shell (50-μm-thick coronal sections; medial is right). The borders of the core region can be clearly distinguished in Nissl-stained tissue (left). Core is outlined with dashed line and asterisks indicate fiduciary lesions. Different subgroups of thalamic projection neurons (from DLM; Fig. 1A) terminate in either LMANcore or LMANshell, but all DLM axons express calbindin in a highly selective manner (Pinaud et al., 2007). Therefore, calbindin staining encompasses both core and shell regions, and the terminal field demarcates the outer border of LMANshell (right, dark staining; dashed line is copy of core outline to illustrate location of core). Scale bar, 300 μm. B, C, Example multiunit recording with clustered spike waveforms from LMANshell of 43 dph bird. B, Inset at top left shows raw voltage signal of multiunit recording made with a Carbostar electrode; black box indicates expanded portion shown to right. LMAN neurons have relatively low firing rates, and therefore ambivalent waveform shapes attributable to overlapping spikes were rare. The graph shows a plot of energy versus rising slope of raw waveforms (no corrections applied) from the recording site shown in inset. This plot shows that raw spike shapes form distinct clusters even when based on only two features. C, Waveforms were automatically clustered based on six waveform features using KlustaKwik (Ken Harris, Rutgers University; see Materials and Methods). The resulting clusters for this recording are shown in different colors (gray cluster did not meet signal/noise criterion); overlaid waveforms of each unit are shown near the plotted cluster. After clustering, each unit was tested to determine whether the firing rate during the presentation of any stimulus was significantly greater or less than the firing rate during baseline; each unit is labeled with its corresponding response pattern.
Figure 3.
Figure 3.
A population of neurons in LMANshell of 45 dph birds responds only to tutor song. A, Among all neurons that were tested with playback of BOS, REV, and TUT: absolute proportions of neurons that responded to BOS only, TUT only, or both BOS and TUT in LMANcore (gray; n = 68) and LMANshell (red; n = 65). For this analysis, “BOS only” included neurons that showed a significant response to BOS and not to REV or TUT (see Materials and Methods), “TUT only” included neurons that responded only to TUT and not to BOS or REV, and “BOS & TUT” includes neurons that responded to both BOS and TUT (regardless of whether there was a response to REV). Shell neurons in all three response categories include cells that showed either rate increases or decreases (see Results); analysis conducted on only excited neurons yielded highly similar results (data not shown). ***p ≤ 0.001. B, Among all shell neurons included in A, proportions of neurons that were either excited (filled bars) or suppressed (open bars) by BOS only or TUT only. C, Among all neurons included in A, mean proportion of neurons averaged across each bird that responded to BOS only, TUT only, or both stimuli in LMANcore (gray) and LMANshell (red). Data from individual birds are plotted as dots (n = 4 birds; not included are data from one bird that did not receive the TUT stimulus and from one bird from which we recorded one BOS/TUT-responsive neuron). The mean proportion of TUT-only neurons per bird was higher in shell than in core (p = 0.019, Mann–Whitney test), and the mean proportion of BOS & TUT neurons per bird was higher in core than in shell (p = 0.021, Mann–Whitney test). *p < 0.05. These data show that the differences between core and shell computed across individual birds were also significant and match those computed across neurons.
Figure 4.
Figure 4.
Neurons responsive to the tutor song in 45 dph LMANshell and LMANcore. A, Recording from LMANshell. Top, Song spectrograms of a 45 dph bird's TUT, BOS, and REV. Below are raster plots and instantaneous firing rates for a TUT-excited single unit; overlaid waveforms are shown in inset (see Materials and Methods and Fig. 2B,C for recording and spike sorting details). Scale bar, 0.5 ms. * indicates response significantly different from baseline activity. B, Recording from LMANcore of 43 dph bird, arranged as in A showing responses to TUT, BOS, and REV. C, Recording from LMANshell of 45 dph bird showing a TUT-suppressed single unit, arranged as in A and B showing responses to TUT, BOS, and AMC.
Figure 5.
Figure 5.
Neurons responsive to the bird's own song in 45 dph LMANshell and LMANcore. A, Recording from LMANshell. Top, Song spectrograms of a 45 dph BOS, its TUT, and an AMC. Below are raster plots and instantaneous firing rates for a BOS-excited single unit from this recording site; overlaid waveforms are shown in inset. Scale bar, 0.5 ms. * indicates a response that is significantly different from baseline activity. B, Recording from LMANcore of 43 dph bird, arranged as in A showing responses to BOS, REV, and TUT.
Figure 6.
Figure 6.
Response strength and selectivity across all TUT-responsive neurons in LMANshell and LMANcore of 45 dph birds. TUT-responsive neurons include all those that showed a significant response to TUT (either alone or in combination with other song stimuli, includes both TUT-excited and TUT-suppressed neurons). A, SRs for TUT-responsive neurons in core and shell to TUT, BOS, REV, adult CON, and AMC. Filled bars show mean response of neurons that were excited by TUT (core, n = 41 for TUT, BOS, and REV and n = 24 for CON and AMC; shell, n = 28 for TUT, BOS, and REV and n =12 for CON and AMC), and open bars show mean response of neurons that were suppressed by TUT (core, n = 0; shell, n = 9 for TUT, BOS, and REV and n = 7 for CON and AMC). Error bars indicate SEM. *p < 0.05, **p < 0.01, and ***p < 0.001. B, Histograms showing distributions of selectivity (ΔSR) scores for TUT versus other songs (excited and suppressed responses combined) in core and shell (core, n = 41 vs BOS and REV, n = 24 vs CON and AMC; shell, n = 37 vs BOS and REV, n = 19 vs CON and AMC). The sign of selectivity scores for suppressed neurons is reversed. Error bars are centered on mean values and indicate SEM. C, D, Cumulative distributions of TUT–BOS ΔSR scores (core, n = 41; shell, n = 37) and of CON–AMC ΔSR scores (core, n = 24; shell, n = 19); p values shown are from Kolmogorov–Smirnov Z tests for difference between the distributions. E, TUT selectivity averaged across birds to compare with means averaged across neurons (B). Bars show mean selectivity for TUT over other songs across birds in core (gray) and shell (red). Data for individual birds are plotted as dots. Mean selectivity scores per bird were higher in shell than in core for comparisons with both BOS and REV (p = 0.02 and 0.04, respectively, Mann–Whitney test; n = 5 birds vs BOS and vs REV, one bird had recordings only in core and one bird had recordings only in shell; not included are data from one bird that did not receive the TUT stimulus; n = 2 birds vs CON and vs AMC). These data show that mean values do not differ, regardless of whether values are computed based on means of individual birds or across all neurons.
Figure 7.
Figure 7.
Response strength and selectivity across all BOS-responsive neurons in LMANshell and LMANcore of 45 dph birds. A, SRs for BOS-responsive neurons in core and shell to BOS, REV, TUT, adult CON, and AMC. Filled bars show mean response of neurons that were excited by BOS (core, n = 65 for BOS and REV, n = 55 for TUT, n =38 for CON and AMC; shell, n = 29 for BOS, REV, and TUT, n = 14 for CON and AMC), and open bars show mean response of neurons that were suppressed by BOS (core, n = 0; shell, n = 7 for BOS and REV, n = 3 for TUT, n = 2 for CON and AMC). Error bars indicate SEM. *p < 0.05, **p < 0.01, and ***p < 0.001. B, Histograms showing distributions of selectivity (ΔSR) scores for BOS over other songs (excited and suppressed responses combined) in core and shell (core, n = 65 vs REV, n = 55 vs TUT, n = 38 vs CON and AMC; shell, n = 36 vs REV, n = 32 vs TUT, n = 16 vs CON and AMC). The sign of selectivity scores for suppressed neurons is reversed. Error bars are centered on mean values and indicate SEM. C, D, Cumulative distributions of BOS–TUT ΔSR scores (core, n = 55; shell, n = 32) and AMC–CON ΔSR scores (core, n = 38; shell, n = 16). p values shown are from Kolmogorov–Smirnov Z tests for difference between the distributions. E, BOS selectivity averaged across birds to compare with means averaged across neurons (B). Bars show mean selectivity for BOS over other songs across birds in core (gray) and shell (red). Data for individual birds are plotted as dots. Mean selectivity scores per bird were higher in shell than in core for comparisons with both REV and TUT (p = 0.047 and 0.020, respectively, Mann–Whitney test; n = 6 birds vs REV, one bird had recordings only in core and one bird had recordings only in shell; n = 5 birds vs TUT, not included are data from one bird that did not receive the TUT stimulus; n = 2 birds vs CON and vs AMC). These data show that mean values do not differ, regardless of whether values are computed based on means of individual birds or across all neurons.
Figure 8.
Figure 8.
Developmental changes in responses and selective tuning of LMANcore and LMANshell neurons. A, Proportion of neurons that responded only to TUT and not to BOS or REV (left) in core (gray) and shell (red) at 45 dph (core, n = 68; shell, n = 65), 60 dph (core, n = 57; shell, n = 31) and in adult birds (core, n = 47; shell, n = 88). Proportion of neurons that responded only to BOS and not REV or TUT (middle) and proportion of neurons that responded to both BOS and TUT (right). *p < 0.05, **p < 0.01, and ***p < 0.001. The data for 45 dph are the same as those presented in Figure 3. B, Mean BOS–REV ΔSR scores for BOS-responsive neurons in LMANcore and LMANshell in 45 dph (core, n = 65; shell, n = 36), 60 dph (core, n = 53; shell, n = 26), and adult (core, n = 82; shell, n = 100) birds. Error bars indicate SEM. C, Mean BOS–TUT ΔSR scores for BOS-responsive neurons in LMANcore and LMANshell in 45 dph (core, n = 55; shell, n = 32), 60 dph (core, n = 40; shell, n = 23), and adult (core, n = 26; shell, n = 64) birds. D, Mean response strength of all BOS-responsive neurons to BOS across development. Filled circles show mean SRs of BOS-excited neurons in core (gray) and shell (red) to BOS in 45 dph (core, n = 65; shell, n = 29), 60 dph (core, n = 49; shell, n = 21), and adult (core, n = 72; shell, n = 88) birds. Open circles show mean SRs of BOS-suppressed neurons throughout development in core (n = 0 at 45 dph, n = 4 at 60 dph, n = 10 in adults) and shell (n = 7 at 45 dph, n = 5 at 60 dph, n = 12 in adults). There were no significant age differences within either subregion for both BOS-excited and BOS-suppressed neurons (p > 0.05 in all cases). Error bars indicate SEM.
Figure 9.
Figure 9.
Developmental changes in song-suppressive responses in LMANcore and LMANshell neurons. A, Proportion of auditory neurons that responded with suppression to any song stimulus in core (gray) and shell (red) at 45 dph (core, n = 83; shell, n = 77), 60 dph (core, n = 76; shell, n = 46), and adult (core, n = 120; shell, n = 154) birds. B, Proportion of BOS-responsive neurons that were suppressed by BOS in core and shell at 45 dph (core, n = 65; shell, n = 36), 60 dph (core, n = 53; shell, n = 26), and adult (core, n = 82; shell, n = 100) birds. *p < 0.05 and ***p < 0.001.
Figure 10.
Figure 10.
Feedforward and feedback LMANshell pathways. Shell circuitry (red) contributes both to feedback pathways through thalamus and through integrative feedforward pathways. One feedforward pathway includes a projection from AId (previously referred to as Ad) to dopaminergic neurons in VTA and then to basal ganglia of the core pathway (Area X, gray). Feedforward pathways also project through a dorsal thalamic zone to MMAN and thence to HVC, which controls adult song production through its projection to vocal motor cortex (RA). Main feedback pathways include those discussed in the Results: shell → dNCL → AId → DTZ → shell and shell → Area Xshell → DTZ → shell. Additional recurrent loops may be made through the projection of AId to VTA and lateral hypothalamus. In addition, LMANshell projects to ipsilateral posterior amygdala, which sends axons to contralateral LMANshell, thereby constituting one pathway that could be used for interhemispheric coordination (Johnson et al., 1995). Posterior pallial amygdala was referred to as Av (ventral arcopallium) in previous papers from our laboratory, but we have changed the terminology here to conform to the nomenclature suggested by Reiner et al. (2004). Dashed line indicates midline. HVC, common name; RA, robust nucleus of arcopallium; dNCL, dorsal caudolateral nidopallium; AId, dorsal intermediate arcopallium; LMAN, lateral magnocellular nucleus of the anterior nidopallium; MMAN, medial magnocellular nucleus of the anterior nidopallium; DTZ, dorsal thalamic zone (includes DLM and DMP); Area X, basal ganglia nucleus containing both striatal and pallidal neurons; LH, lateral hypothalamus; VTA, ventral tegmental area; PoA, posterior pallial amygdala.

Similar articles

Cited by

References

    1. Abe K, Watanabe D. Songbirds possess the spontaneous ability to discriminate syntactic rules. Nat Neurosci. 2011;14:1067–1074. doi: 10.1038/nn.2869. - DOI - PubMed
    1. Adret P, Meliza CD, Margoliash D. Song tutoring in presinging zebra finch juveniles biases a small population of higher-order song-selective neurons toward the tutor song. J Neurophysiol. 2012;108:1977–1987. doi: 10.1152/jn.00905.2011. - DOI - PMC - PubMed
    1. Aronov D, Andalman AS, Fee MS. A specialized forebrain circuit for vocal babbling in the juvenile songbird. Science. 2008;320:630–634. doi: 10.1126/science.1155140. - DOI - PubMed
    1. Atallah HE, Lopez-Paniagua D, Rudy JW, O'Reilly RC. Separate neural substrates for skill learning and performance in the ventral and dorsal striatum. Nat Neurosci. 2007;10:126–131. doi: 10.1038/nn1817. - DOI - PubMed
    1. Blättler F, Hahnloser RH. An efficient coding hypothesis links sparsity and selectivity of neural responses. PLoS One. 2011;6:e25506. doi: 10.1371/journal.pone.0025506. - DOI - PMC - PubMed

Publication types

LinkOut - more resources