. 2013 Sep 4;33(36):14512-25.
doi: 10.1523/JNEUROSCI.1980-13.2013.

Central activation of the A1 adenosine receptor (A1AR) induces a hypothermic, torpor-like state in the rat

Affiliations

Central activation of the A1 adenosine receptor (A1AR) induces a hypothermic, torpor-like state in the rat

Domenico Tupone et al. J Neurosci. .

Abstract

Since central activation of A1 adenosine receptors (A1ARs) plays an important role in the induction of the hypothermic and hypometabolic torpid state in hibernating mammals, we investigated the potential for the A1AR agonist N6-cyclohexyladenosine to induce a hypothermic, torpor-like state in the (nonhibernating) rat. Core and brown adipose tissue temperatures, EEG, heart rate, and arterial pressure were recorded in free-behaving rats, and c-fos expression in the brain was analyzed, following central administration of N6-cyclohexyladenosine. Additionally, we recorded the sympathetic nerve activity to brown adipose tissue; expiratory CO2 and skin, core, and brown adipose tissue temperatures; and shivering EMGs in anesthetized rats following central and localized, nucleus of the solitary tract, administration of N6-cyclohexyladenosine. In rats exposed to a cool (15°C) ambient temperature, central A1AR stimulation produced a torpor-like state similar to that in hibernating species and characterized by a marked fall in body temperature due to an inhibition of brown adipose tissue and shivering thermogenesis that is mediated by neurons in the nucleus of the solitary tract. During the induced hypothermia, EEG amplitude and heart rate were markedly reduced. Skipped heartbeats and transient bradycardias occurring during the hypothermia were vagally mediated since they were eliminated by systemic muscarinic receptor blockade. These findings demonstrate that a deeply hypothermic, torpor-like state can be pharmacologically induced in a nonhibernating mammal and that recovery of normothermic homeostasis ensues upon rewarming. These results support the potential for central activation of A1ARs to be used in the induction of a hypothermic, therapeutically beneficial state in humans.


Figures

Figure 1.
Figure 1.
Central activation of A1AR produces a torpor-like state in rat. A, Representative recordings from a single rat during three, 24 h periods: baseline (no treatment), following intracerebroventricular injection of CHA (Inj, gray dashed line), and following intracerebroventricular injection of saline (Inj, gray dashed line). Tamb, measured with a thermocouple within the recording chamber, was 25°C during the baseline day. During the treatment days, Tamb was initially 15°C (cooling, black dashed line) and was increased to 28°C (rewarming, black dashed line) at 6 h after intracerebroventricular CHA and after intracerebroventricular saline. i–iv, Representative recordings of skipped heartbeats and transient bradycardic events, often associated with nucal muscle contraction, at the entrance, nadir, and early and late recovery times (A, blue dotted lines) of the hypothermia produced by the CHA treatment. AP, Pulsatile arterial pressure; MAP, mean arterial pressure; L, light phase; D, dark phase. B, 24 h time courses of the physiological variables during the baseline day (light gray), following intracerebroventricular CHA (black) and following intracerebroventricular saline (SAL, dark gray). Data are means ± SEM (n = 4). *p < 0.05 [comparing the values at the time (gray vertical bar) of the maximal effect of intracerebroventricular CHA with those at the same interval after intracerebroventricular saline]. Red vertical bar indicates the time of the onset of the rewarming period in Tamb. C, Normalized (to mean band amplitudes during the 24 h of the baseline day EEG) amplitudes of δ and θ bands of the EEG during the 1 h period of the maximal effect of the intracerebroventricular CHA and same 1 h period on other days. The normalized rms amplitudes of the δ and θ bands after intracerebroventricular CHA were reduced from those on the baseline day. Data are means ± SEM. *p < 0.05 (comparing intracerebroventricular CHA and baseline).
Figure 2.
Figure 2.
Atropine treatment abolishes skipped heartbeats and transient bradycardia associated with CHA-induced hypothermia. In free-behaving rats, atropine injected intraperitoneally completely abolished (iii) the skipped heartbeats (i, arrow) and transient bradycardia (i, ii, bracket) occurring after the central activation of A1ARs. Time calibration bar represents 5 s in i–iii.
Figure 3.
Figure 3.
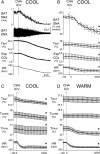
Central administration of CHA inhibits BAT thermogenesis and reduces cutaneous heat loss. A, B, In anesthetized rats, intracerebroventricular CHA (dashed line) inhibited the elevated BAT SNA and Tbat evoked by cold exposure and reduced the expired CO2 (Exp CO2) and HR. C, D, Mean responses in anesthetized rats to intracerebroventricular CHA under cool conditions (C) and under conditions of a warm Tcore (D), the latter accompanied by an increased Tpaw, indicative of cutaneous vasodilation. Note that in the warm condition, intracerebroventricular CHA elicits a profound reduction in Tpaw, indicating that CHA drives a cutaneous vasoconstriction. Data are means ± SEM (B, n = 6; C, D, n = 5). *p < 0.05 (comparing maximal CHA-evoked changes and pre-CHA injection control values).
Figure 4.
Figure 4.
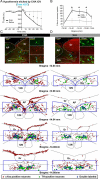
Central administration of CHA in free-behaving rat produces a profound hypothermia and activates neurons in iNTS. A, Reduction in Tcore elicited by intracerebroventricular CHA, but not by intracerebroventricular saline (SAL), in awake rats in an ambient temperature (Tamb) of 15°C. Data are means ± SEM (n = 6 for CHA and saline). B, Counts of c-fos-ir neurons at different levels of iNTS following intracerebroventricular CHA or intracerebroventricular SAL. Data are means ± SEM (n = 4 for CHA and for saline). *p < 0.05 (comparing the number of c-fos-ir neurons/30 μm section between CHA and SAL treatments). C, D, Histological sections from a representative rat (top) and drawings from a rat brain atlas (Paxinos and Watson, 2007) for levels of the iNTS between bregma −13.68 and −14.80 mm (bottom) showing distributions of c-fos-ir (red nuclei, red dots), TH-ir (green cells, green dots), and double-labeled (blue arrows, blue dots) neurons in iNTS following intracerebroventricular CHA (C) or intracerebroventricular SAL (D). The blue outline in the lower panels represents the area of iNTS from which the cell counts in B were obtained. Intracerebroventricular CHA strongly increased c-fos expression in fourth ventricular ependymal cells (top, gray arrows), but these were excluded from the c-fos-ir cell counts. AP, Area postrema; DMV, dorsal motor nucleus of the vagus; Gr, gracile nucleus; 12N, 12th nerve nucleus.
Figure 5.
Figure 5.
Neurons in iNTS do not project directly to rRPa. A, Histological section through the iNTS from a representative rat showing CTb-ir neurons (yellow circles) labeled after CTb injections into the rRPa. B, Counts of CTb-ir neurons at different levels of iNTS. Data are mean ± SEM (n = 4). C, Schematic diagram showing the CTb injection sites in the rRPa area of four rats. Fn, Facial nucleus; AP, area postema; DMV, dorsal motor nucleus of the vagus; Gr, gracillus nucleus; Py, pyramidal tract.
Figure 6.
Figure 6.
Nanoinjection of CHA into iNTS inhibits BAT thermogenesis and activates iNTS neurons. A, B, Cold-evoked BAT SNA and BAT thermogenesis are inhibited by direct bilateral nanoinjections (dotted lines) of CHA into iNTS and reversed by inhibition of iNTS neuronal activity by bilateral nanoinjections of muscimol (MUS) into iNTS illustrated in recordings from a single rat (A) and in group data analysis (B). Data are means ± SEM (n = 8 for CHA injection, n = 4 for CHA followed by muscimol injection). *p < 0.05 [comparing pre-CHA control values and those at 20 min post-CHA (i.e., maximal effect) or comparing premuscimol values and those at 10 min postmuscimol (i.e., maximal effect)]. C, Schematic representation (Paxinos and Watson, 2007) of the bilateral nanoinjection sites in the subpostremal iNTS of CHA only (purple) and CHA and muscimol (green).
Figure 7.
Figure 7.
Blockade of A1ARs in iNTS prevents the inhibition of BAT thermogenesis elicited by CHA. A, Illustrative recordings from a single anesthetized rat illustrating the effects on BAT SNA, Tbat, and other physiological variables of sequential nanoinjections into iNTS of vehicle (for CPT), CPT, CHA, NMDA, and of CPT, followed by the intracerebroventricular injection of CHA. B, Bilateral injection sites (red circles) in iNTS are plotted on an atlas drawing (Paxinos and Watson, 2007) through iNTS. C, Data are means ± SEM (n = 5 for each treatment except n = 4 for intracerebroventricular injection of CHA). *p < 0.05 (comparing pre-NMDA injection values and post-NMDA values). For the NMDA treatment, comparison was between 1 min of data at baseline, before vehicle injection in iNTS, and 1 min of data at the nadir of the effect. All other statistical assessments of treatment effects were made between 1 min of baseline, prevehicle injection data and 1 min of data at 10 min after each treatment.
Figure 8.
Figure 8.
CHA nanoinjection into iNTS inhibits shivering EMG activity. A, B, Inhibition of cold-evoked shivering EMGs following bilateral nanoinjections (dotted lines) of CHA, but not saline into iNTS in a single, representative rat (A) and in group data analysis (B). Data are means ± SEM (n = 4). *p < 0.05 (comparing pre-CHA and post-SAL values). C, Schematic representation (Paxinos and Watson, 2007) of the bilateral nanoinjection sites (yellow circles) of CHA into iNTS.

Similar articles

Cited by

References

    1. Andresen MC, Kunze DL. Nucleus tractus solitarius—gateway to neural circulatory control. Annu Rev Physiol. 1994;56:93–116. doi: 10.1146/annurev.ph.56.030194.000521. - DOI - PubMed
    1. Barraco RA, el-Ridi MR, Ergene E, Phillis JW. Adenosine receptor subtypes in the brainstem mediate distinct cardiovascular response patterns. Brain Res Bull. 1991;26:59–84. doi: 10.1016/0361-9230(91)90192-M. - DOI - PubMed
    1. Benington JH, Heller HC. Restoration of brain energy metabolism as the function of sleep. Prog Neurobiol. 1995;45:347–360. doi: 10.1016/0301-0082(94)00057-O. - DOI - PubMed
    1. Benington JH, Kodali SK, Heller HC. Stimulation of A1 adenosine receptors mimics the electroencephalographic effects of sleep deprivation. Brain Res. 1995;692:79–85. doi: 10.1016/0006-8993(95)00590-M. - DOI - PubMed
    1. Berner NJ, Heller HC. Does the preoptic anterior hypothalamus receive thermoafferent information? Am J Physiol. 1998;274:R9–R18. - PubMed

Publication types