. 2013 Sep 4;33(36):14567-78.
doi: 10.1523/JNEUROSCI.0649-13.2013.

Delta-opioid receptors mediate unique plasticity onto parvalbumin-expressing interneurons in area CA2 of the hippocampus

Affiliations

Delta-opioid receptors mediate unique plasticity onto parvalbumin-expressing interneurons in area CA2 of the hippocampus

Rebecca A Piskorowski et al. J Neurosci. .

Abstract

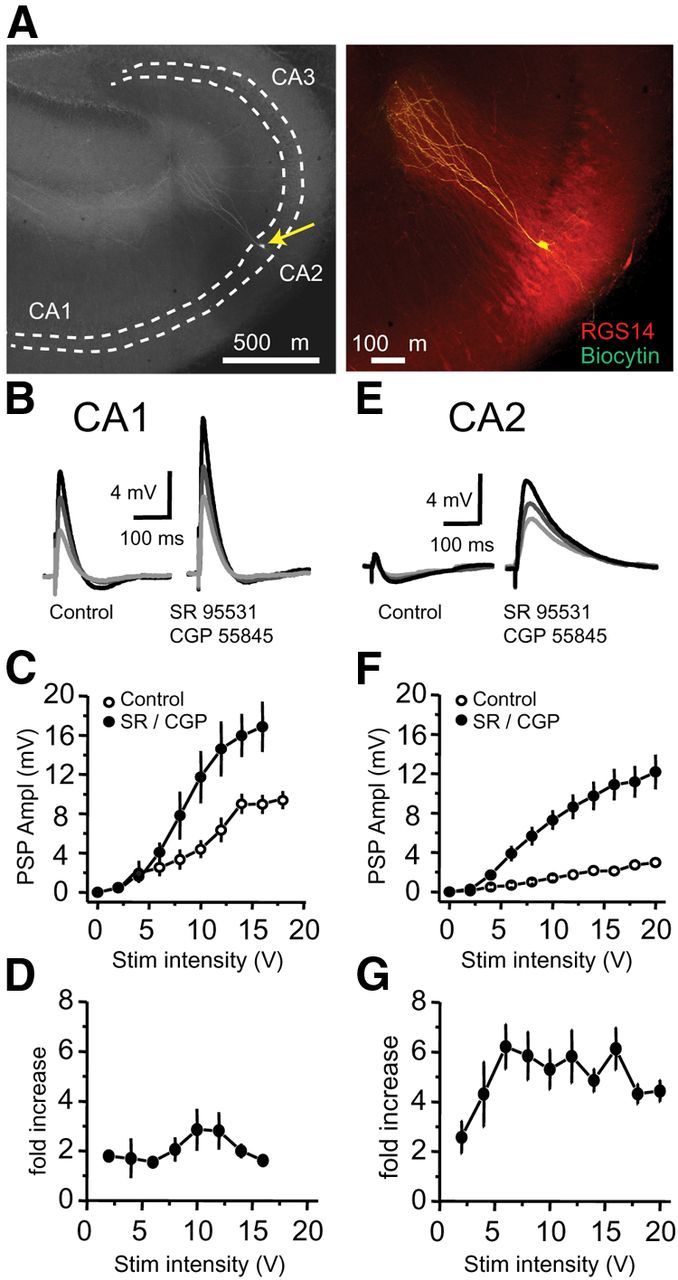
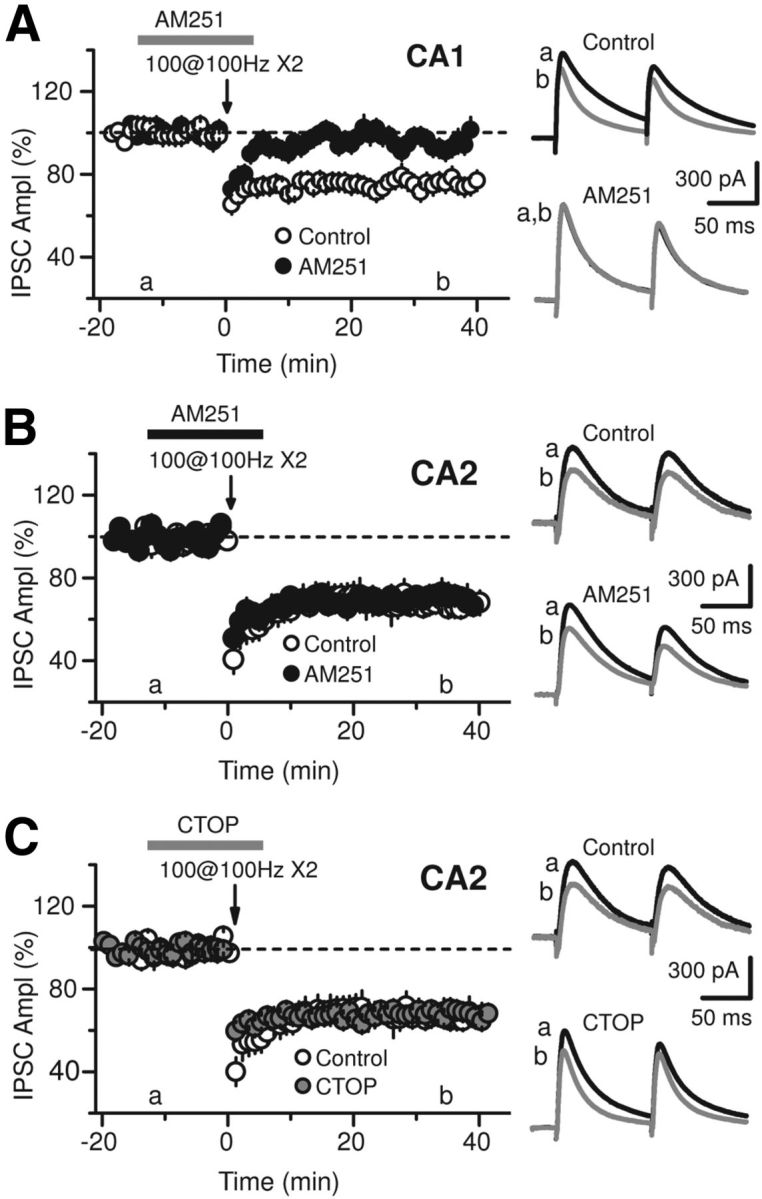
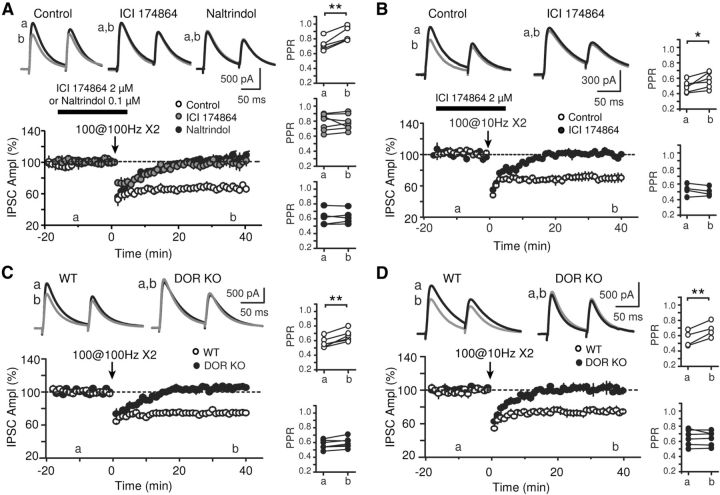
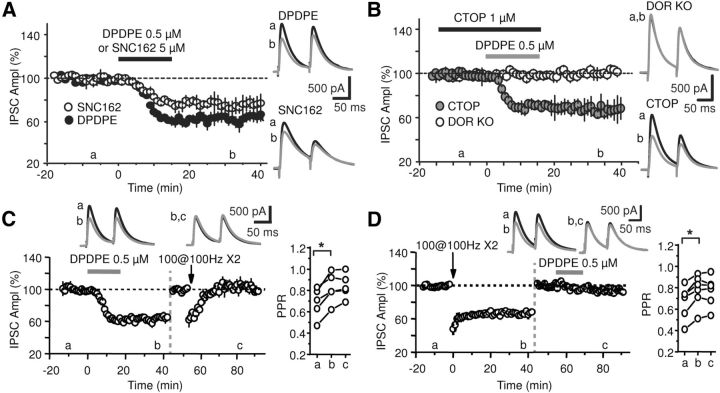
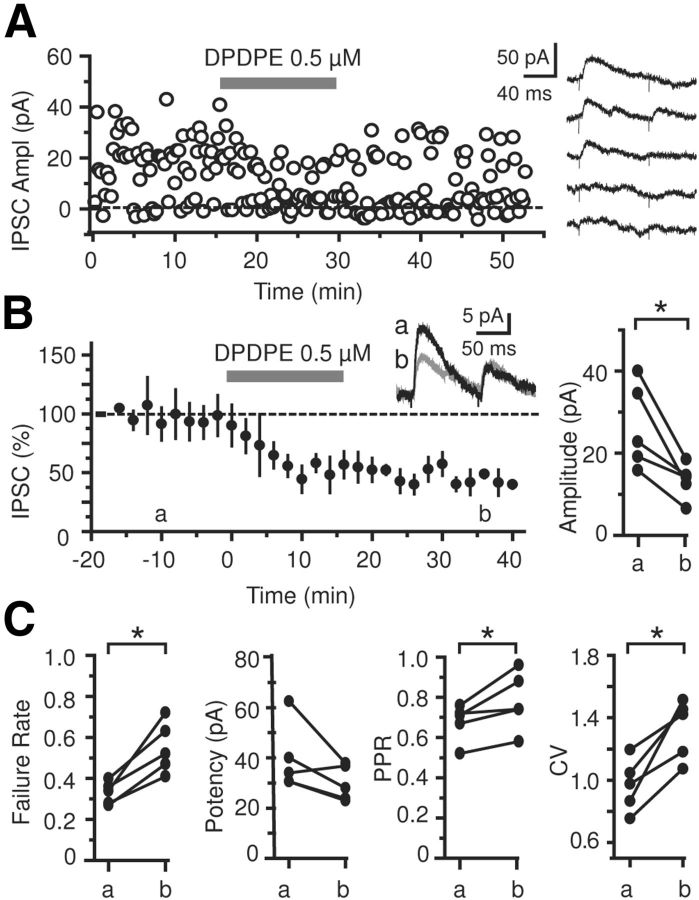
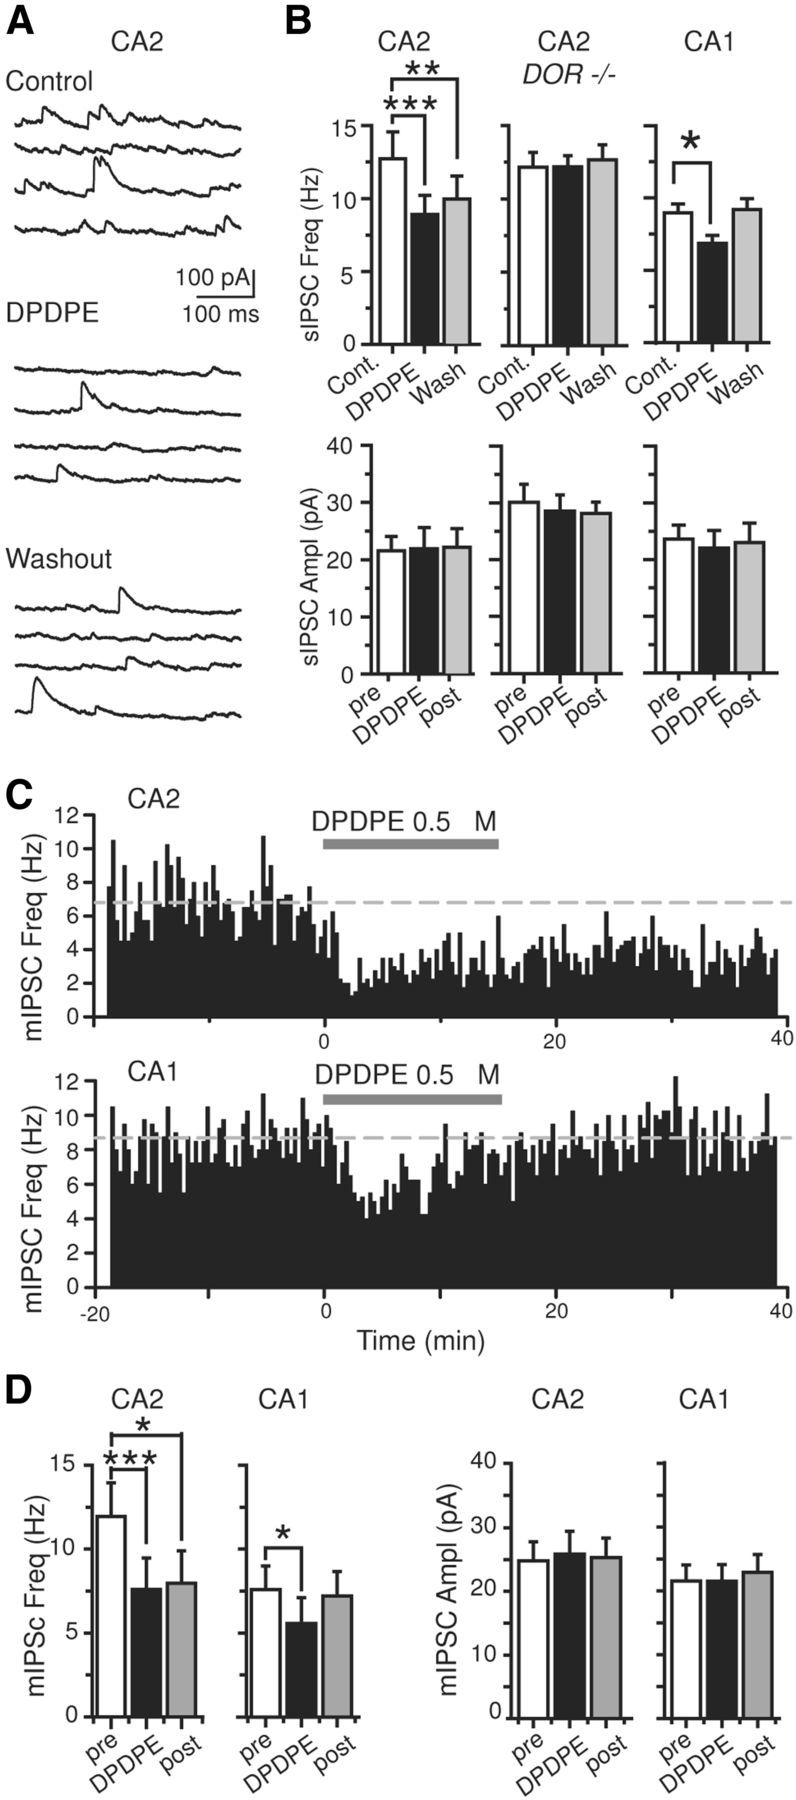
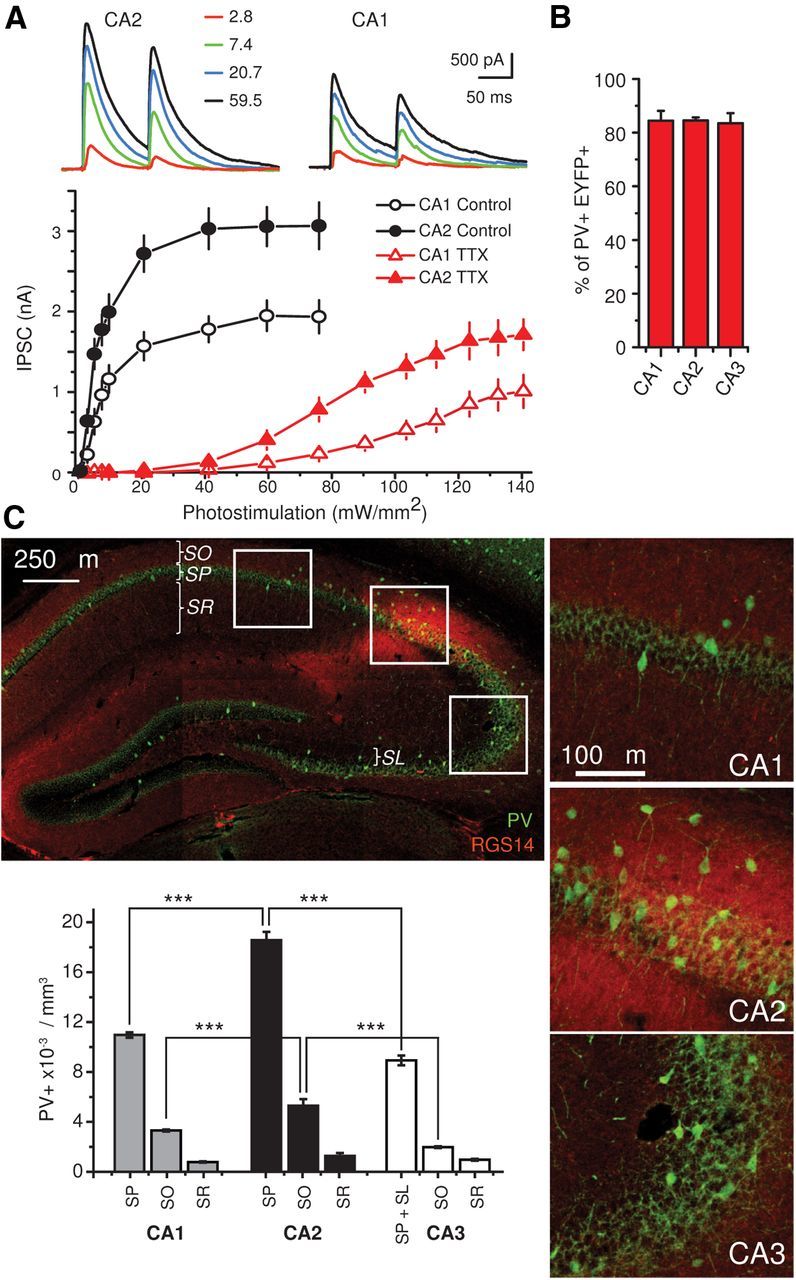
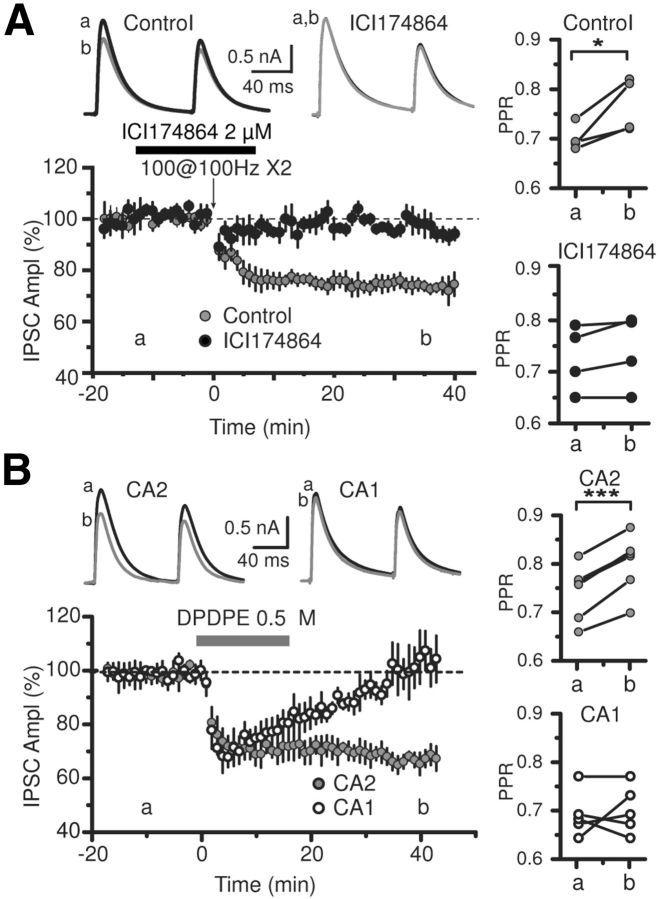
Inhibition is critical for controlling information transfer in the brain. However, the understanding of the plasticity and particular function of different interneuron subtypes is just emerging. Using acute hippocampal slices prepared from adult mice, we report that in area CA2 of the hippocampus, a powerful inhibitory transmission is acting as a gate to prevent CA3 inputs from driving CA2 neurons. Furthermore, this inhibition is highly plastic, and undergoes a long-term depression following high-frequency 10 Hz or theta-burst induction protocols. We describe a novel form of long-term depression at parvalbumin-expressing (PV+) interneuron synapses that is dependent on delta-opioid receptor (DOR) activation. Additionally, PV+ interneuron transmission is persistently depressed by DOR activation in area CA2 but only transiently depressed in area CA1. These results provide evidence for a differential temporal modulation of PV+ synapses between two adjacent cortical circuits, and highlight a new function of PV+ cells in controlling information transfer.


Figures

Figure 1.
Figure 1.
Stimulation of the SC pathway evokes a very strong inhibition in area CA2. A, Left, Low-magnification image of the hippocampus with a CA2 pyramidal neuron (arrow) filled with labeled biocytin. Right, Higher-magnification image of the same filled neuron (green) with superimposed immunolabeling for RGS14 (red), a protein strongly enriched in CA2 pyramidal neurons. B, Example of CA1 pyramidal cell PSP traces in response to a 6, 10, and 14 V Schaffer collateral stimulus before (control) and after blocking GABA transmission with 1 μm SR95531 and 2 μm CGP55845. C, The input-output curves of the CA1 pyramidal cell PSP amplitude peak with increasing stimulus intensity with (filled circles) and without (open circles) GABA transmission blocked with SR95531 and CGP55845 (n = 5). PSP amplitude could not be monitored for the highest stimulation intensities because most cells were firing action potentials. D, The fold-increases in PSP magnitude following GABA transmission block for CA1. E, CA2 pyramidal cell PSP traces in response to 6, 10, and 14 V Schaffer collateral stimulus before and after block of GABA transmission. F, Input-output curves of CA2 pyramidal cell PSP magnitude with (filled circles) and without (open circles) GABA transmission blocked with SR95531 and CGP55845 (n = 7). G, The fold-increase in PSP magnitude following GABA transmission block. Error bars show SEM.
Figure 2.
Figure 2.
There is an activity-dependent LTD of inhibition in area CA2. A, The amplitude of a CA2 pyramidal neuron IPSCs in a representative experiment illustrating how a HFS delivered in SR results in I-LTD. Right, IPSC traces corresponding to time points before (a) and after (b) the HFS tetanus. If the traces are normalized (bottom traces) to the peak of the first IPSC, the increase in the PPR with I-LTD is apparent. B, Summary data of HFS-evoked I-LTD (filled circles, n = 9; control recordings with no tetanus, open circles, n = 5) in CA2 resulting in a reduction of IPSC magnitude of 59.8 ± 4.2%. C, The change in PPR at the time points, a and b, in B for control (open circles) and recordings with HFS (filled circles). A consistent increase is observed in the PPR following HFS induced I-LTD in CA2 PCs. *p < 0.05. D, Time course of the normalized PPR magnitude (n = 7 tetanized, n = 5 control) showing the increase in PPR after induction of I-LTD. E, CA2 I-LTD can be induced by several different induction protocols. Plot of I-LTD (filled circles) and PPR (open circles) percentages observed following two sets of 100 pulses at 1, 10, and 100 Hz, and TBS. F, No I-LTD is observed following a 1 Hz stimulus protocol (n = 4). Error bars show SEM.
Figure 3.
Figure 3.
I-LTD in CA2 is independent of CB1 cannabinoid receptors and μ-opioid receptors. A, HFS evokes I-LTD at inhibitory synapses onto CA1 pyramidal neurons (open circles, n = 5). Application of 4 μm of the endocannabinoid receptor antagonist AM251 15 min before and during the tetanus (gray bar), is sufficient to eliminate HFS evoked I-LTD (filled circles, n = 5). Right, IPSC traces corresponding to the time points before (a) and after (b) HFS performed in control conditions or with AM251 application. B, Application of AM251 (black circles, n = 6) has no effect on the magnitude of I-LTD at the inhibitory-CA2 synapse (control conditions, open circles, n = 6). Right, representative IPSC traces for the two experimental conditions showing before and after the induction of I-LTD. C, Likewise, application of 1 μm CTOP (gray bar, gray circles, n = 5) 15 min before and during HFS had no effect on I-LTD. Right, IPSC traces from two time points before and after HFS. Error bars show SEM.
Figure 4.
Figure 4.
DORs are involved in I-LTD induction. A, HFS does not trigger I-LTD in presence of 2 μm of the DOR competitive antagonist ICI 174864 (gray circles, n = 7) nor in 0.1 μm Naltrindol (black circles, n = 5), but evokes normal LTD in interleaved control experiments (open circles, n = 6). Top, IPSC traces corresponding to the time points before (a) and after (b) HFS performed in control conditions or with drug application. Right, plots of PPR from individual experiments for the three conditions at the two time points, a and b. B, Application of 2 μm ICI 174864 during the slower frequency 10 Hz induction protocol also prevented I-LTD at the inhibitory-CA2 synapse (filled circles, n = 4). Inset above, IPSC traces corresponding to the time points before (a) and after (b) the 10 Hz stimulus in control conditions or during ICI 174864 application. Right, PPR from individual experiments at two time points for both control and ICI 174864 application. C, Slices prepared from DOR KO mice (filled circles, n = 7) fail to display I-LTD in CA2 pyramidal neurons in response to HFS. Slices prepared from WT controls (open circles, n = 6) display I-LTD. Inset above, IPSC traces at two time points for WT and DOR KO. Right, PPR values from individual experiments for both control and DOR KO at two time points. D, The I-LTD induced by 10 Hz tetanus is also absent in slices prepared from DOR KO mice (filled circles, n = 6) but still present in WT controls (open circles, n = 4). Inset above, traces from two time points. Right, PPR from individual experiments. *p < 0.05. **p < 0.01. Error bars show SEM in all panels.
Figure 5.
Figure 5.
The DOR agonist DPDPE evokes and occludes I-LTD. A, The 15 min application of two structurally distinct DOR agonists, 0.5 μm DPDPE (filled circles, n = 6) or 5 μm SNC162 (open circles, n = 4) can evoke a lasting depression at the inhibitory-CA2 synapse. Traces at right show IPSCs at two time points, before (a) and after (b) application of DOR agonist. B, Experiments showing the specific action of DOR on the induction of LTD in area CA2. Preapplication of the μ-opioid receptor antagonist CTOP does not alter the depression of IPSC amplitude by DPDPE. Summary graph of CA2 pyramidal neuron IPSC amplitude measured before and after DPDPE application in the presence of CTOP (gray circles, n = 3). Application of DPDPE to slices prepared from DOR KO mice (open symbols) fails to induce a lasting depression (n = 5). Traces to the right show example IPCSs at two time points, (a) before DPDPE applications and (b) after. C, Summary graph of CA2 neuron IPSC amplitude measured before and during the application of 0.5 μm DPDPE (n = 5). The IPSC amplitude is renormalized to 100% at 45 min (vertical gray dashed line) showing that an additional HFS fails to induce I-LTD. Traces inset above correspond to three time points (a) before DPDPE application, (b) following depression before HFS stimulation, and (c) 25 min after HFS. Right, Plot of individual PPRs for three time points noted in the graph. D, The summary graph of CA2 IPSC amplitude showing that DPDPE application has no effect on the IPSC amplitude after HFS-induced I-LTD (n = 6). Amplitudes are renormalized to 100% at 45 min (vertical gray dashed line) to facilitate comparison. Example IPSC traces for three time points are shown in inset above. Right, Individual PPRs are plotted for three time points. *p < 0.05. Error bars show SEM.
Figure 6.
Figure 6.
DORs act presynaptically to reduce GABA release. A, Example data from a single experiment using minimal stimulation in SR to evoke IPSCs in CA2 pyramidal neurons. Each IPSC amplitude is plotted, and an increase in the number of failures is observed following the application of 0.5 μm DPDPE. Right, Five example traces resulting from minimal stimulation (bottom two traces are considered failures). B, Average IPSC amplitudes evoked by minimal stimulation (n = 5) showing a decrease in IPSC amplitude following application of 0.5 μm DPDPE. Inset, Average of ten traces corresponding to two time points before (a) and after (b) application of DPDPE. Right, plot of the average IPSC amplitudes at time points a and b. C, Plots of the failure rate, potency, PPR, and CV for the two time points indicated in B for all experiments. *p < 0.05. Error bars show SEM.
Figure 7.
Figure 7.
The time course of DOR action on GABA release differs between CA1 and CA2. A, Sample traces of spontaneous IPSCs recorded in a CA2 pyramidal neuron before, during the application, and after the washout of 0.5 μm DPDPE. B, Histograms summarizing the effect of DPDPE on sIPSC frequency and amplitude in CA2 PCs from control and DOR KO mice and for control mice in CA1 (n = 8 for CA2 controls, n = 4 for CA2 DOR KO and n = 4 for CA1). C, Single example experiment showing the time course of the effect of DPDPE on miniature IPSCs frequency in CA2 and CA1 pyramidal neurons. Whereas mIPSC frequency is decreased following washout of DPDPE in CA2, a complete recovery of mIPSC frequency is observed in CA1. Dashed line marks average baseline frequency. D, Summary histograms of the effect of DPDPE on mIPSC frequency and amplitude in CA1 and CA2 pyramidal neurons (n = 5 for CA2 and for CA1). *p < 0.05, **p < 0.01, ***p < 0.001. Error bars show SEM.
Figure 8.
Figure 8.
High level of inhibitory transmission from PV+ interneurons in CA2. ChR2(H134R) was expressed specifically in PV+ interneurons in the hippocampus. Whole-cell recordings were performed in pyramidal cells in either area CA2 or CA1 and pairs of IPSCs were invoked with two 0.1 ms pulses of blue light. A, Average peak amplitude of IPSCs over a range of light intensities (n = 5) for CA1 (open symbols) and CA2 (filled symbols). Recordings were performed in the absence (circles, n = 8 for CA2 and n = 7 for CA1) and presence of 0.2 μm TTX (triangles, n = 5 for CA2 and CA1). In both conditions, CA2 pyramidal neurons display a larger PV+ interneuron IPSC than CA1 pyramidal neurons. Sample traces resulting from four different light intensities in control conditions are shown above. B, Histogram showing the percentage of PV+ cells also expressing ChR2 tagged with EYFP in the three hippocampal areas after viral injection (n = 4 mice). C, Top left, Immunofluorescent staining of RGS14 (red), a marker for area CA2 and parvalbumin (green) in the hippocampus. Corresponding areas marked in boxes are shown in higher magnification at the right. Bottom left, Bar graph showing the density of PV+ interneuron soma in the different strata of CA1, CA2 and CA3 in dorsal hippocampal sections (n = 4 mice). SP, Stratum pyramidale; SO, stratum oriens; SR, stratum radiatum; SL, stratum lucidum. *p < 0.001. Error bars show SEM.
Figure 9.
Figure 9.
DOR-mediated plasticity at PV+ interneurons reveals differences between CA1 and CA2. A, Electrical stimulation in SR results in I-LTD in area CA2 as measured by light-evoked IPSCs from PV+ interneurons (gray circles, n = 4). This I-LTD is not observed with the application of 2 μm ICI 174864 (black circles), indicating the necessity of DOR activation. Top, Example traces from two time points (a) and (b) in control conditions and with ICI 174864. Right, Plots of PPR at two time points in control and with ICI 174864. B, Plot of light-evoked IPSCs from CA1 (open circles, n = 5) or CA2 (filled circles, n = 6). Following application of the DOR agonist DPDPE, light-evoked PV+ interneuron transmission undergoes a stable I-LTD in CA2, whereas only a transient depression is observed in CA1. Top, example light-evoked IPSCs at two time points for CA2 and CA1. Right, IPSC PPR values for the same two time points for CA2 and CA1. Error bars show SEM.

Similar articles

Cited by

References

    1. Andrioli A, Alonso-Nanclares L, Arellano JI, DeFelipe J. Quantitative analysis of parvalbumin-immunoreactive cells in the human epileptic hippocampus. Neuroscience. 2007;149:131–143. doi: 10.1016/j.neuroscience.2007.07.029. - DOI - PubMed
    1. Bartesaghi R, Gessi T. Parallel activation of field CA2 and dentate gyrus by synaptically elicited perforant path volleys. Hippocampus. 2004;14:948–963. doi: 10.1002/hipo.20011. - DOI - PubMed
    1. Benes FM. Evidence for altered trisynaptic circuitry in schizophrenic hippocampus. Biol Psychiatry. 1999;46:589–599. doi: 10.1016/S0006-3223(99)00136-5. - DOI - PubMed
    1. Benes FM, Kwok EW, Vincent SL, Todtenkopf MS. A reduction of nonpyramidal cells in sector CA2 of schizophrenics and manic depressives. Biol Psychiatry. 1998;44:88–97. doi: 10.1016/S0006-3223(98)00138-3. - DOI - PubMed
    1. Blasco-Ibáñez JM, Martínez-Guijarro FJ, Freund TF. Enkephalin-containing interneurons are specialized to innervate other interneurons in the hippocampal CA1 region of the rat and guinea-pig. Eur J Neurosci. 1998;10:1784–1795. doi: 10.1046/j.1460-9568.1998.00190.x. - DOI - PubMed

Publication types

LinkOut - more resources