. 2013 Oct 18;288(42):30720-30733.
doi: 10.1074/jbc.M113.512467. Epub 2013 Sep 4.

Proteomic profiling of endothelial invasion revealed receptor for activated C kinase 1 (RACK1) complexed with vimentin to regulate focal adhesion kinase (FAK)

Affiliations

Proteomic profiling of endothelial invasion revealed receptor for activated C kinase 1 (RACK1) complexed with vimentin to regulate focal adhesion kinase (FAK)

Jui M Dave et al. J Biol Chem. .

Abstract

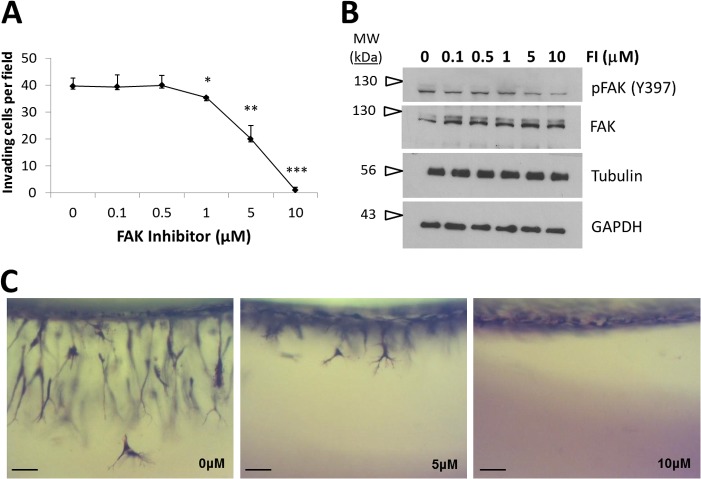
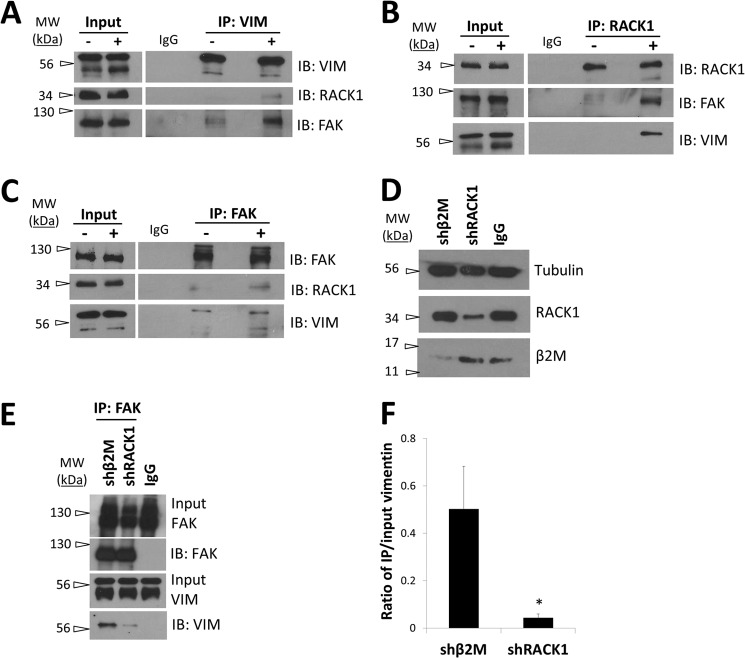
Angiogenesis is critical for many physiological and pathological processes. To identify molecules relevant to angiogenesis, we performed a proteomic screen comparing invading versus non-invading endothelial cells in three-dimensional collagen matrices. We found up-regulated levels of receptor for activated C kinase 1 (RACK1) and the intermediate filament protein vimentin that correlated with increased endothelial cell invasion. Because both RACK1 and vimentin have been linked to focal adhesion kinase (FAK), we investigated whether this pathway regulated invasion. RACK1 depletion reduced invasion responses, and this was associated with attenuated activation of FAK. Knockdown of vimentin significantly decreased levels of phosphorylated and total FAK. Treatment with a pharmacological inhibitor of FAK dose-dependently reduced invasion, indicating a crucial role for FAK activity during invasion. Because RACK1 and vimentin were both up-regulated with sphingosine 1-phosphate treatment, required for invasion, and regulated FAK, we tested whether they complexed together. RACK1 complexed with vimentin, and growth factors enhanced this interaction. In addition, RACK1, vimentin, and FAK formed an intermolecular complex in invading endothelial cultures in three dimensions in response to stimulation by sphingosine 1-phosphate and growth factors. Moreover, depletion of RACK1 decreased the association of vimentin and FAK, suggesting that RACK1 was required for stabilizing vimentin-FAK interactions during sprouting. Silencing of vimentin and RACK1 decreased cell adhesion and focal contact formation. Taken together, these results demonstrate that proangiogenic signals converge to enhance expression and association of RACK1 and vimentin, which regulated FAK, resulting in successful endothelial sprout formation in three-dimensional collagen matrices.

Keywords: Angiogenesis; Collagen; Endothelial Cell; Focal Adhesion Kinase; Morphogenesis; RACK1; Vimentin.


Figures

FIGURE 1.
FIGURE 1.
Effect of PTX on S1P- and GF-induced EC invasion. A, photographs illustrating invasion responses (upper panels, top view; lower panels, side view). ECs were treated with GF, S1P + GF, or S1P + GF + PTX. Cultures were fixed in 3% glutaraldehyde at 12.5 h, stained with toluidine blue, and photographed. Black arrowheads indicate invading cells. Scale bars, 50 μm. B, quantification of EC invasion density in response to various treatments shown in panel A. Data represent average numbers of invading cells per 1-mm2 field. Error bars represent S.D. (n = 5 fields; Student's t test; ***, p < 0.001 compared with other treatments).
FIGURE 2.
FIGURE 2.
Western blot analysis to verify up-regulation of identified proteins. A, verification of ANXA2, VIM, and RACK1 protein up-regulation. ECs treated with GF, S1P + GF, or S1P + GF + PTX were allowed to invade for 12.5 h prior to preparing cell extracts. Antisera specific to ANXA2, VIM, RACK1, and β2M were used for Western blot analyses. B, quantification of protein expression from Western blots using ImageJ software with normalization to β2M. The results represent average values normalized to β2M in arbitrary units (a.u.) from three independent experiments (Student's t test; *, p < 0.05 compared with all other treatments). Error bars represent S.D.
FIGURE 3.
FIGURE 3.
RACK1 knockdown decreased invasion responses in ECs. A, non-transduced ECs (WT) or ECs transduced with lentiviruses delivering shRNA directed to β2M (shβ2M-1 and -2) or RACK1 (shRACK1-1, -2, and -3) were utilized to generate RNA, cDNA, and RT-PCRs using RACK1-, β2M-, GAPDH-, ANXA2-, FAK-, VE-cadherin-, VIM-, and filamin A-specific primer sets. B, cell lysates from treatment groups as in A were analyzed by Western blotting using RACK1-, β2M-, GAPDH-, ANXA2-, FAK-, VE-cadherin-, VIM-, filamin A-, and tubulin-specific antisera. C, non-transduced ECs (WT) or ECs transduced with lentiviruses delivering shRNA directed to β2M (shβ2M-1) or RACK1 (shRACK1-1 and -2) were tested in three-dimensional invasion assays using S1P + GF. Photographs illustrate the invasion responses (upper panel, top view; lower panel, side view). Scale bars, 50 μm. D, Western blot analyses of whole cell lysates to verify β2M and RACK1 protein suppression using RACK1-, β2M-, and tubulin-specific antisera. Quantification of invasion density (E) and invasion distance (F) at 20 h of invasion is shown. Data in E represent average numbers of invading cells per 1-mm2 field (n = 3 fields; Student's t test; **, p < 0.01 compared with shβ2M). Data in F represent average lengths of structures (n > 80 cells; Student's t test; **, p < 0.01; ***, p < 0.001 compared with shβ2M). A representative experiment is shown (n = 4). Error bars represent S.D. in E and S.E. in F.
FIGURE 4.
FIGURE 4.
RACK1 rescue partially restored sprouting responses and invasion distance reduced by RACK1 silencing. ECs were transduced with lentiviruses delivering shRNA directed to β2M (shβ2M) or RACK1 (shRACK1) before being transduced with lentiviruses delivering enhanced GFP control or R3 (GFP-RACK1 rescue construct). A, photographs of a side view illustrating invasion responses. Scale bars, 50 μm. B, Western blot analyses of whole cell lysates probed with RACK1-, GFP-, β2M-, and tubulin-specific antisera. Arrows indicate expression of the R3 (65-kDa) construct. C, quantification of invasion density at 22 h. Data represent average numbers of invading cells per 1-mm2 field (n = 4 fields; one-way analysis of variance). Error bars represent S.D. D, quantification of invasion distance from EC monolayer to the tip of invading structures. The results represent average values (n > 100 sprouts; one-way analysis of variance). Error bars represent S.E. C and D, means with the same letter are not significantly different.
FIGURE 5.
FIGURE 5.
Depletion of RACK1 reduced FAK activation. A, ECs expressing shRNA directed to β2M (shβ2M) or RACK1 (shRACK1) were allowed to invade for the time points indicated. Whole cell lysates were prepared and analyzed by Western blot analysis using polyclonal antisera directed to pFAK (Tyr-397) and β2M and monoclonal antibodies directed to total FAK, RACK1, tubulin, and GAPDH. B, intensity levels for pFAK (Tyr-397) and total FAK were normalized to tubulin using ImageJ software. Ratios of normalized pFAK and FAK were plotted in arbitrary units (a.u.) from three independent experiments (Student's t test; *, p < 0.05 compared with shβ2M control). Error bars represent S.D.
FIGURE 6.
FIGURE 6.
EC invasion required FAK activation. A, ECs were preincubated with FI at the concentrations indicated for 20 min at 37 °C prior to seeding on collagen matrices. ECs were allowed to invade for 20 h with S1P + GF. Samples were fixed in 3% glutaraldehyde and stained with toluidine blue. Data represent average numbers of invading cells per 0.25-mm2 field (n = 3; Student's t test; *, p < 0.05; **, p < 0.01; ***, p < 0.001 as compared with 0 μm FI treatment). Error bars represent S.D. B, whole cell extracts from invading cultures from A at 2 h with the indicated FI concentration were immunoblotted with antisera directed against pFAK (Tyr-397), tubulin, and GAPDH. Blots were stripped and reprobed with FAK-specific antiserum. C, representative photographs of a side view of invasion (24 h) with 0, 5, and 10 μm FI treatment. Scale bars, 50 μm.
FIGURE 7.
FIGURE 7.
Vimentin regulated FAK expression in ECs. A, ECs were transduced with shRNA directed to β2M (shβ2M) or vimentin (shVIM) and placed in invasion assays in the presence of S1P + GF. Whole cell lysates were prepared at the indicated time points. Western blot analyses were conducted using polyclonal antisera directed to phospho-FAK (Tyr-397) and β2M as well as monoclonal antisera directed to total FAK, tubulin, GAPDH, and vimentin. B, quantification of FAK protein expression using ImageJ software with normalization to GAPDH. The results represent average values in arbitrary units (a.u.) from three independent experiments (Student's t test; *, p < 0.05 compared with shβ2M expression). Error bars represent S.D.
FIGURE 8.
FIGURE 8.
Growth factor stimulation enhanced RACK1-vimentin complex formation. A, ECs were cultured in T75 flasks for 3 days without replenishing growth medium and stimulated with S1P + GF for 1 h. Immunoprecipitations (IP) were performed using monoclonal RACK1 antibody or isotype control (IgG) and probed for vimentin and RACK1 using Western blot analyses. B, reverse immunoprecipitations were performed using a polyclonal vimentin antibody or isotype control (IgG) and probed for RACK1 and vimentin using Western blot analyses. C, ECs were cultured in T75 flasks for 3 days and stimulated with nothing (control), 1 μm S1P, or GF for 1 h. Immunoprecipitations were performed using monoclonal RACK1 antibody or isotype control (IgG). Eluates were probed with vimentin- and RACK1-specific antisera using Western blotting. D, quantification of co-precipitated vimentin normalized to starting material from Western blots using ImageJ software. The results represent average values in arbitrary units (a.u.) from three independent experiments (Student's t test; **, p < 0.01 compared with control). Error bars represent S.D. E, ECs seeded on glass coverslips were serum-starved for 1 h and treated without (control), with 1 μm S1P, or with 40 ng/ml GFs for 1 h. Following paraformaldehyde fixation, cells were stained with monoclonal anti-RACK1 or polyclonal anti-vimentin antibody and detected with species-specific secondary antibodies conjugated to Alexa Fluor 594 and Alexa Fluor 488. Images were collected using a Nikon A1 confocal laser microscope. Scale bars, 5 μm. F, quantification of RACK1 (red) and vimentin (green) co-localization using Pearson's correlation coefficient. The results represent average values from each treatment group. Error bars represent S.D. n = number of cells per treatment group (one-way analysis of variance with Bonferroni's multiple comparison post hoc test; *, p < 0.05 compared with control). IB, immunoblot.
FIGURE 9.
FIGURE 9.
RACK1, vimentin, and FAK complex formation was enhanced during EC invasion. Confluent flasks (75 cm2) of ECs were serum-starved for 2 h, trypsinized, and placed in invasion assays in the absence (−) or presence of S1P + GF (+) for 3 h prior to lysate preparation. Immunoprecipitations (IP) were performed using polyclonal antisera directed to vimentin (A), RACK1 (B), and FAK (C) along with matched isotype controls (IgG). Eluates (A–C) were probed for VIM, FAK, and RACK1 using Western blot analyses and are from one representative experiment (n = 3). D–F, ECs were transduced with lentiviruses delivering shRNAs directed to RACK1 (shRACK1) or β2M (shβ2M) and allowed to invade collagen matrices for 3 h prior to cell lysis and immunoprecipitation. D, Western blot analyses of starting material to verify successful silencing of β2M and RACK1 proteins. E, immunoprecipitations were performed using a monoclonal FAK antibody or isotype control (IgG) and probed for FAK and VIM using Western blot analyses. F, quantification of co-precipitated vimentin normalized to input material from Western blots using ImageJ software. The results represent average values in arbitrary units (a.u.) from three independent experiments (Student's t test; *, p < 0.05 compared with shβ2M control). Error bars represent S.D. IB, immunoblot.
FIGURE 10.
FIGURE 10.
Vimentin silencing reduced EC adhesion responses. ECs were transduced with shRNA directed to β2M (shβ2M) and vimentin (shVIM) (A) or shβ2M and shRACK1 (C) for 4 days before being plated on wells coated with increasing amounts of fibronectin at the doses indicated for 15 min. Absorbance values (595 nm) represent relative levels of cell attachment, and error bars represent S.D. Results shown are representative of four independent experiments. B, Western blot of cell extracts probed with antisera directed to β2M, α-tubulin, and vimentin from the experiment in A. D, Western blot of cell extracts probed with antisera directed to β2M, α-tubulin, and RACK1 from the experiment in C. E, indirect immunofluorescence staining of ECs expressing shβ2M, shVIM, and shRACK1 using monoclonal antibodies directed against pFAK (Tyr-397) and vinculin. Scale bars, 10 μm.

Similar articles

Cited by

References

    1. Carmeliet P. (2003) Angiogenesis in health and disease. Nat. Med. 9, 653–660 - PubMed
    1. Folkman J., D'Amore P. A. (1996) Blood vessel formation: what is its molecular basis? Cell 87, 1153–1155 - PubMed
    1. Adams R. H., Alitalo K. (2007) Molecular regulation of angiogenesis and lymphangiogenesis. Nat. Rev. Mol. Cell Biol. 8, 464–478 - PubMed
    1. Kalluri R. (2003) Basement membranes: structure, assembly and role in tumour angiogenesis. Nat. Rev. Cancer, 3, 422–433 - PubMed
    1. Iruela-Arispe M. L., Davis G. E. (2009) Cellular and molecular mechanisms of vascular lumen formation. Dev. Cell 16, 222–231 - PMC - PubMed

Publication types

MeSH terms

LinkOut - more resources