. 2014 Aug;72(2):324-36.
doi: 10.1002/mrm.24919. Epub 2013 Sep 4.

Accelerated multi-shot diffusion imaging

Affiliations

Accelerated multi-shot diffusion imaging

Bruno Madore et al. Magn Reson Med. 2014 Aug.

Abstract

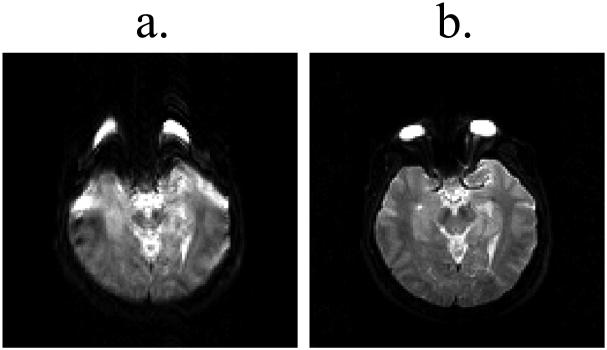
Purpose: To reduce image distortion in MR diffusion imaging using an accelerated multi-shot method.

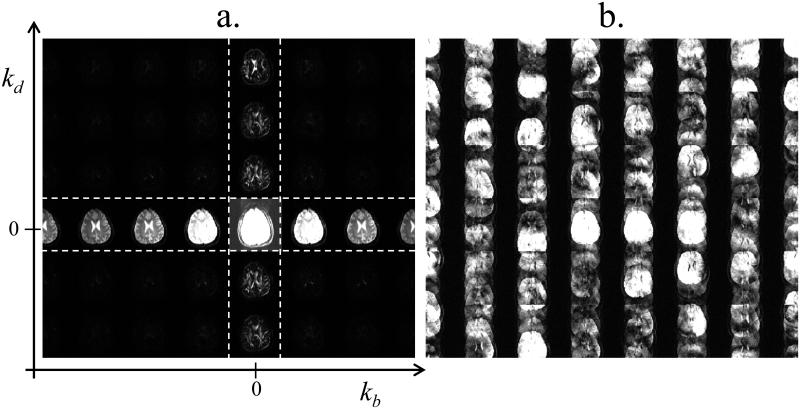
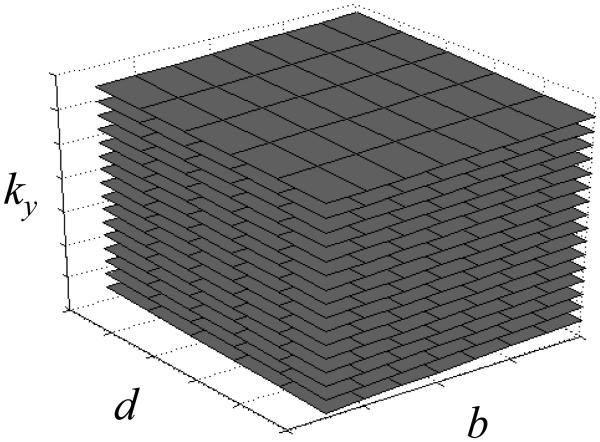
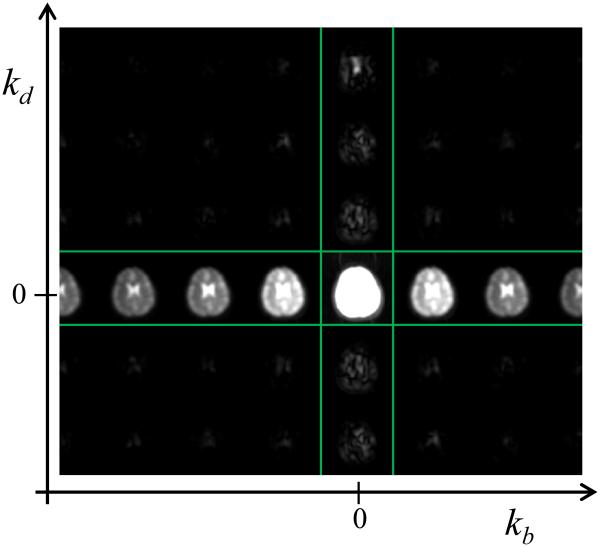
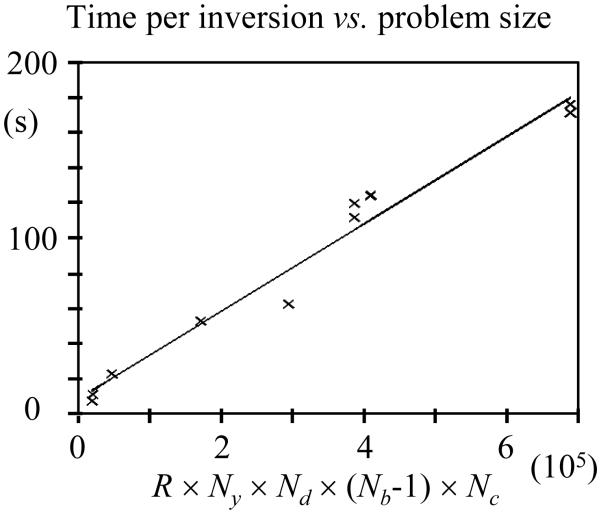
Methods: The proposed method exploits the fact that diffusion-encoded data tend to be sparse when represented in the kb-kd space, where kb and kd are the Fourier transform duals of b and d, the b-factor and the diffusion direction, respectively. Aliasing artifacts are displaced toward under-used regions of the kb-kd plane, allowing nonaliased signals to be recovered. A main characteristic of the proposed approach is how thoroughly the navigator information gets used during reconstruction: The phase of navigator images is used for motion correction, while the magnitude of the navigator signal in kb-kd space is used for regularization purposes. As opposed to most acceleration methods based on compressed sensing, the proposed method reduces the number of ky lines needed for each diffusion-encoded image, but not the total number of images required. Consequently, it tends to be most effective at reducing image distortion rather than reducing total scan time.

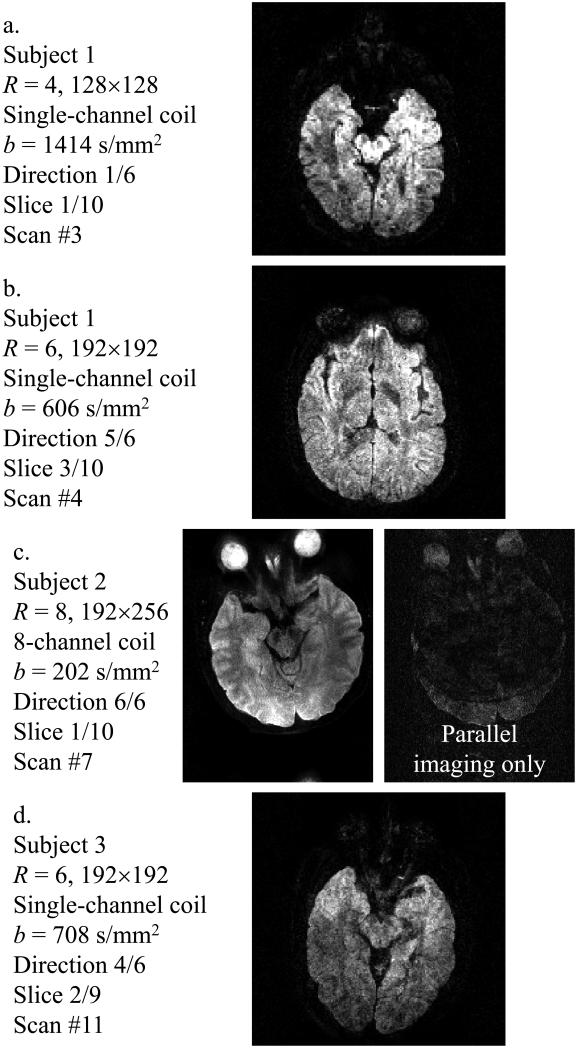
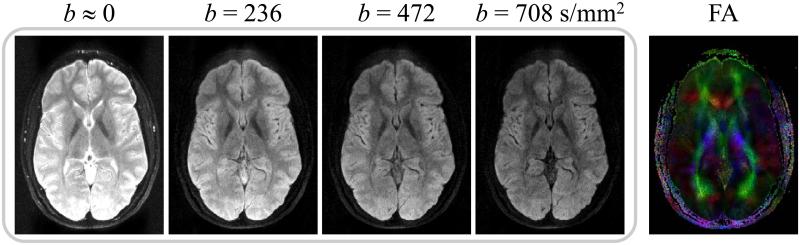
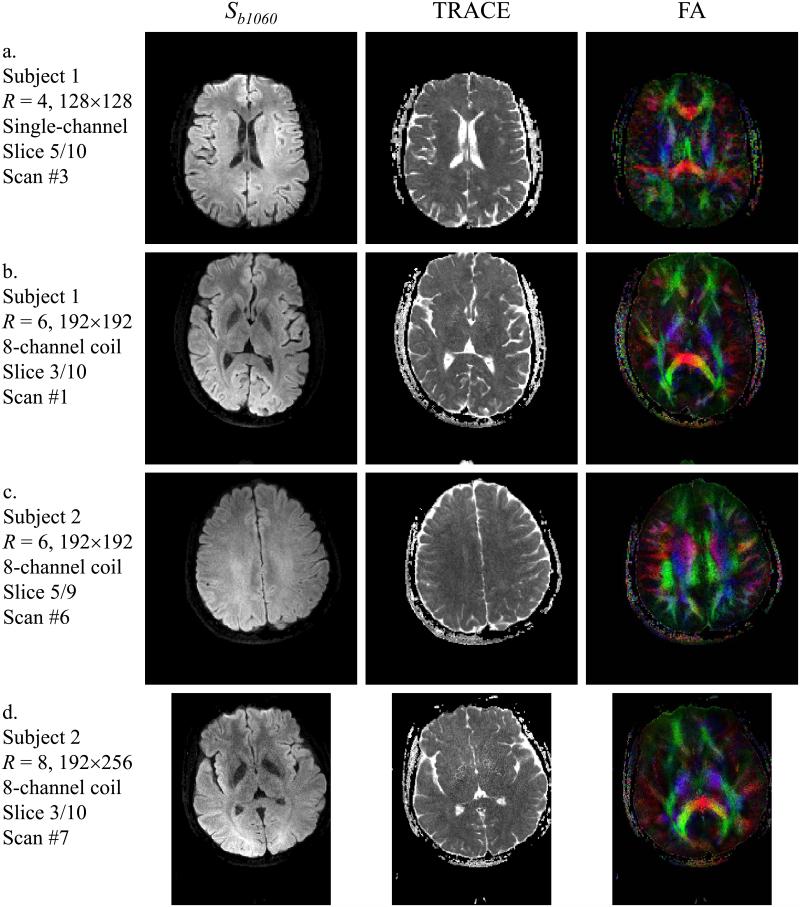
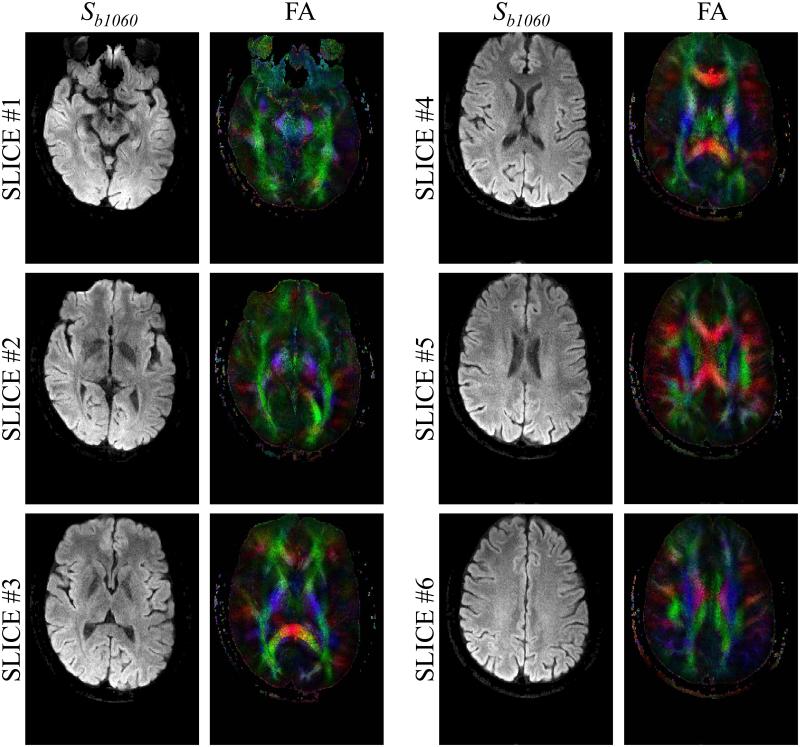
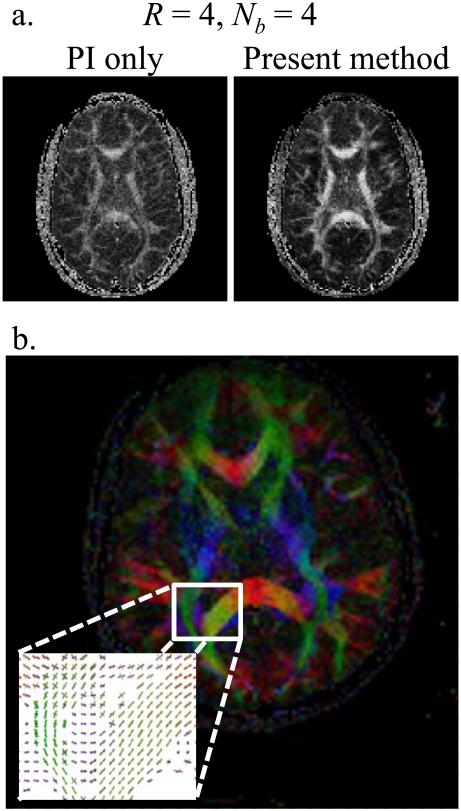
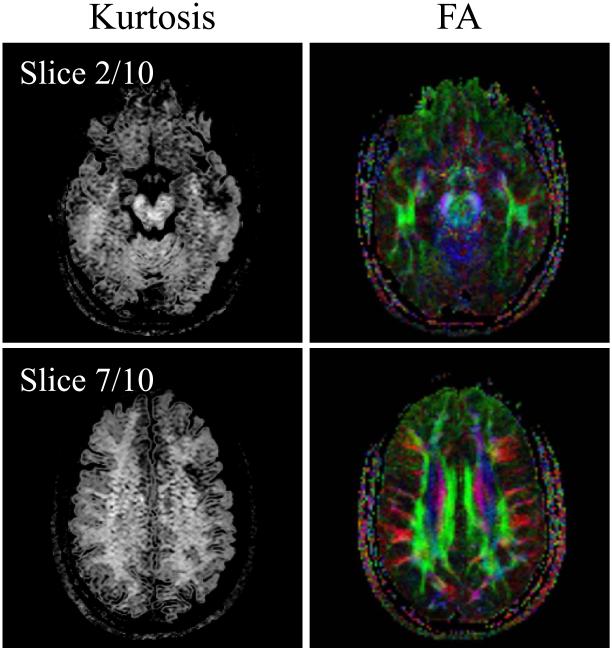
Results: Results are presented for three volunteers with acceleration factors ranging from 4 to 8, with and without the inclusion of parallel imaging.

Conclusion: An accelerated motion-corrected diffusion imaging method was introduced that achieves good image quality at relatively high acceleration factors.

Keywords: accelerated imaging; diffusion imaging; multi-shot EPI; navigator echoes.


Figures

Fig. 1
Fig. 1
Single-shot EPI images may greatly suffer from geometric distortions, as shown in (a), a problem that can be very much alleviated using k-space segmentation, as shown in (b). The acquisition in (b) was made over 4 TR intervals as opposed to a single TR interval in (a), and these 4-shot data were reconstructed as described in Ref. (1). The main goal of the present work was to accelerate multi-shot imaging, to make it essentially as fast as single-shot imaging while preserving the geometric-fidelity advantages seen here. (The single-shot image in (a) was acquired using 80 echoes, 62.5% partial-Fourier, echo spacing = 668 μs, matrix size = 128×128, FOV = 25.6 cm, TR = 3 s, 4 mm slice, b ≈ 0 s/mm2. The four-shot image in (b) involved the same parameters as above, except for 32 echoes per echo train, no partial-Fourier and echo spacing = 664 μs).
Fig. 2
Fig. 2
a) Diffusion-weighted images for 7 different b-values, from 202 to 1414 s/mm2, and 6 different directions were Fourier transformed along the b and d directions (the imaging parameters are the same as in Fig. 1a). Most signal is concentrated in the cross-shaped region characterized by kb = 0 and/or kd = 0, highlighted with white dashed lines. b) Subsampling ky by a factor 4 leads to a more complicated kb × kd space, heavily corrupted by aliasing artifacts. The fact that the desired solution tends to be sparse, as seen in (a), greatly facilitates the task of numerically sorting out the signal in (b). In addition to aliasing artifacts caused by 4-fold subsampling, the signal in (b) is further complicated by motion-induced and possibly drift-induced phase variations in b-d space, i.e., the term pi from Eq. 3.
Fig. 3
Fig. 3
The subsampling scheme can be visualized in a ky-b-d space. In the present example, 16 planes separated by 8 ky lines would be acquired to reconstruct 128 y locations with an acceleration factor of 8. Intersecting black lines indicate the sampled b-d locations. A cross-section of these planes in a ky-b plane would give straight lines with slope ∆ky/∆b, where ∆ky is the distance between consecutive ky lines and ∆b is the distance between consecutive b values, while a cross-section in a ky-d plane would give straight lines with slope ∆ky.
Fig. 4
Fig. 4
The magnitude of the navigator images, in x-y-d-b space, is Fourier transformed to x-y-kd-kb space. The magnitude of the result, displayed here, is used toward generating the regularization term L in Eq. 2, as described in the text.
Fig. 5
Fig. 5
Our navigated multi-shot EPI sequence is depicted here. See text for more details.
Fig. 6
Fig. 6
The reconstruction algorithm takes as an input the acquired imaging data, the navigator data, and the reference data (i.e., three TR worth of data acquired without any phase encoding). Aliasing-free diffusion-weighted images are generated at the output. These images can then be analyzed, as usual, to calculate the diffusion tensor for each image voxel. A key characteristic of the method is how thoroughly the navigator data get utilized: To obtain a motion-correction phase term, a regularization magnitude term, an initial guess for the iterative solver and, optionally, for direct replacement of the central k-space region in the final results. See text for more details.
Fig. 7
Fig. 7
The images shown here aim to illustrate key steps of the algorithm from Fig. 6. a-c) The input to the algorithm from Fig. 6 consists of imaging data, navigator data and at least one TR worth of non-phase-encoded reference data to correct for EPI ghosting artifacts. d) The fully-sampled b ≈ 0 data were reconstructed using the method from (1), one coil-element at a time (coil element 2/8 here). e) All coil elements were combined for the navigator data, and the resulting images were used for motion-correction, regularization, solver initialization and optionally for direct data replacement (see Fig. 6). f,g) The reconstructed result is displayed with and without the optional data replacement, which had little effect in this particular case. The dataset was acquired using R = 6, 192×192 matrix size, Nb = 4, Nd = 6, and the 9 displayed slice corresponds to b = 471 s/mm2.
Fig. 8
Fig. 8
The effect of the regularization parameter, λ2 from Eq. 2, was analyzed in the reconstruction of two different datasets: One with acceleration R = 4 and another with R = 8. An FA map and a diffusion-weighted image are shown in all cases. The noise content had a tendency to decrease with increasing λ2 values, while both large and small values for λ2 led to blurring. See text for more details.
Fig. 9
Fig. 9
Examples of diffusion-weighted images reconstructed using the proposed method. The subject number, acceleration factor R, matrix size, number of receiver elements, b-value, diffusion-encoding direction, slice number and entry number in Table 1 are provided for each example.
Fig. 10
Fig. 10
All four diffusion-weighted images reconstructed for scan #10 from Table 1 are shown here (slice #2 out of 9, diffusion-encoding direction #4 out of 6), along with the corresponding FA map.
Fig. 11
Fig. 11
Reconstruction time for all y locations at a given x-z location was found to increase roughly linearly with (R × Ny × Nd × (Nb-1) × Nc), with a slope of m = 2.46×10⁻⁴ s in the present implementation.
Fig. 12
Fig. 12
Examples of diffusion tensor results are presented. For each case, the subject number, acceleration factor R, matrix size, number of receiver elements, slice number and entry number in Table 1 are provided. See text for more details.
Fig. 13
Fig. 13
The first (most inferior) six slices for one given scan are shown here (scan #2 from Table 1, R = 8, matrix size = 192×256, 8-channel coil). It may be noted that good geometric fidelity was obtained even for slice #1, located closest to the sinuses.
Fig. 14
Fig. 14
a) A 4-fold accelerated dataset was reconstructed using parallel-imaging only and using the proposed method (Nb = 4, the 4 first b-values from scan #9 in Table 1 were used here). b) The 100-direction dataset from entry #5 in Table 1 was reconstructed so that fiber crossings could be identified and mapped. Results from an ROI are shown and can be compared to the corresponding FA map.
Fig. 15
Fig. 15
The data from entry #9 in Table 1 were reconstructed using both a kurtosis model and a mono-exponential tensor model. Kurtosis and fractional anisotropy results are shown side-by-side for an inferiorly-located and a mid-brain slice.

References

    1. Atkinson D, Counsell S, Hajnal JV, Batchelor PG, Hill DL, Larkman DJ. Nonlinear phase correction of navigated multi-coil diffusion images. Magn Reson Med. 2006;56(5):1135–1139. - PubMed
    1. Anderson AW, Gore JC. Analysis and correction of motion artifacts in diffusion weighted imaging. Magn Reson Med. 1994;32(3):379–387. - PubMed
    1. Butts K, de Crespigny A, Pauly JM, Moseley M. Diffusion-weighted interleaved echo-planar imaging with a pair of orthogonal navigator echoes. Magn Reson Med. 1996;35(5):763–770. - PubMed
    1. Miller KL, Pauly JM. Nonlinear phase correction for navigated diffusion imaging. Magn Reson Med. 2003;50(2):343–353. - PubMed
    1. Holdsworth SJ, Skare S, Newbould RD, Bammer R. Robust GRAPPA-accelerated diffusion-weighted readout-segmented (RS)-EPI. Magn Reson Med. 2009;62(6):1629–1640. PMCID:PMC2904969. - PMC - PubMed

Publication types

MeSH terms