

Underrepresentation by race-ethnicity across stages of U.S. science and engineering education
- PMID: 24006384
- PMCID: PMC3763003
- DOI: 10.1187/cbe.12-12-0207
Underrepresentation by race-ethnicity across stages of U.S. science and engineering education
Abstract
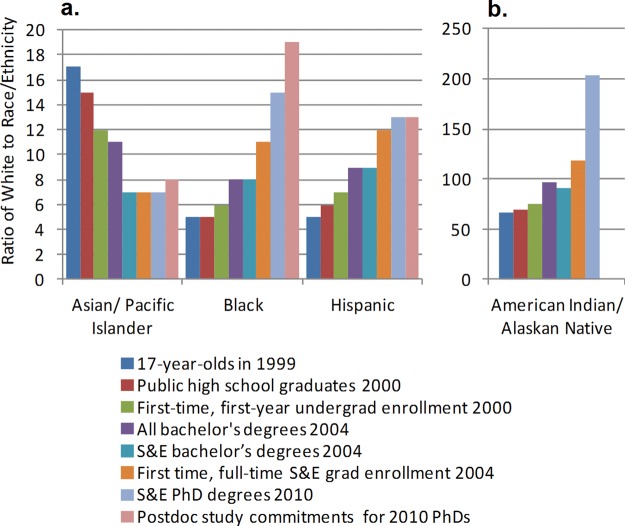
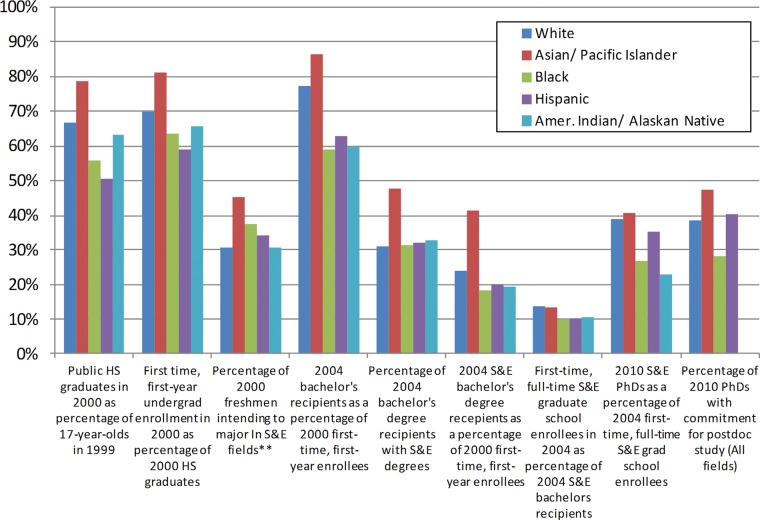
Blacks, Hispanics, and American Indians/Alaskan Natives are underrepresented in science and engineering fields. A comparison of race-ethnic differences at key transition points was undertaken to better inform education policy. National data on high school graduation, college enrollment, choice of major, college graduation, graduate school enrollment, and doctoral degrees were used to quantify the degree of underrepresentation at each level of education and the rate of transition to the next stage. Disparities are found at every level, and their impact is cumulative. For the most part, differences in graduation rates, rather than differential matriculation rates, make the largest contribution to the underrepresentation. The size, scope, and persistence of the disparities suggest that small-scale, narrowly targeted remediation will be insufficient.
Figures
References
-
- Backes B. Do affirmative action bans lower minority college enrollment and attainment? Evidence from statewide bans. J Hum Res. 2012;47:435–455.
-
- Garces LM. Understanding the impact of affirmative action bans in different graduate fields of study. Am Educ Res J. 2013;50:251–284. http://aer.sagepub.com/content/early/2013/01/14/0002831212470483 (accessed 13 February 2013)
-
- Ginther DK, Schaffer WT, Schnell J, Massimore B, Liu F, Haak LL, Kington RS. Diversity in academic biomedicine: an evaluation of education and career outcomes with implications for policy. Soc Sci Res Network 22 September 2009. 2009 http://papers.ssrn.com/sol3/papers.cfm?abstract_id=1677993 (accessed 7 September 2012)
-
- Hinrichs P. The effects of affirmative action bans on college enrollment, educational attainment, and the demographic composition of universities. Rev Econ Stat. 2012;94:712–722.
MeSH terms
LinkOut - more resources
Full Text Sources
Other Literature Sources
