. 2013 Nov;87(22):12270-83.
doi: 10.1128/JVI.01243-13. Epub 2013 Sep 4.

Identification of Kaposi's sarcoma-associated herpesvirus LANA regions important for episome segregation, replication, and persistence

Affiliations

Identification of Kaposi's sarcoma-associated herpesvirus LANA regions important for episome segregation, replication, and persistence

Erika De León Vázquez et al. J Virol. 2013 Nov.

Abstract

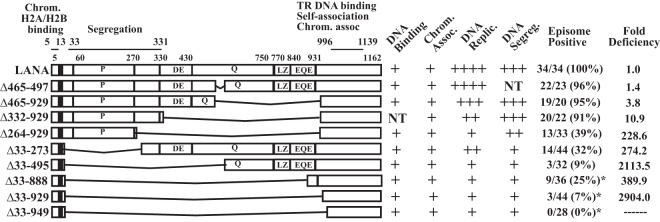
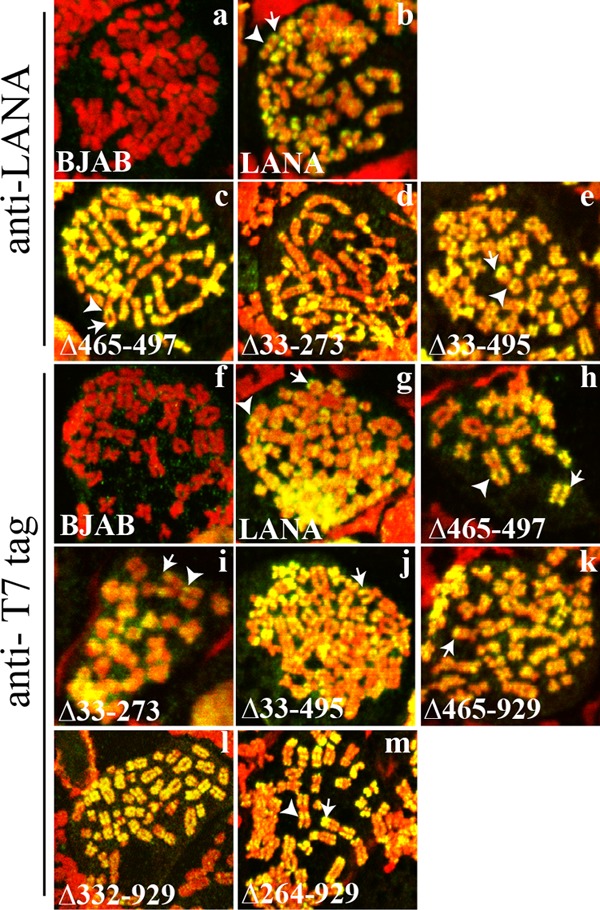
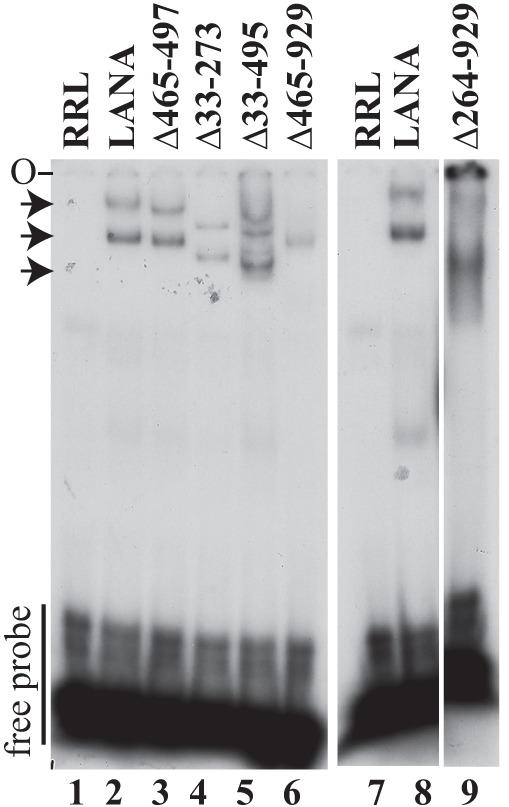
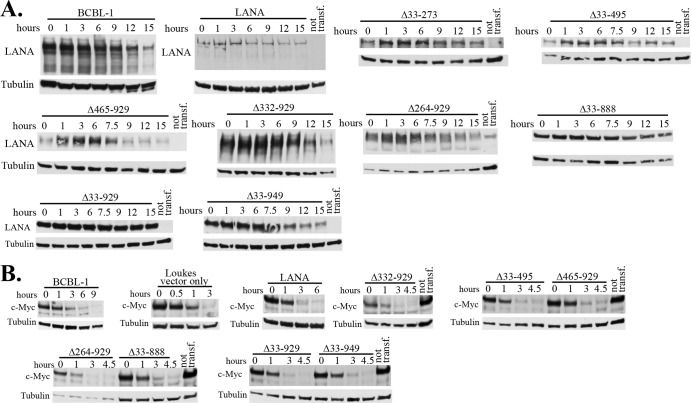
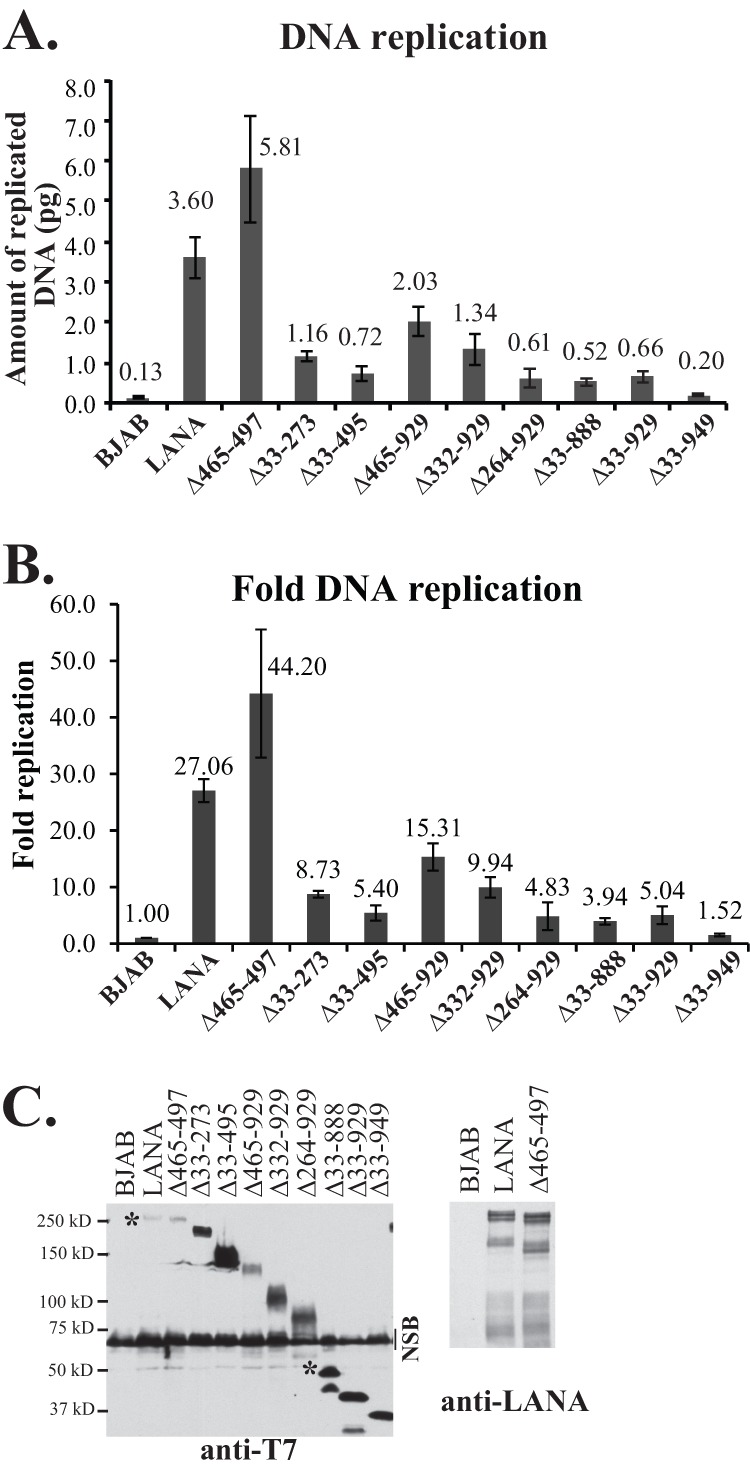
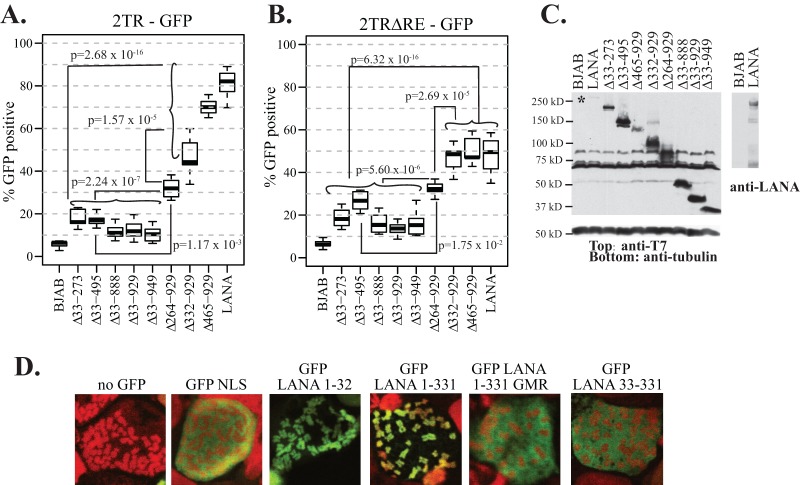
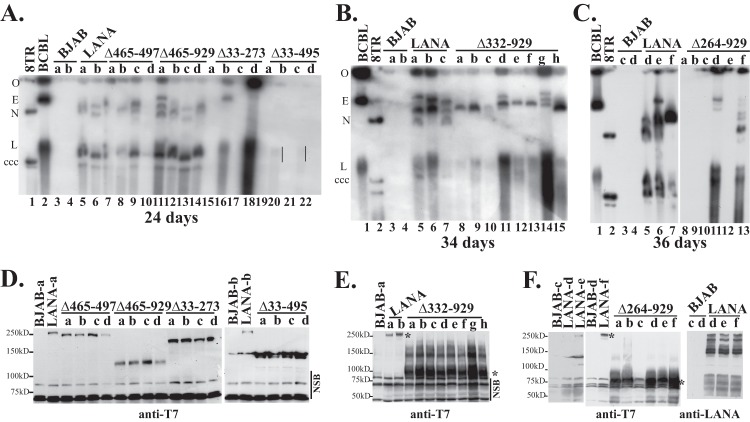
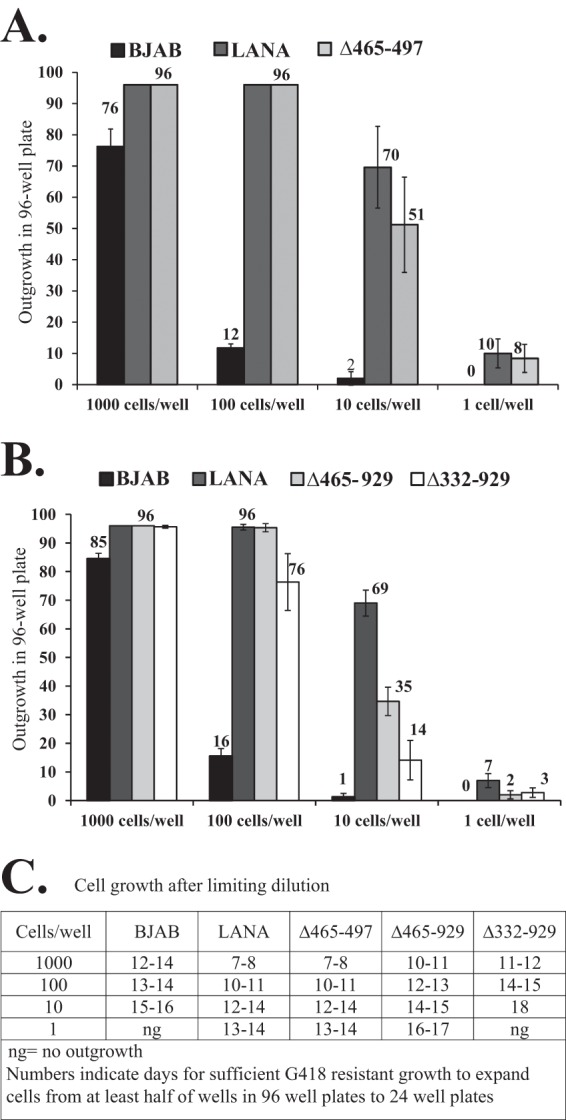
Kaposi's sarcoma-associated herpesvirus (KSHV) latency-associated nuclear antigen (LANA) is a 1,162-amino-acid protein that mediates the maintenance of episomal viral genomes in latently infected cells. The two central components of episome persistence are DNA replication with each cell division and the segregation of DNA to progeny nuclei. LANA self-associates to bind KSHV terminal-repeat (TR) DNA and to mediate its replication. LANA also simultaneously binds to TR DNA and mitotic chromosomes to mediate the segregation of episomes to daughter nuclei. The N-terminal region of LANA binds histones H2A and H2B to attach to mitotic chromosomes, while the C-terminal region binds TR DNA and also associates with chromosomes. Both the N- and C-terminal regions of LANA are essential for episome persistence. We recently showed that deletion of all internal LANA sequences results in highly deficient episome maintenance. Here we assess independent internal LANA regions for effects on episome persistence. We generated a panel of LANA mutants that included deletions in the large internal repeat region and in the unique internal sequence. All mutants contained the essential N- and C-terminal regions, and as expected, all maintained the ability to associate with mitotic chromosomes in a wild-type fashion and to bind TR DNA, as assessed by electrophoretic mobility shift assays (EMSA). Deletion of the internal regions did not reduce the half-life of LANA. Notably, deletions within either the repeat elements or the unique sequence resulted in deficiencies in DNA replication. However, only the unique internal sequence exerted effects on the ability of LANA to retain green fluorescent protein (GFP) expression from TR-containing episomes deficient in DNA replication, consistent with a role in episome segregation; this region did not independently associate with mitotic chromosomes. All mutants were deficient in episome persistence, and the deficiencies ranged from minor to severe. Mutants deficient in DNA replication that contained deletions within the unique internal sequence had the most-severe deficits. These data suggest that internal LANA regions exert critical roles in LANA-mediated DNA replication, segregation, and episome persistence, likely through interactions with key host cell factors.


Figures

Fig 1
Fig 1
Schematic diagram of KSHV LANA and LANA deletion mutants. Indicated are the proline-rich region (P), the aspartate and glutamate (DE), glutamine (Q), and glutamate and glutamine (EQE) regions, and the putative leucine zipper (LZ). The DE, Q, EQE, and LZ regions all contain repeat elements. The shaded area represents region I of the N-terminal nuclear localization signal (NLS) within amino acids 24 to 30 (20, 69). The C-terminal portion of LANA can also localize to nuclei, but an NLS has not been precisely mapped. Amino acids 5 to 13 mediate chromosome association through interaction with histones H2A/H2B. Amino acids 996 to 1139 contain TR DNA binding, self-association, and chromosome association functions. The capabilities for TR DNA binding, mitotic chromosome association, DNA replication, DNA segregation (as suggested by retention of p2TR-ΔRE-GFP), and episome persistence for each of the constructs are shown on the right. For episome persistence, fractions indicate the number of G418-resistant cell lines with episomes divided by the total number of G418-resistant cell lines assayed by Gardella analysis; percentages are given in parentheses. Fold deficiencies in episome maintenance ability were determined by dividing the value for each mutant in Table 1 by that for WT LANA. NT, not tested. LANA deletion mutants marked with asterisks, and their abilities to bind TR DNA, associate with chromosomes, and maintain p8TR episomes, have been described previously (28), but their TR DNA replication and segregation capabilities were further investigated here.
Fig 2
Fig 2
LANA and LANA deletion mutants associate with mitotic chromosomes, with preferential localization to areas near centromeres and telomeres. BJAB cells alone and BJAB cells stably expressing different LANA mutants were arrested in metaphase with colcemid and were analyzed for LANA localization by confocal microscopy. LANA (green) was detected with an antibody against LANA or against the T7 epitope tag. Chromosomes were counterstained with propidium iodide (red). The overlay of green and red results in yellow. White arrowheads and arrows indicate pericentromeric and peritelomeric localization of LANA, respectively. Brightness and contrast were similarly adjusted for the panels, and individual panels were uniformly adjusted using Adobe Photoshop. Magnification, ×630.
Fig 3
Fig 3
Deletion of internal regions of LANA does not abolish TR DNA binding as assessed by EMSA. A radiolabeled TR DNA probe was incubated with rabbit reticulocyte lysate (RRL) (lanes 1 and 7) or similar amounts (as detected by Western blotting) of in vitro-translated LANA (lanes 2 and 8), LANAΔ465-497 (lane 3), LANAΔ33-273 (lane 4), LANAΔ33-495 (lane 5), LANAΔ465-929 (lane 6), or LANAΔ264-929 (lane 9). After incubation, complexes were resolved on a nondenaturing polyacrylamide gel. Brightness and contrast were uniformly adjusted with Adobe Photoshop. All panels are from the same gel. Arrows indicate LANA-TR or mutated LANA-TR complexes. O, gel origin.
Fig 4
Fig 4
Deletion of internal LANA regions does not reduce the half-life of LANA. Cells were treated with cycloheximide to arrest protein synthesis, and LANA levels were assessed by immunoblotting. (A) Results for BCBL-1 cells (∼1.5 × 10⁵ cells loaded per lane) and for Louckes cells (∼3 × 10⁵ cells loaded per lane) transfected with LANA, LANAΔ33-273, LANAΔ33-495, LANAΔ465-929, LANAΔ332-929, LANAΔ264-929, LANAΔ33-888, LANAΔ33-929, or LANAΔ33-949 are shown at time zero and at serial time points after cycloheximide arrest. Untransfected cells (not transf.) show a comigrating cross-reactive band with LANAΔ264-929. LANA was detected with affinity-purified antibody directed against the C-terminal region of LANA. Tubulin immunoblots are shown below each panel. (B) c-Myc was detected in the same cells as those used for panel A at time zero and at serial time points in order to assess the evidence for effective cycloheximide arrest. Results for untransfected cells are also shown. Tubulin blots are shown below each panel.
Fig 5
Fig 5
Deletion of internal LANA regions results in decreased DNA replication. (A and B) BJAB cells alone or BJAB cells stably expressing LANA or different LANA deletion mutants were transfected with p8TR-gB, which contains 8 copies of the TR. Hirt DNA was isolated at 24 h posttransfection for the assessment of transfection efficiencies and again at 72 h posttransfection for the assessment of replicated DNA. The amounts of p8TR-gB present in the Hirt DNA samples were quantified by real-time PCR. To normalize for transfection efficiencies, the amount of p8TR-gB detected in the samples at 24 h posttransfection was divided by the amount detected in BJAB control cells, and that result was termed the ratio of normalization. These values were close to 1. To normalize the amount of replicated p8TR-gB, the amount of replicated p8TR DNA detected at 72 h was divided by the corresponding ratio of normalization for each mutant. To calculate the fold p8TR-gB replication relative to the negative control (BJAB cells), the normalized replication of the samples was divided by the normalized replication detected for the BJAB control cells. The results represent averages for 4 experiments. (C) Western blotting of BJAB cells alone or BJAB cells expressing LANA or LANA mutants at the time of DNA replication. (Left) Anti-T7 epitope blot. Approximately 3.5 × 10⁵ cells were loaded per lane. NSB, nonspecific band. Asterisks indicate WT LANA and full-length LANAΔ33-888 bands. (Right) Anti-LANA blot of LANA and LANAΔ465-497. Approximately 1.5 × 10⁵ cells were loaded per lane. Brightness and contrast within each panel were uniformly adjusted with Adobe Photoshop. Deletions of the central repeat regions result in increased LANA expression (28, 39).
Fig 6
Fig 6
The unique internal LANA sequence is important for the retention of GFP expression from episomal TR-containing DNA. (A) Ten million BJAB cells alone or BJAB cells stably expressing LANA or the different LANA deletion mutants were transfected with 5 × 10¹⁰ copies (5,000 copies per cell) of p2TR-GFP. Eighteen to 20 h posttransfection, cells were sorted for GFP expression and were seeded at similar densities. GFP expression was monitored daily by FACS for 14 days. To account for some small differences in cell growth after sorting, GFP expression was compared at a time point when cells had reached a concentration e1.5 times that at day 1 of seeding. P values for comparisons between the indicated groups are shown. (B) Cell lines were assessed as for panel A but were initially transfected with p2TR-ΔRE-GFP, which is identical to p2TR-GFP except for deletion of the RE, abolishing LANA-mediated DNA replication. GFP expression was monitored for 7 days. The results in panels A and B are each from six experiments. (C) Western blotting of BJAB cells alone or BJAB cells expressing LANA or LANA mutants at the time of DNA segregation. (Left) (Top) Anti-T7 epitope blot; (bottom) anti-tubulin blot. (Right) Anti-LANA blot. Brightness and contrast were uniformly adjusted within each panel with Adobe Photoshop. Approximately 3.5 × 10⁵ cells were loaded per lane for the anti-T7 and anti-tubulin blots, and ∼1.0 × 10⁵ cells were loaded per lane for the anti-LANA blot. (D) GFP NLS, GFP LANA 1-32, GFP LANA 1-331, GFP LANA 1-331 GMR, and GFP LANA 33-331 were each expressed in BJAB cells. Cells were arrested in metaphase with colcemid. GFP is green, and chromosomes were counterstained with propidium iodide (red). The overlay of green and red generates yellow. Brightness and contrast in individual panels were uniformly adjusted using Adobe Photoshop. Magnification, ×630.
Fig 7
Fig 7
LANA mutants have differing levels of episome maintenance deficiencies as assessed by Gardella gel analyses. BJAB cells alone, or BJAB cells stably expressing LANA or LANA deletion mutants, were transfected with p8TR. Seventy-two hours posttransfection, cells were seeded in 96-well plates and were selected for G418 resistance. Gardella cell analysis was performed to detect p8TR episomes from G418-resistant cell lines expanded from the microtiter plates. Approximately 1 × 10⁶ cells were loaded per lane in Gardella gels. (A) Gardella gel containing a naked p8TR plasmid (lane 1), BCBL-1 cells (a KSHV-infected primary effusion lymphoma cell line) (lane 2), p8TR-transfected, G418-resistant BJAB cells (lanes 3 and 4), or BJAB cells stably expressing LANA (lanes 5 and-6), LANAΔ465-497 (lanes 7 to 10), LANAΔ465-929 (lanes 11 to 14), LANAΔ33-273 (lanes 15 to 18), or LANAΔ33-495 (lanes 19 to 22). Vertical lines (lanes 20 and 22) indicate a faint episomal signal. The gel origin (O), BCBL-1 episomal (E) and linear (L) forms (linear due to lytic replication), and p8TR covalently closed circular (ccc) DNA and nicked (N) DNA are indicated. Gardella gel analysis was performed after 24 days of G418 selection. (B) Gardella gel with BCBL-1 cells (lane 1), naked p8TR plasmid (lane 2), p8TR-transfected, G418-resistant BJAB cells (lanes 3 and 4), or BJAB cells stably expressing LANA (lanes 5 to 7) or LANAΔ332-929 (lanes 8 to 15). Gardella gel analysis was performed after 34 days of G418 selection. (C) Gardella gel with BCBL-1 cells (lane 1), naked p8TR plasmid (lane 2), p8TR-transfected, G418-resistant BJAB cells (lanes 3 and 4), or BJAB cells stably expressing LANA (lanes 5 to 7) or LANAΔ264-929 (lanes 8 to 13). Gardella gel analysis was performed after 36 days of selection. (D to F) Immunoblot analyses for LANA or LANA mutants expressed in G418-resistant cell lines used in Gardella gel analyses. Panels D to F correspond to panels A to C, respectively. LANA was detected using an anti-T7 monoclonal antibody or an anti-LANA antibody. Approximately 3.5 × 10⁵ cells were loaded per lane for anti-T7 blots and ∼1.5 × 10⁵ cells per lane for the anti-LANA blot. Asterisks indicate LANAΔ332-929 or LANA bands. Brightness and contrast in individual panels were uniformly adjusted using Adobe Photoshop. Lowercase letters indicate individually selected G418-resistant cell lines. NSB, nonspecific bands.
Fig 8
Fig 8
LANAΔ465-929 and LANAΔ332-929 exhibit deficiencies in limiting-dilution outgrowth after TR DNA transfection and G418 selection. (A) BJAB cells alone and BJAB cells stably expressing LANA or LANAΔ465-497 were transfected with plasmid p8TR and were seeded in 96-well plates at different cell concentrations. Well outgrowth was recorded at 20 days under G418 selection. Values are averages for 3 experiments; error bars indicate standard deviations. (B) Limiting-dilution assay for BJAB cells alone and BJAB cells stably expressing LANA, LANAΔ465-929, or LANAΔ332-929 after p8TR transfection and G418 selection. (C) Cells stably expressing LANAΔ465-929 or LANAΔ332-929 were assessed for rates of G418-resistant outgrowth after plating at different cell concentrations. Shown are the numbers of days necessary for sufficient G418-resistant outgrowth to allow the expansion of at least half of the positive wells in 96-well plates to 24-well plates.

Similar articles

Cited by

References

    1. Cesarman E, Moore PS, Rao PH, Inghirami G, Knowles DM, Chang Y. 1995. In vitro establishment and characterization of two acquired immunodeficiency syndrome-related lymphoma cell lines (BC-1 and BC-2) containing Kaposi's sarcoma-associated herpesvirus-like (KSHV) DNA sequences. Blood 86:2708–2714 - PubMed
    1. Chang Y, Cesarman E, Pessin MS, Lee F, Culpepper J, Knowles DM, Moore PS. 1994. Identification of herpesvirus-like DNA sequences in AIDS-associated Kaposi's sarcoma. Science 266:1865–1869 - PubMed
    1. Moore PS, Chang Y. 1995. Detection of herpesvirus-like DNA sequences in Kaposi's sarcoma in patients with and without HIV infection. N. Engl. J. Med. 332:1181–1185 - PubMed
    1. Soulier J, Grollet L, Oksenhendler E, Cacoub P, Cazals-Hatem D, Babinet P, d'Agay MF, Clauvel JP, Raphael M, Degos L, Sigaux F. 1995. Kaposi's sarcoma-associated herpesvirus-like DNA sequences in multicentric Castleman's disease. Blood 86:1276–1280 - PubMed
    1. Decker LL, Shankar P, Khan G, Freeman RB, Dezube BJ, Lieberman J, Thorley-Lawson DA. 1996. The Kaposi sarcoma-associated herpesvirus (KSHV) is present as an intact latent genome in KS tissue but replicates in the peripheral blood mononuclear cells of KS patients. J. Exp. Med. 184:283–288 - PMC - PubMed

Publication types

MeSH terms

LinkOut - more resources