. 2013 Nov;24(21):3435-48.
doi: 10.1091/mbc.E12-06-0445. Epub 2013 Sep 4.

Endosomal acidification by Na+/H+ exchanger NHE5 regulates TrkA cell-surface targeting and NGF-induced PI3K signaling

Affiliations

Endosomal acidification by Na+/H+ exchanger NHE5 regulates TrkA cell-surface targeting and NGF-induced PI3K signaling

Graham H Diering et al. Mol Biol Cell. 2013 Nov.

Abstract

To facilitate polarized vesicular trafficking and signal transduction, neuronal endosomes have evolved sophisticated mechanisms for pH homeostasis. NHE5 is a member of the Na(+)/H(+) exchanger family and is abundantly expressed in neurons and associates with recycling endosomes. Here we show that NHE5 potently acidifies recycling endosomes in PC12 cells. NHE5 depletion by plasmid-based short hairpin RNA significantly reduces cell surface abundance of TrkA, an effect similar to that observed after treatment with the V-ATPase inhibitor bafilomycin. A series of cell-surface biotinylation experiments suggests that anterograde trafficking of TrkA from recycling endosomes to plasma membrane is the likeliest target affected by NHE5 depletion. NHE5 knockdown reduces phosphorylation of Akt and Erk1/2 and impairs neurite outgrowth in response to nerve growth factor (NGF) treatment. Of interest, although both phosphoinositide 3-kinase-Akt and Erk signaling are activated by NGF-TrkA, NGF-induced Akt-phosphorylation appears to be more sensitively affected by perturbed endosomal pH. Furthermore, NHE5 depletion in rat cortical neurons in primary culture also inhibits neurite formation. These results collectively suggest that endosomal pH modulates trafficking of Trk-family receptor tyrosine kinases, neurotrophin signaling, and possibly neuronal differentiation.


Figures

FIGURE 1:
FIGURE 1:
NHE5 is not functional on the plasma membrane in resting PC12 cells. (A) PC12 cells were treated with a cell-surface biotinylating agent. Biotinylated cell-surface proteins were purified by affinity trap with NeutrAvidin beads. Total lysate (Lysate) and biotinylated proteins eluted from the beads (Surface) were resolved in SDS–PAGE and immunoblotted with the indicated antibodies. Lysate protein fractions represent 10% of the protein loaded in the surface fraction. (B) Cells loaded with BCECF were subjected to cytosolic acidification by briefly exposing cells to NH4Cl followed by washout with NaCl-free solution. NHE activity was induced by reintroducing the Na+-containing solution in the absence or presence of the NHE1-specific inhibitor cariporide (10 μM). No recovery from the internal acid load was observed in the presence of cariporide, indicating that NHE1 is the only functional NHE on the plasma membrane in PC12 cells. Records represent pHi measurements obtained simultaneously from 40 control and 34 cariporide-treated cells and are representative of three independent experiments under each condition.
FIGURE 2:
FIGURE 2:
NHE5 is potent acidifier of recycling endosomes. (A) Endosomal pH in control PC12 cells and shNHE5 cells in the presence or absence of bafilomycin treatment. A mixture of fluorescein-conjugated (pH-sensitive) and Alexa Fluor 568–conjugated (pH-insensitive) transferrin was used as a ratiometric recycling endosomal pH reporter. N = 100–200 cells per condition. Error bars represent SEM, **p < 0.01 (Student's t test). (B) A set of representative live-cell images used for pH measurement experiments. Fluorescence signals for transferrin associated with perinuclear structures (arrowheads) were captured under live-cell confocal imaging and analyzed for pH determination (see Materials and Methods). Scale bar, 10 μm. (C) Double immunofluorescence labeling of transferrin and endosomal markers. PC12 cells were treated with Alexa Fluor 568–conjugated transferrin and subjected to chase incubation under the same condition as in A and B. Rab11 antibody, heterologously expressed mCherry-tagged Rab5, and mCherry-tagged Rab7 were used to visualize recycling and early and late endosomes, respectively. Scale bars, 10 μm.
FIGURE 3:
FIGURE 3:
Intracellular localization of TrkA and NHE5. (A) Double immunofluorescence microscopy of TrkA (green) and EEA1 (red) or Rab11 (red) in PC12 control cells (PC12) and PC12 cells stably expressing shRNA for NHE5 (shNHE5). Fixed cells were treated with rabbit polyclonal anti-TrkA antibody and mouse monoclonal anti-EEA1 antibody or anti-Rab11 antibody. Alexa Fluor 488–conjugated goat anti-mouse and Alexa Fluor 568–conjugated goat anti-rabbit antibodies were used to visualize the signals. (B) Double immunofluorescence microscopy of NHE5 (green) and TrkA (red) in PC12 cells. Fixed cells were treated with rabbit polyclonal anti-NHE5 antibody and mouse monoclonal anti-TrkA antibody to visualize the endogenous protein localization. Scale bars, 10 μm.
FIGURE 4:
FIGURE 4:
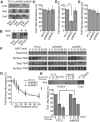
NHE5 knockdown affects TrkA steady-state surface abundance but not NGF-induced internalization. (A–E) Control PC12 cells (PC12) and PC12 cells stably expressing shRNAs against NHE5 (shNHE5) or NHE1 (shNHE1) were incubated with a cell-surface biotinylation reagent, and total and cell-surface TrkA, NKA, or TfnR were detected by Western blot. Western blot shown in A is representative of three independent experiments. (B) No-biotin control confirmed that there was no fraction being pulled down nonspecifically. The intensity of the bands was determined by densitometry, and the data represent the mean ± SEM of relative levels of total TrkA (C), cell-surface TrkA (D), and TfnR (E) of at least three experiments. **p < 0.01 (paired Student's t test compared with control). (F, G) Cells were serum starved overnight and then treated with 50 ng/ml NGF as indicated, and the total and cell-surface abundance of TrkA, as well as of TfnR, at each time point were determined. Western blots shown are representative of three independent experiments. (G) Relative NGF-induced TrkA endocytosis was measured by quantifying the TrkA cell-surface abundance at various times after NGF treatment. The rate of TrkA endocytosis was not different between the cell lines tested. Error bars represent SEM. (H, I) After surface biotinylation, cells were incubated for 60 min at 37°C. Biotin remaining on cell-surface proteins was removed by glutathione, and then cells were subjected to the second incubation with NGF (50 ng/ml) at 37°C for 0, 15, or 30 min and treated with glutathione to remove biotin from the proteins recycled back to the plasma membrane, and relative TrkA abundance was determined. For pull down, 130 and 400 μg of total protein were used for PC12 and shNHE5 cells, respectively. The densitometry data of relative levels of total TrkA are presented with mean ± SEM. *p < 0.05 (paired Student's t test, n = 6 experiments).
FIGURE 5:
FIGURE 5:
Bafilomycin treatment reduces TrkA surface levels. (A) Serum-starved PC12 cells were incubated with bafilomycin A1 (250 nM) for the times indicated, and cell-surface TrkA or TfnR was detected by surface biotinylation assay. (B) TrkA or TfnR cell-surface abundance was determined by densitometry, and relative intensities were calculated. N = 3; error bars represent SEM; **p < 0.01 (Student's t test) for difference from untreated cells (time 0).
FIGURE 6:
FIGURE 6:
NHE5 knockdown affects NGF signaling. (A–D) Control PC12, shNHE5, and shNHE1 cells were serum starved overnight and then treated with 50 ng/ml NGF for the indicated times. The amounts of phosphorylated and total Akt and Erk1/2 were detected by Western blot (A and B, respectively). Representative Western blots are shown. The experiments were repeated three times, and the intensities of the bands were determined by densitometry. The relative levels of phospho-Akt (C) and phospho-Erk1/2 (D) are expressed as means ± SEM.
FIGURE 7:
FIGURE 7:
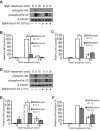
Bafilomycin A1 treatment affects NGF-TrkA signaling. Serum-starved PC12 cells were incubated in the absence (–) or presence (+) of 250 nM bafilomycin A1 for 6 h (A) or 1 h (D), and cells were stimulated with NGF (50 ng/ml) for the indicated periods. Whole-cell lysates (5 μg of protein) were subjected to SDS–PAGE and probed with anti–phospho-Akt, anti–phospho-Erk1/2, and anti–β-tubulin antibodies. Levels of phospho-Akt (B, E) and phospho-Erk1/2 (C, F) were quantified by densitometry and expressed as relative values to these observed at 5 min of NGF treatment in bafilomycin A1–untreated cells. Representative Western blots are shown in A and D. Densitometric data summarize three independent experiments and are presented as mean ± SEM. *p < 0.05, **p < 0.01 (paired Student's t test).
FIGURE 8:
FIGURE 8:
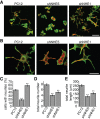
NHE5 modulates NGF-induced neurite growth in PC12 cells. (A, B) Control PC12 cells or PC12 cells stably expressing NHE5 shRNA (shNHE5) or NHE1 shRNA (shNHE1) were treated with 50 ng/ml NGF for 72 h to induce differentiation. Cells were labeled to visualize actin (green) and tubulin (red). Scale bars, 100 μm (A), 40 μm (B). (C) The percentage of cells in the population that formed at least one neurite ≥15 μm in length. In all cases N = 1700–1800 cells; error bars represent SEM; **p < 0.01 (Student's t test) for difference from control cells. (D, E) Mean total neurite number (D) and length (E) in individual cells that had clearly differentiated (at least one neurite ≥15 μm in length). Under each condition N ≥ 80 cells.
FIGURE 9:
FIGURE 9:
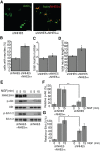
Stable expression of NHE536HA reverses phenotypes of NHE5-deficient PC12 cells. (A) NGF-induced neurite outgrowth phenotype of shNHE5 cells stably expressing control vector or shRNA-resistant, HA-tagged human NHE5 (NHE536HA). Anti-HA antibody (red) and fluorescently labeled phalloidin (green) were used to visualize F-actin and NHE5, respectively. Scale bar, 50 μm. The percentage of cells with at least one neurite extension (B), mean total neurite number (C), and length (D) in individual cells that had clearly differentiated (at least one neurite ≥15 μm in length). N ≥ 150 cells in each cell type per experiment; error bars represent SEM of n = 3 experiments; *p < 0.05 (paired Student's t test) for difference from control cells. (E, F) shNHE5 cells stably expressing control vector or shRNA-resistant, HA-tagged human NHE5 (NHE536HA) were serum starved overnight and then treated with 50 ng/ml NGF for the indicated times. The amounts of phosphorylated and total Akt and Erk1/2 were detected by Western blot. (E) Representative Western blots. The experiments were repeated three times, and the intensities of the bands were determined by densitometry. The relative levels of phospho-Akt (F) and phospho-Erk1/2 (G) are expressed as means ± SEM.
FIGURE 10:
FIGURE 10:
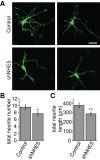
NHE5 participates in neurite growth in primary cortical neurons. (A–C) Primary rat cortical neurons (E18) were transfected with control plasmid or plasmid encoding shRNA against NHE5, both of which also express GFP. Transfected neurons were imaged by confocal microscopy at 4 d in vitro. (A) Two examples of each transfection. Scale bar, 25 μm. Total neurite number (B) and cumulative length (C) per cell. N = 34 control and 38 shNHE5 cells. Error bars represent SEM. *p < 0.05, **p < 0.01, by paired Student's t test.

Similar articles

Cited by

References

    1. Arimura N, et al. Anterograde transport of TrkB in axons is mediated by direct interaction with Slp1 and Rab27. Dev Cell. 2009;16:675–686. - PubMed
    1. Arimura N, Kaibuchi K. Neuronal polarity: from extracellular signals to intracellular mechanisms. Nat Rev Neurosci. 2007;8:194–205. - PubMed
    1. Ascano M, Richmond A, Borden P, Kuruvilla R. Axonal targeting of Trk receptors via transcytosis regulates sensitivity to neurotrophin responses. J Neurosci. 2009;29:11674–11685. - PMC - PubMed
    1. Attaphitaya S, Park K, Melvin JE. Molecular cloning and functional expression of a rat Na+/H+ exchanger (NHE5) highly expressed in brain. J Biol Chem. 1999;274:4383–4388. - PubMed
    1. Baass PC, Di Guglielmo GM, Authier F, Posner BI, Bergeron JJ. Compartmentalized signal transduction by receptor tyrosine kinases. Trends Cell Biol. 1995;5:465–470. - PubMed

Publication types

MeSH terms