. 2013 Nov;24(21):3337-49.
doi: 10.1091/mbc.E13-05-0253. Epub 2013 Sep 4.

Mzt1/Tam4, a fission yeast MOZART1 homologue, is an essential component of the γ-tubulin complex and directly interacts with GCP3(Alp6)

Affiliations

Mzt1/Tam4, a fission yeast MOZART1 homologue, is an essential component of the γ-tubulin complex and directly interacts with GCP3(Alp6)

Deepsharan K Dhani et al. Mol Biol Cell. 2013 Nov.

Abstract

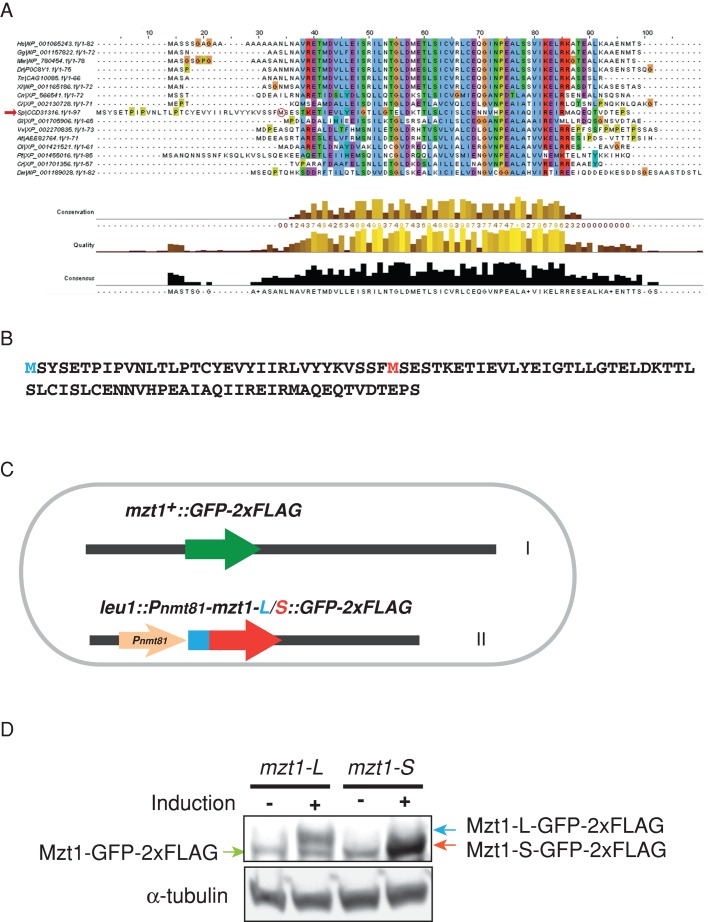
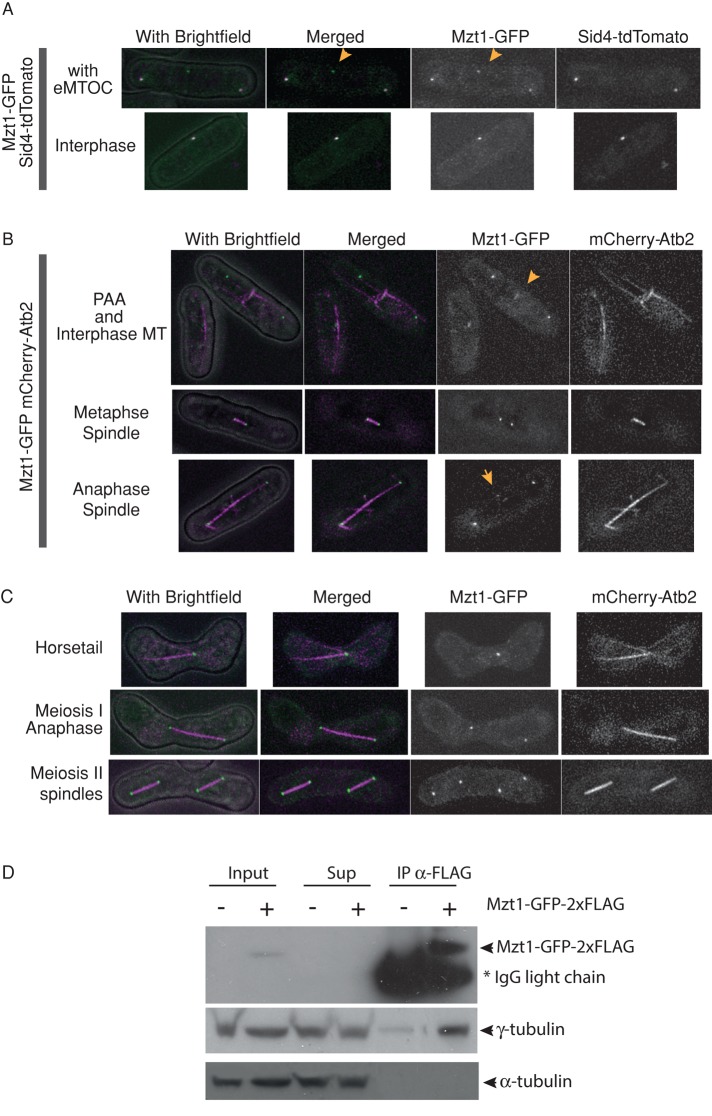
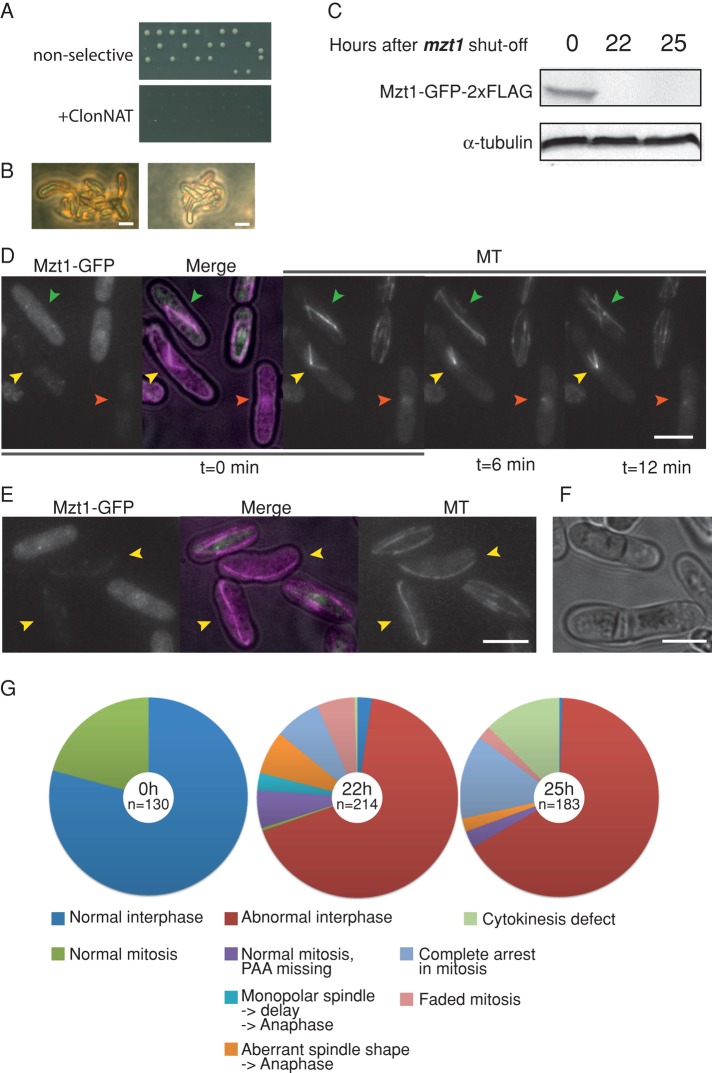
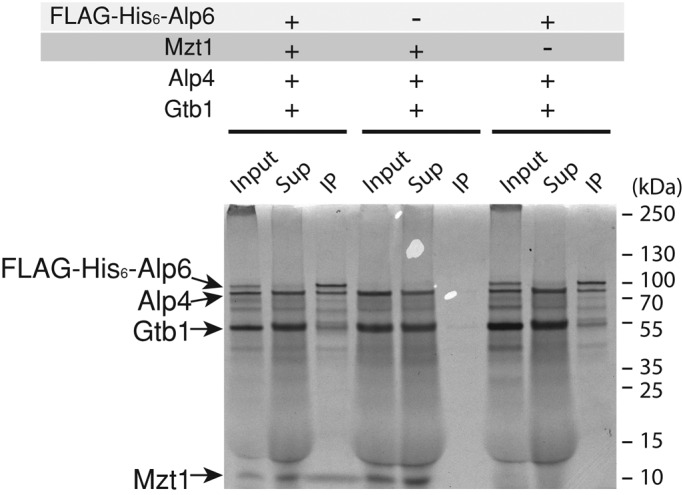
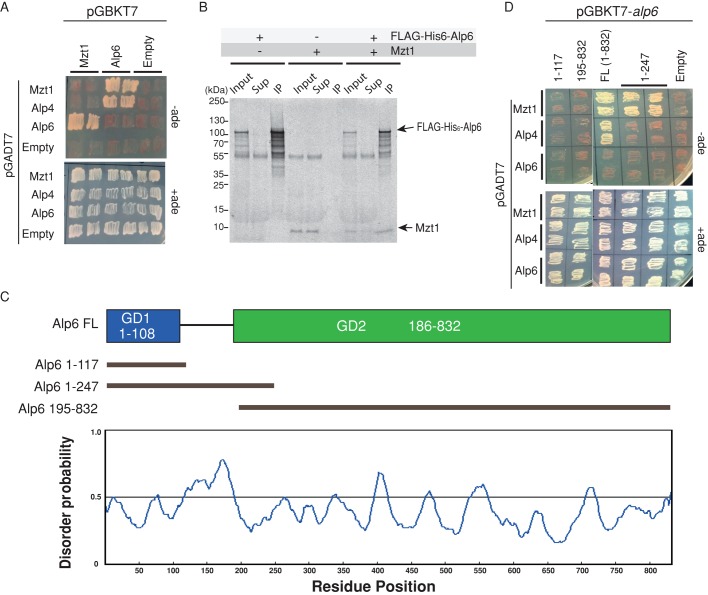
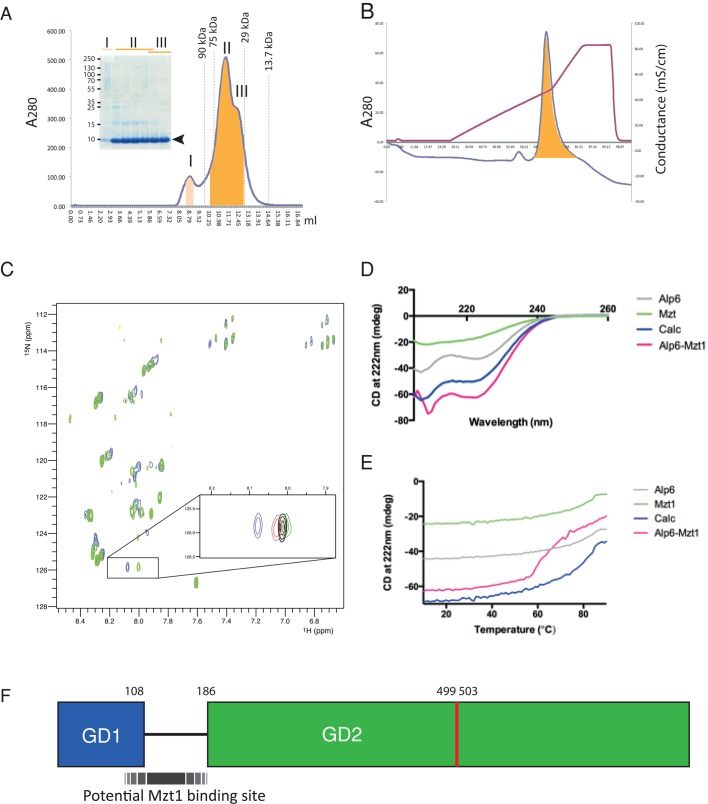
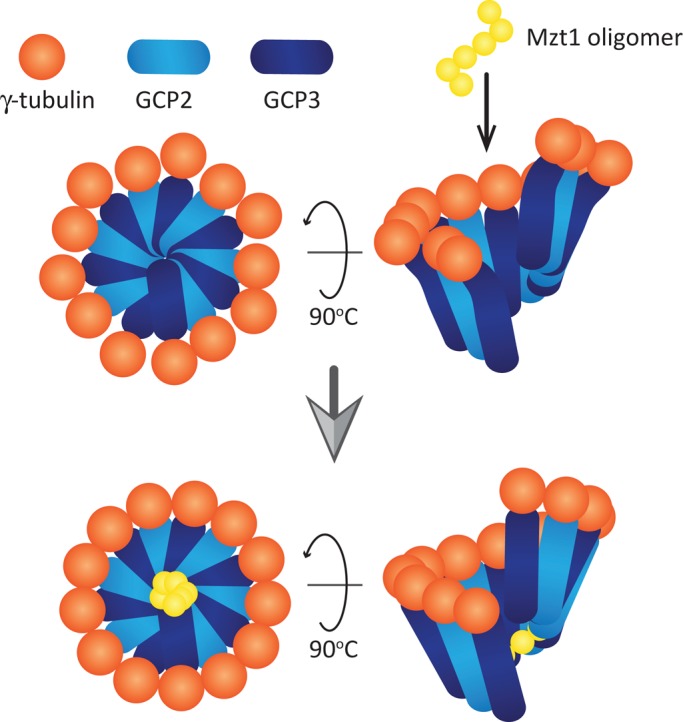
In humans, MOZART1 plays an essential role in mitotic spindle formation as a component of the γ-tubulin ring complex. We report that the fission yeast homologue of MOZART1, Mzt1/Tam4, is located at microtubule-organizing centers (MTOCs) and coimmunoprecipitates with γ-tubulin Gtb1 from cell extracts. We show that mzt1/tam4 is an essential gene in fission yeast, encoding a 64-amino acid peptide, depletion of which leads to aberrant microtubule structure, including malformed mitotic spindles and impaired interphase microtubule array. Mzt1/Tam4 depletion also causes cytokinesis defects, suggesting a role of the γ-tubulin complex in the regulation of cytokinesis. Yeast two-hybrid analysis shows that Mzt1/Tam4 forms a complex with Alp6, a fission yeast homologue of γ-tubulin complex protein 3 (GCP3). Biophysical methods demonstrate that there is a direct interaction between recombinant Mzt1/Tam4 and the N-terminal region of GCP3(Alp6). Together our results suggest that Mzt1/Tam4 contributes to the MTOC function through regulation of GCP3(Alp6).


Figures

FIGURE 1:
FIGURE 1:
Identification of the Mzt1 initiation methionine. (A) Primary structure of fission yeast Mzt1. CLUSTALW multiple sequence alignment of predicted orthologues of human MOZART1. Fission yeast S. pombe Mzt1 is indicated with a red arrow. Species abbreviations are as follows: Hs, Homo sapiens; Gg, Gallus gallus; Mm, Mus musculus; Dr, Danio rerio; Tn, Tetraodon nigroviridis; Xt, Xenopus tropicalis; Cn, Cryptococcus neoformans; Ci, Ciona intestinalis; Sp, S. pombe; Gl, Giardia lamblia; At, Arabidopsis thaliana; Ol, Ostreococcus lucimarinus; Pt, Paramecium tetraurelia; Cr, Chlamydomonas reinhardtii; Dm, Drosophila melanogaster. (B) Two potential initiation methionines in the predicted Mzt1 ORF. Methionine in blue is the initiation methionine for the long Mzt1 sequence (mzt1-L) predicted by Hutchins et al. (2010). Methionine in red is the physiological initiation methionine for the short Mzt1 sequence (mzt1-S). (C) Schematic of the strain (KT3519 and KT3522) used to determine the initiation methionine of Mzt1. The mzt1 gene is tagged with GFP-2xFLAG at its endogenous locus, which is located on chromosome I. The mzt1-S or mzt1-L tagged with GFP-2×FLAG was integrated at the leu1+ locus (chromosome II) under the inducible nmt81 promoter. (D) The yeast strains KT3519 and KT3522, harboring mzt1-S or -L tagged with GFP-2xFLAG at the leu1+ gene locus, under the nmt81 promoter and mzt1-GFP-2xFLAG at its endogenous locus, were grown in the absence (–) or presence (+) of thiamine, which acts to repress the nmt81 promoter. Denatured whole-cell extracts were prepared from these cells, which were subjected to Western blotting. Monoclonal anti-FLAG antibody was used to probe for GFP-tagged Mzt1. α-Tubulin was used as a reference for loading. The blot shows that in the noninduced lanes (–), the bands present correspond to the Mzt1-S.
FIGURE 2:
FIGURE 2:
Mzt1 localizes to the MTOCs and associates with γ-tubulin. (A) Localization of Mzt1 during the vegetative cell cycle in relation to the SPB component Sid4. Mzt1-GFP and Sid4-tdTomato signals were simultaneously observed using a confocal microscope. Mzt1 is tagged with GFP-2xFLAG in a cell that harbors tdTomato-tagged Sid4, an SPB component. Mzt1-GFP signal colocalizes with the Sid4-tdTomato signal that represents the SPB (top and bottom A cell that is forming septum (top) carries eMTOC, where Sid4-tdTomato signal is missing but Mzt1-GFP signal is found (yellow arrows). (B) Localization of Mzt1 during the vegetative cell cycle in relation to the MT structure. Fluorescence signals of Mzt1-GFP and mCherry-tagged α-tubulin, mCherry-Atb2, were simultaneously observed using a confocal microscope. Yellow arrows indicate Mzt1-GFP signals at the eMTOC. (C) Localization of Mzt1 during meiotic differentiation. Mzt1-GFP and mCherry-Atb2 signals were simultaneously captured using a confocal microscope. Mzt1-GFP signal was found at the MTOC. (D) Mzt1 associates with γ-tubulin. Cell extracts prepared from wild-type strains harboring Mzt1-GFP-2xFLAG (+) or nontagged Mzt1 (–) were subjected to immunoprecipitation (IP) assays with anti-FLAG antibody. The IP complexes were analyzed by Western blotting with antibodies against GFP and γ-tubulin. A high proportion of γ-tubulin is present in the anti-FLAG immunocomplex prepared from Mzt1-GFP-2xFLAG strain. The IgG light chain in the IP complexes detected by the secondary antibodies is indicated by asterisk.
FIGURE 3:
FIGURE 3:
Mzt1 is essential, and its depletion causes abnormal MT organization and cytokinesis defect. (A) Tetrad analysis of KT3449 (h90/h90 mzt1+/mzt1::ClonNAT). Only two viable colonies out of four tetrad progenies emerged. These viable colonies are ClonNAT sensitive. (B) Those that did not form viable colonies in the tetrad analysis formed microcolonies of ∼10–30 cells that show bent-cell morphology. Scale bar, 10 μm. (C) A Mzt1 shut-off strain KT3711 that also harbors mCherry-atb2 was first cultured in the MM media in the absence of thiamine to allow expression of Mzt1-GFP. The culture was then supplemented with thiamine (2 μM), and Mzt1-GFP expression was repressed for 22 and 25 h. Whole-cell extracts were prepared, and the level of Mzt1-GFP was examined by Western blotting with anti-GFP antibody. (D, E) Cells from time 0 and 25 h after Mzt1 depletion were mixed, and mCherry-Atb2 signals were observed. Cells with Mzt1-GFP signals (time-zero sample) did not show MT defects, whereas cells without Mzt1-GFP signal (indicated by yellow and orange arrowheads) showed mitotic spindle formation defects (D) or interphase MT defect (E). In D, an anaphase spindle in a nondepleted cell (green arrowhead) elongated without a delay, whereas a monopolar spindle (yellow arrowhead) did not proceed to anaphase. Cells carrying a mitotic MTOC with very low MTOC activity (orange arrowhead) were also observed. In E, interphase cells devoid of Mzt1-GFP (yellow arrowheads) have fewer MTs, indicating that the iMTOC activity was low in these cells. Scale bar, 10 μm. (F) At 25 h after depletion of Mzt1, cells with aberrant septum started to accumulate. Scale bar, 10 μm. (G) Summary of the Mzt1 depletion phenotypes. Cells depleted of Mzt1 for 0, 22, and 25 h were filmed for 20 min at 1.5-min intervals (representative images in Supplemental Figure S1) and classified into categories as graphically illustrated in Supplemental Figure S2. Longer depletion increased the population of cells with cytokinesis defect.
FIGURE 4:
FIGURE 4:
Mzt1 is not required for the assembly of the γ-TuSC. The ability of Mzt1 to enhance γ-TuSC complex formation was assessed using proteins produced by an in vitro translation system (IVT). The Alp6 was N-terminally tagged with FLAG-His6, and the rest of the components (Alp4, Gtb1, and Mzt1) were untagged. Samples were prepared as a single IVT reaction in order to produce proteins together in the presence of [S35]methionine. These were subjected to immunoprecipitation using an anti-FLAG antibody. The IP complexes were separated using SDS–PAGE and visualized by autoradiography. Thirty-five percent equivalent of cell extracts used for IP samples were loaded as input and supernatant samples. The ratio of Alp6:Alp4:γ-tubulin in the IP complex did not change in the presence or absence of Mzt1.
FIGURE 5:
FIGURE 5:
Mzt1 interacts with the N-terminal end of Alp6. (A) γ-TuC components that directly interact with Mzt1 were explored using yeast 2-hybrid system. Interactions between Mzt1, GCP3Alp6, GCP2Alp4 fused to Gal4 activation domain (pGADT7), and Mzt1 and GCP3Alp6 fused to Gal4 DNA-binding domain (pGBKT7) were assessed using the adenine auxotroph. Cell growth in the absence of adenine indicated positive interaction between the proteins tested. Mzt1 interacted with GCP3Alp6, and GCP3Alp6 showed interaction with Mzt1. When constructs were tested against empty vectors, none showed interaction. Thus all constructs were valid for this assay. (B) Direct interaction between full-length Mzt1 and FLAG-His6-Alp6. The proteins were prepared by the in vitro translation system in the presence of [35S]methionine, followed by immunoprecipitation using an anti-FLAG antibody. The IP complexes were separated using SDS–PAGE and visualized by autoradiography. Twelve percent equivalent of cell extracts used for IP samples were loaded as input and supernatant samples. (C) The Alp6 truncation constructs were generated based on the disorder probability prediction of Alp6 using RONN. Alp6 is highly disordered between residues 120 and 180. Three constructs were designed: 1) 1–117, which consists of the highly ordered, first globular domain (GD1) of Alp6; 2) 1–247, which consists of the GD1 followed by the disordered region; and 3) 196–832, which consists of the larger structured domain (GD2). (D) Mapping of the Mzt1-interacting region of Alp6 with the yeast two-hybrid system. Interactions between the Alp6 regions 1–117, 195–832, full length (1–832), and 1–249 fused to Gal4-binding domain (pGBKT7) and Mzt1 fused to Gal4 activation domain (pGADT7) were assessed using the adenine auxotroph. Cell growth in the absence of Ade indicated a positive interaction between proteins tested. Mzt1 interacted with Alp6 in its region 1–247.
FIGURE 6:
FIGURE 6:
Confirmation of a direct interaction between Mzt1 and Alp61-186. (A) Purification of recombinant 15N-labeled Mzt1 from bacteria cell extracts. Gel filtration chromatography of 15N-Mzt1-His6 on a Superdex 75 10/300 GL column. Molecular weight markers are indicated by dashed lines. Molecular weights of peaks I, II, and III are estimated to be ∼130, 50, and 35 kDa, respectively. Given that the predicted molecular weight of Mzt1-His6 is expected to be 9.1 kDa, peak I may represent dodecamer, peak II heptamer or hexamer, and peak III tetramer or trimer. SDS–PAGE analysis (4–12% gradient gel) confirmed that all eluted peaks were Mzt1-His6 (arrowhead, molecular weight ∼9 kDa). Peaks II and III were combined, buffer exchanged into NMR buffer (20 mM phosphate, 50 mM NaCl, 2 mM DTT, 10% D2O, pH 6.5), and concentrated for NMR. (B) Purification of recombinant nonlabeled Alp61-186 from bacteria cell extracts. Anion exchange chromatography of Alp61-186 (HiTrap Q HP) using a 10 mM to 1 M sodium chloride gradient (purple line). (C) 1H,15N HSQC spectra of 80 μM 15N-labeled Mzt1 in the absence (blue) and presence (green) of 160 μM Alp61-186. Inset, zoomed-in region showing the progressive chemical shift changes upon addition of 40 (red), 80 (black), and 160 μM (green) Alp61-186. The progressive spectral changes on addition of Alp61-186 are indicative of a direct interaction. (D) CD spectra of Mzt1 alone (green), Alp6 alone (gray), and 1:1 complex of Mzt1:Alp6. The complex trace (pink) shows markedly more secondary structure than the summation of the two isolated proteins (blue). (E) Denaturation profiles for Mzt1 alone (green), Alp6 alone (gray), and a 1:1 complex of Mzt1:Alp6 (pink) were measured by monitoring the change in CD at 222 nm with increasing temperature. Neither Mzt1 nor Alp6 alone showed any cooperative unfolding. However, Mzt1 and Alp6 together showed cooperative unfolding, suggesting that they form a complex. This denaturation profile of the complex was significantly different from the calculated profile of the sum of the two individual components (blue). (F) Schematic diagram of Alp6, highlighting the predicted Mzt1-binding region. Whereas recombinant Mzt1 interacts with Alp61-186, yeast two-hybrid analysis shows that Mzt1 fails to interact with Alp61-117. The Mzt1-binding region of GCP3Alp6 is predicted to include the flexible region linking GD1 and GD2 but not the region including the residues (499–503, indicated in red) corresponding to the proposed “hinge” region of human GCP3 (Guillet et al., 2011).
FIGURE 7:
FIGURE 7:
A speculative model for Mzt1 function to activate γ-TuC. Model adapted from the one proposed by Kollman et al. (2011). A ring-like γ-TuSC made of GCP2, GCP3, and γ-tubulin carries 13 γ-tubulins, which are not evenly distributed. Mzt1 oligomer incorporated into the γ-TuC may be recruited to the bottom of the ring-like structure via its interaction with GCP3. The Mzt1 oligomer stabilizes the whole complex, resulting in the 13 γ-tubulin molecules being more evenly distributed and leading to more efficient MT nucleation.

Similar articles

Cited by

References

    1. Anders A, Lourenco PC, Sawin KE. Noncore components of the fission yeast gamma-tubulin complex. Mol Biol Cell. 2006;17:5075–5093. - PMC - PubMed
    1. Bahler J, Wu JQ, Longtine MS, Shah NG, McKenzie A, 3rd., Steever AB, Wach A, Philippsen P, Pringle JR. Heterologous modules for efficient and versatile PCR-based gene targeting in Schizosaccharomyces pombe. Yeast. 1998;14:943–951. - PubMed
    1. Bitton DA, Wood V, Scutt PJ, Grallert A, Yates T, Smith DL, Hagan IM, Miller CJ. Augmented annotation of the Schizosaccharomyces pombe genome reveals additional genes required for growth and viability. Genetics. 2011;187:1207–1217. - PMC - PubMed
    1. Choi YK, Liu P, Sze SK, Dai C, Qi RZ. CDK5RAP2 stimulates microtubule nucleation by the gamma-tubulin ring complex. J Cell Biol. 2010;191:1089–1095. - PMC - PubMed
    1. Choy RM, Kollman JM, Zelter A, Davis TN, Agard DA. Localization and orientation of the gamma-tubulin small complex components using protein tags as labels for single particle EM. J Struct Biol. 2009;168:571–574. - PMC - PubMed

Publication types

MeSH terms