

Meristematic cell proliferation and ribosome biogenesis are decoupled in diamagnetically levitated Arabidopsis seedlings
- PMID: 24006876
- PMCID: PMC3847623
- DOI: 10.1186/1471-2229-13-124
Meristematic cell proliferation and ribosome biogenesis are decoupled in diamagnetically levitated Arabidopsis seedlings
Abstract
Background: Cell growth and cell proliferation are intimately linked in the presence of Earth's gravity, but are decoupled under the microgravity conditions present in orbiting spacecraft. New technologies to simulate microgravity conditions for long-duration experiments, with stable environmental conditions, in Earth-based laboratories are required to further our understanding of the effect of extraterrestrial conditions on the growth, development and health of living matter.
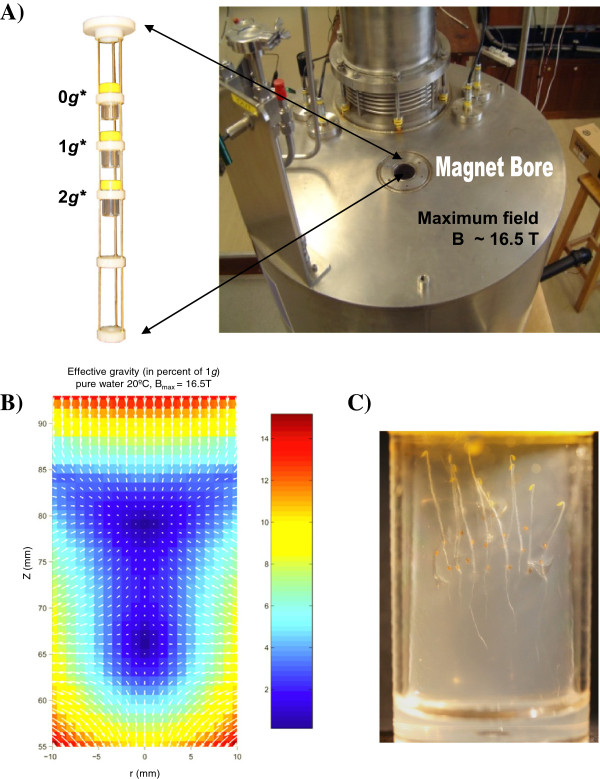
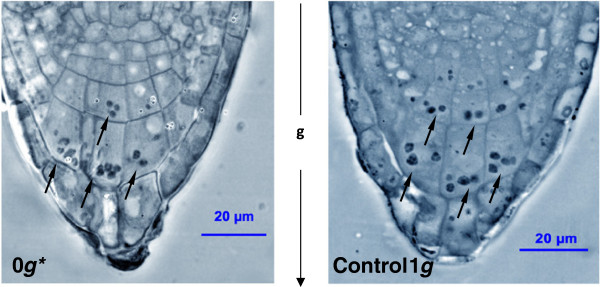
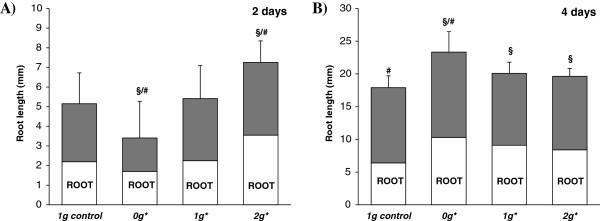
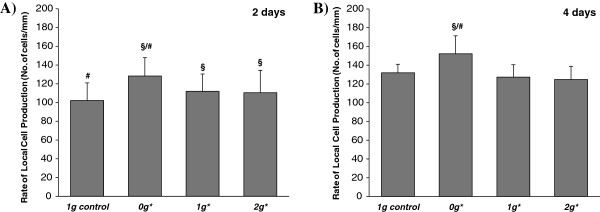
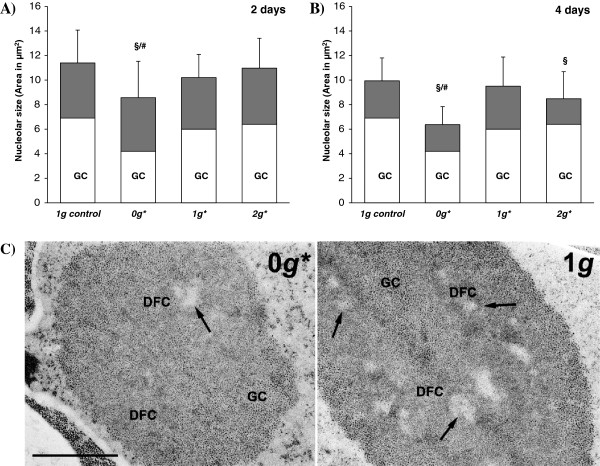
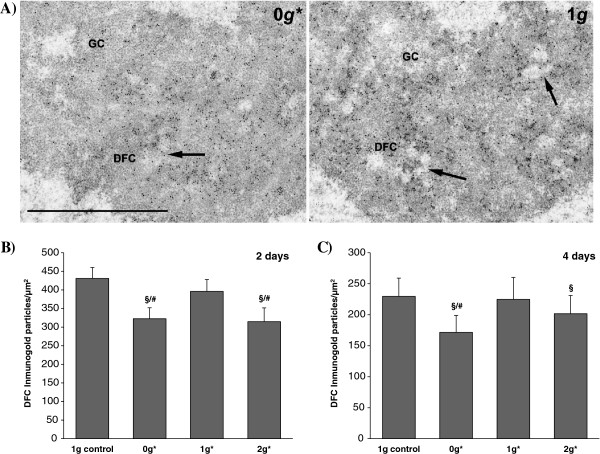
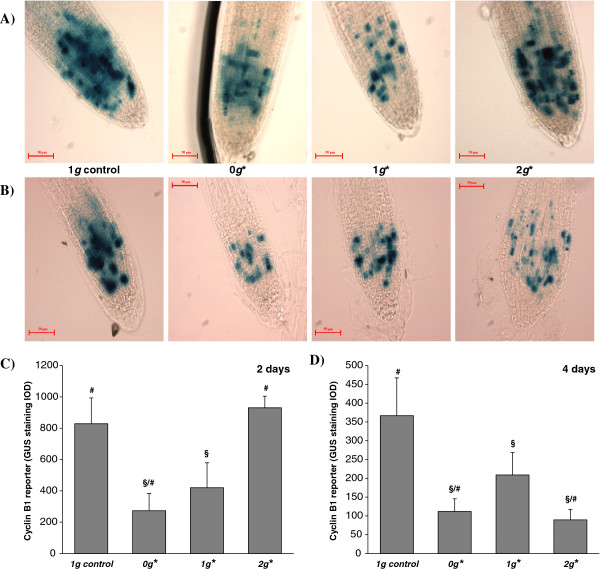
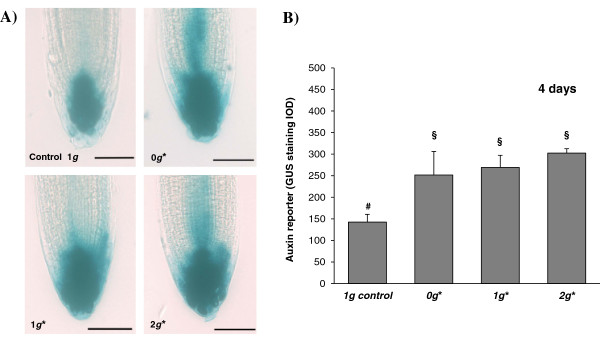
Results: We studied the response of transgenic seedlings of Arabidopsis thaliana, containing either the CycB1-GUS proliferation marker or the DR5-GUS auxin-mediated growth marker, to diamagnetic levitation in the bore of a superconducting solenoid magnet. As a control, a second set of seedlings were exposed to a strong magnetic field, but not to levitation forces. A third set was exposed to a strong field and simulated hypergravity (2 g). Cell proliferation and cell growth cytological parameters were measured for each set of seedlings. Nucleolin immunodetection was used as a marker of cell growth. Collectively, the data indicate that these two fundamental cellular processes are decoupled in root meristems, as in microgravity: cell proliferation was enhanced whereas cell growth markers were depleted. These results also demonstrated delocalisation of auxin signalling in the root tip despite the fact that levitation of the seedling as a whole does not prevent the sedimentation of statoliths in the root cells.
Conclusions: In our model system, we found that diamagnetic levitation led to changes that are very similar to those caused by real- [e.g. on board the International Space Station (ISS)] or mechanically-simulated microgravity [e.g. using a Random Positioning Machine (RPM)]. These changes decoupled meristematic cell proliferation from ribosome biogenesis, and altered auxin polar transport.
Figures
Similar articles
-
The combined effects of real or simulated microgravity and red-light photoactivation on plant root meristematic cells.Planta. 2018 Sep;248(3):691-704. doi: 10.1007/s00425-018-2930-x. Epub 2018 Jun 8. Planta. 2018. PMID: 29948124
-
Functional alterations of root meristematic cells of Arabidopsis thaliana induced by a simulated microgravity environment.J Plant Physiol. 2016 Dec 1;207:30-41. doi: 10.1016/j.jplph.2016.09.011. Epub 2016 Oct 19. J Plant Physiol. 2016. PMID: 27792899
-
Mechanisms of disruption of meristematic competence by microgravity in Arabidopsis seedlings.Plant Signal Behav. 2014;9(4):e28289. doi: 10.4161/psb.28289. Epub 2014 Mar 10. Plant Signal Behav. 2014. PMID: 24614101 Free PMC article. Review.
-
Simulated microgravity, Mars gravity, and 2g hypergravity affect cell cycle regulation, ribosome biogenesis, and epigenetics in Arabidopsis cell cultures.Sci Rep. 2018 Apr 23;8(1):6424. doi: 10.1038/s41598-018-24942-7. Sci Rep. 2018. PMID: 29686401 Free PMC article.
-
Lab-on-a-Chip Technologies for Microgravity Simulation and Space Applications.Micromachines (Basel). 2022 Dec 31;14(1):116. doi: 10.3390/mi14010116. Micromachines (Basel). 2022. PMID: 36677176 Free PMC article. Review.
Cited by
-
A Promising Ash Supplementation Strategy in the Cultivation of Spirodela polyrrhiza Plants.Cells. 2023 Jan 11;12(2):289. doi: 10.3390/cells12020289. Cells. 2023. PMID: 36672224 Free PMC article.
-
Epigenomics in an extraterrestrial environment: organ-specific alteration of DNA methylation and gene expression elicited by spaceflight in Arabidopsis thaliana.BMC Genomics. 2019 Mar 12;20(1):205. doi: 10.1186/s12864-019-5554-z. BMC Genomics. 2019. PMID: 30866818 Free PMC article.
-
Magnetic field effects on plant growth, development, and evolution.Front Plant Sci. 2014 Sep 4;5:445. doi: 10.3389/fpls.2014.00445. eCollection 2014. Front Plant Sci. 2014. PMID: 25237317 Free PMC article. Review.
-
The combined effects of real or simulated microgravity and red-light photoactivation on plant root meristematic cells.Planta. 2018 Sep;248(3):691-704. doi: 10.1007/s00425-018-2930-x. Epub 2018 Jun 8. Planta. 2018. PMID: 29948124
-
A specific role of iron in promoting meristematic cell division during adventitious root formation.J Exp Bot. 2017 Jul 10;68(15):4233-4247. doi: 10.1093/jxb/erx248. J Exp Bot. 2017. PMID: 28922771 Free PMC article.
References
-
- Perbal G. In: A world whitout gravity. SP1251. Seibert G, editor. Noordwijk: European Space Agency; 2001. The role of gravity in plant development; pp. 121–136.
-
- Hill RJ, Eaves L. Vibrations of a diamagnetically levitated water droplet. Phys Rev E Stat Nonlin Soft Matter Phys. 2010;81(5 Pt 2):056312. - PubMed
Publication types
MeSH terms
LinkOut - more resources
Full Text Sources
Other Literature Sources
Research Materials
