

Diversity is maintained by seasonal variation in species abundance
- PMID: 24007204
- PMCID: PMC3856667
- DOI: 10.1186/1741-7007-11-98
Diversity is maintained by seasonal variation in species abundance
Abstract
Background: Some of the most marked temporal fluctuations in species abundances are linked to seasons. In theory, multispecies assemblages can persist if species use shared resources at different times, thereby minimizing interspecific competition. However, there is scant empirical evidence supporting these predictions and, to the best of our knowledge, seasonal variation has never been explored in the context of fluctuation-mediated coexistence.
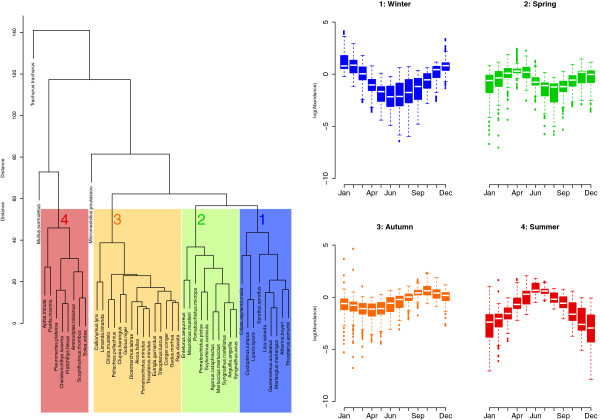
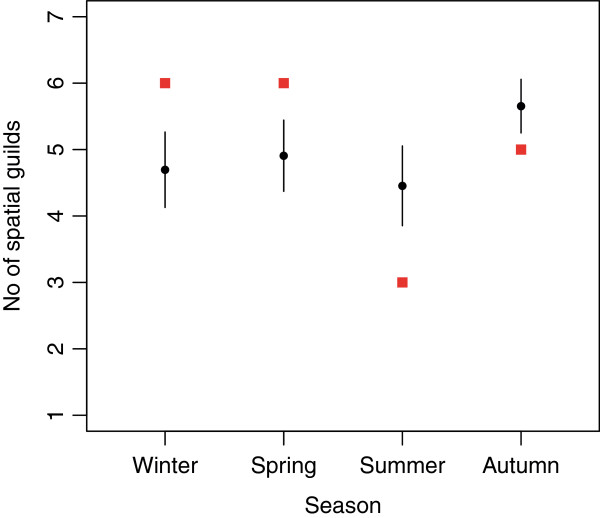
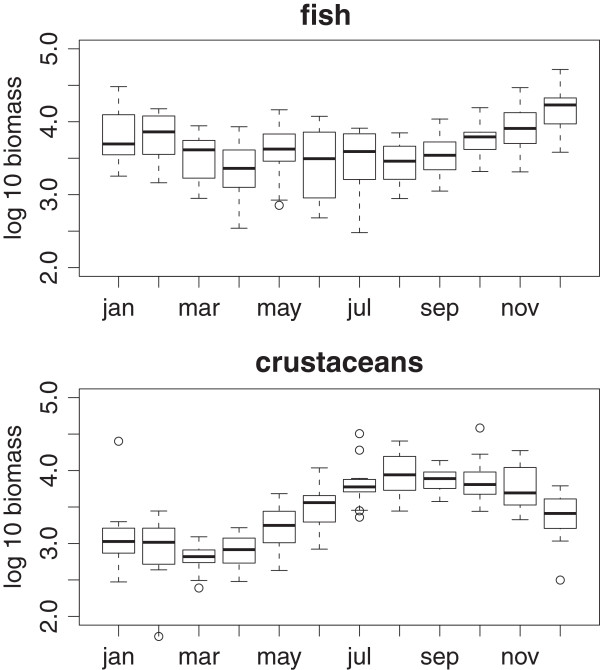
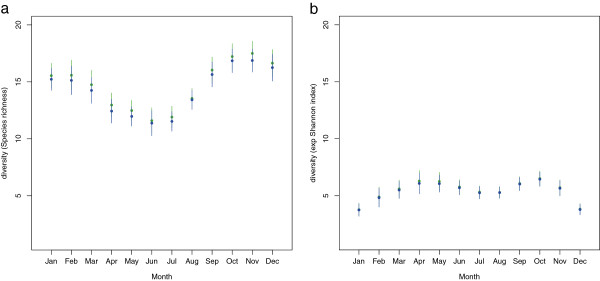
Results: Using an exceptionally well-documented estuarine fish assemblage, sampled monthly for over 30 years, we show that temporal shifts in species abundances underpin species coexistence. Species fall into distinct seasonal groups, within which spatial resource use is more heterogeneous than would be expected by chance at those times when competition for food is most intense. We also detect seasonal variation in the richness and evenness of the community, again linked to shifts in resource availability.
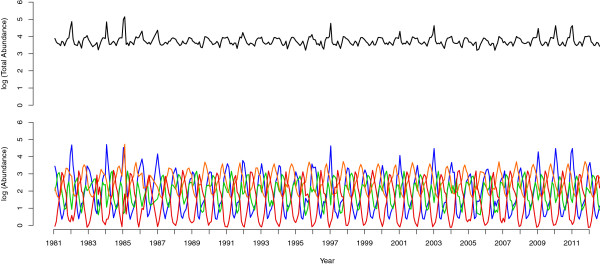
Conclusions: These results reveal that spatiotemporal shifts in community composition minimize competitive interactions and help stabilize total abundance.
Figures
Similar articles
-
[Variations of fish species diversity, faunal assemblage, and abundances in Daya Bay in 1980-2007].Ying Yong Sheng Tai Xue Bao. 2010 Sep;21(9):2403-10. Ying Yong Sheng Tai Xue Bao. 2010. PMID: 21265167 Chinese.
-
Temporal turnover and the maintenance of diversity in ecological assemblages.Philos Trans R Soc Lond B Biol Sci. 2010 Nov 27;365(1558):3611-20. doi: 10.1098/rstb.2010.0285. Philos Trans R Soc Lond B Biol Sci. 2010. PMID: 20980310 Free PMC article.
-
Seasonal dynamics of fish assemblages on breakwaters and natural rocky reefs in a temperate estuary: consistent assemblage differences driven by sub-adults.PLoS One. 2013 Sep 26;8(9):e75790. doi: 10.1371/journal.pone.0075790. eCollection 2013. PLoS One. 2013. PMID: 24086634 Free PMC article.
-
Fish diversity in the Río de la Plata and adjacent waters: an overview of environmental influences on its spatial and temporal structure.J Fish Biol. 2016 Jul;89(1):569-600. doi: 10.1111/jfb.12975. Epub 2016 Apr 28. J Fish Biol. 2016. PMID: 27121796 Review.
-
The role of seasonal timing and phenological shifts for species coexistence.Ecol Lett. 2019 Aug;22(8):1324-1338. doi: 10.1111/ele.13277. Epub 2019 May 24. Ecol Lett. 2019. PMID: 31125170 Review.
Cited by
-
Species coexistence in a changing world.Front Plant Sci. 2015 Oct 14;6:866. doi: 10.3389/fpls.2015.00866. eCollection 2015. Front Plant Sci. 2015. PMID: 26528323 Free PMC article. Review.
-
A sampling optimization analysis of soil-bugs diversity (Crustacea, Isopoda, Oniscidea).Ecol Evol. 2015 Dec 17;6(1):191-201. doi: 10.1002/ece3.1765. eCollection 2016 Jan. Ecol Evol. 2015. PMID: 26811784 Free PMC article.
-
Antagonistic effects of long- and short-term environmental variation on species coexistence.Proc Biol Sci. 2021 Sep 8;288(1958):20211491. doi: 10.1098/rspb.2021.1491. Epub 2021 Sep 8. Proc Biol Sci. 2021. PMID: 34493074 Free PMC article.
-
More than the sum of the parts: annual partitioning within spatial guilds underpins community regulation.Proc Biol Sci. 2018 Jul 18;285(1883):20180659. doi: 10.1098/rspb.2018.0659. Proc Biol Sci. 2018. PMID: 30051845 Free PMC article.
-
Polyrhythmic foraging and competitive coexistence.Sci Rep. 2020 Nov 20;10(1):20282. doi: 10.1038/s41598-020-77483-3. Sci Rep. 2020. PMID: 33219304 Free PMC article.
References
-
- White G. The natural history and antiquities of Selborne. London: Cassell and Company; 1789.
-
- Elton CS. The ecology of invasions by animals and plants. London: Methuen & Co.; 1958.
-
- May RM. Stability and complexity in model ecosystems. Princeton: Princeton University Press; 1973.
Publication types
MeSH terms
Grants and funding
LinkOut - more resources
Full Text Sources
Other Literature Sources
