. 2013 Sep 4:12:128.
doi: 10.1186/1475-2840-12-128.

Mesenchymal stem cell transplantation for the infarcted heart: therapeutic potential for insulin resistance beyond the heart

Affiliations

Mesenchymal stem cell transplantation for the infarcted heart: therapeutic potential for insulin resistance beyond the heart

Curtis C Hughey et al. Cardiovasc Diabetol. .

Abstract

Background: This study aimed to evaluate the efficacy of mesenchymal stem cell (MSC) transplantation to mitigate abnormalities in cardiac-specific and systemic metabolism mediated by a combination of a myocardial infarction and diet-induced insulin resistance.

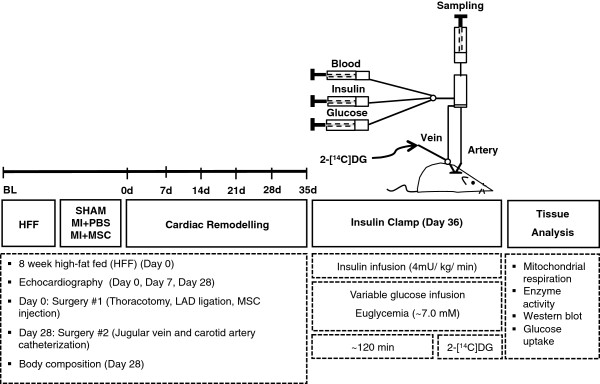
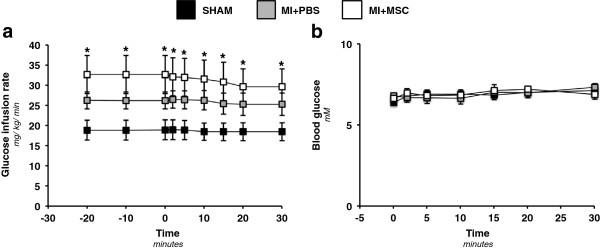
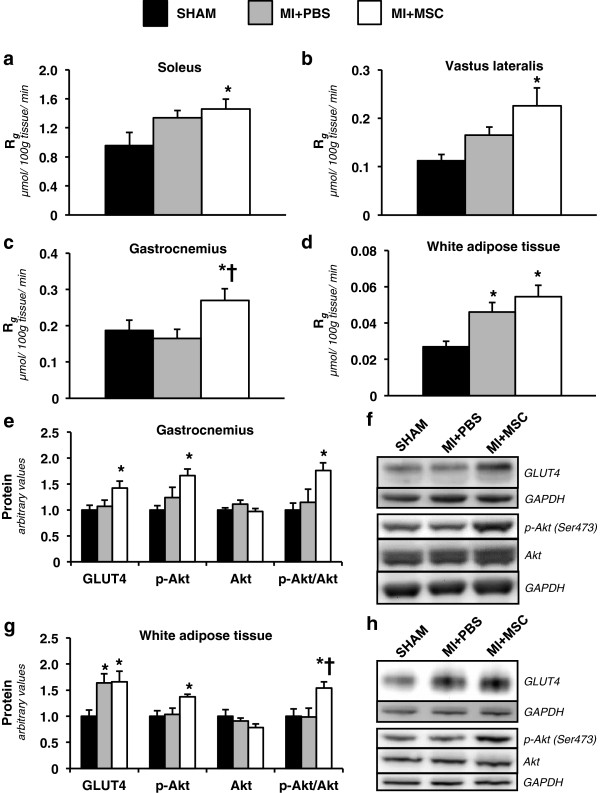
Methods: C57BL/6 mice were high-fat fed for eight weeks prior to induction of a myocardial infarction via chronic ligation of the left anterior descending coronary artery. MSCs were administered directly after myocardial infarction induction through a single intramyocardial injection. Echocardiography was performed prior to the myocardial infarction as well as seven and 28 days post-myocardial infarction. Hyperinsulinemic-euglycemic clamps coupled with 2-[14C]deoxyglucose were employed 36 days post-myocardial infarction (13 weeks of high-fat feeding) to assess systemic insulin sensitivity and insulin-mediated, tissue-specific glucose uptake in the conscious, unrestrained mouse. High-resolution respirometry was utilized to evaluate cardiac mitochondrial function in saponin-permeabilized cardiac fibers.

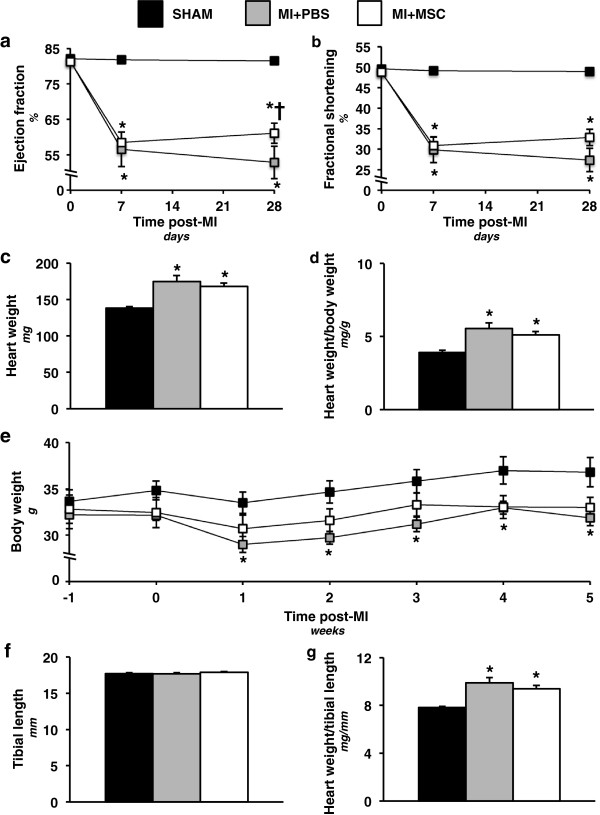
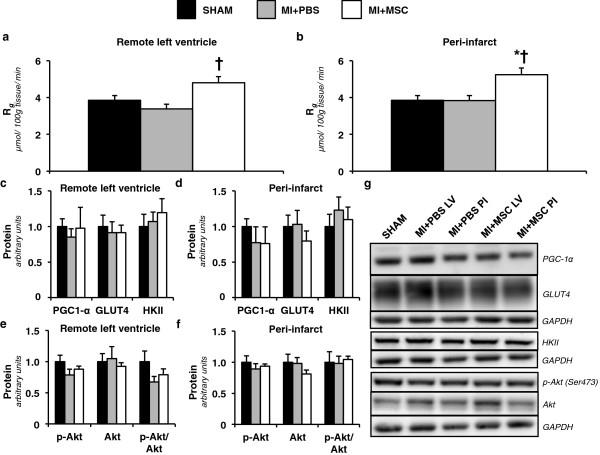
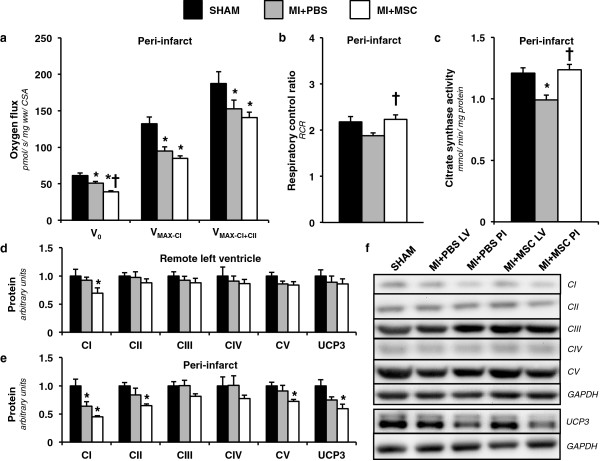
Results: MSC administration minimized the decline in ejection fraction following the myocardial infarction. The greater systolic function in MSC-treated mice was associated with increased in vivo cardiac glucose uptake and enhanced mitochondrial oxidative phosphorylation efficiency. MSC therapy promoted reductions in fasting arterial glucose and fatty acid concentrations. Additionally, glucose uptake in peripheral tissues including skeletal muscle and adipose tissue was elevated in MSC-treated mice. Enhanced glucose uptake in these tissues was associated with improved insulin signalling as assessed by Akt phosphorylation and prevention of a decline in GLUT4 often associated with high-fat feeding.

Conclusions: These studies provide insight into the utility of MSC transplantation as a metabolic therapy that extends beyond the heart exerting beneficial systemic effects on insulin action.


Figures

Figure 1
Figure 1
Schematic representation of experimental procedures and timeline. Echocardiography on conscious mice was performed prior to, seven and 28 days following ligation of the left anterior descending coronary artery (LAD). Arterial and jugular catheterization was performed 28 days following the LAD ligation for the sampling and infusion protocols of the hyperinsulinemic-euglycemic (insulin) clamp. Insulin clamps were performed following seven days of recovery from the catheterization surgeries (36 days post-LAD ligation/13 weeks of high-fat feeding) to assess insulin action in the conscious, unrestrained mouse. Isotopic tracer 2-[14C]deoxyglucose (2-[14C]DG) administration during the insulin clamps allowed for whole body and tissue-specific substrate uptake to be assessed in vivo. Additional experiments included evaluation of mitochondrial respiration in permeabilized cardiac tissue and key molecular regulators of metabolism by immunoblotting. MI + PBS, myocardial infarction + phospho-buffered saline; MI + MSC, myocardial infarction + mesenchymal stem cells.
Figure 2
Figure 2
Cardiac functional and hypertrophic indices. (a) Cardiac ejection fraction (%) prior to, seven and 28 days following a MI. n = 8-13 mice per group. (b) Cardiac fractional shortening (%) prior to, seven and 28 days following a MI. n = 8-13 mice per group. (c) Heart weight 36 days post-MI surgery. n = 11-14 mice per group. (d) Heart weight-to-body weight ratio 36 days following a MI. n = 11-14 mice per group. (e) Time course of body weight from one week prior to chronic left anterior descending coronary artery ligation to five weeks post-ligation. n = 10-12 mice per group. (f) Tibial length 36 days following a MI. n = 11-14 mice per group. (g) Heart weight-to-tibial length 36 days post-MI. n = 11-14 mice per group. Data are mean ± S.E.M. *p < 0.05 vs. SHAM. †p < 0.05 vs. MI + PBS.
Figure 3
Figure 3
Regional insulin-stimulated cardiac glucose uptake. (a) Metabolic index of glucose uptake (Rg) in the remote left ventricle and (b) peri-infarct region of the left ventricle. Cardiac Rg values are relative to brain Rg. n = 8-9 mice per group. (c) Remote left ventricle and (d) peri-infarct peroxisome proliferator-activated receptor gamma coactivator-1alpha (PGC-1α), glucose transporter 4 (GLUT4) and hexokinase II (HKII) as determined by immunoblotting. (e) Left ventricle and (f) peri-infarct phospho-Akt (p-Akt), Akt and p-Akt-to-total Akt ratio (p-Akt/Akt) as determined by immunoblotting. (g) Representative immunoblotting performed to measure PGC-1α, GLUT4, HKII, p-Akt and Akt. Cardiac proteins are normalized to glyceraldehyde-3-phosphate dehydrogenase (GAPDH) content and are relative to the SHAM group. n = 6 mice per group. Data are mean ± S.E.M. *p < 0.05 vs. SHAM. †p < 0.05 vs. MI + PBS.
Figure 4
Figure 4
Cardiac mitochondrial function and characteristics. (a) Peri-infarct permeabilized cardiac fiber basal oxygen consumption supported by glutamate, malate and pyruvate (V0), maximal oxygen consumption (ADP-stimulated) supported by glutamate, malate and pyruvate through complex I (VMAX-CI) and maximal convergent oxygen flux supported by glutamate, malate, pyruvate and succinate (VMAX-CI+CII). n = 8-9 mice per group. (b) Respiratory control ratio (RCR; defined as VMAX-CI/V0). n = 8-9 mice per group. (c) Peri-infarct citrate synthase activity (CSA) (mmol/min/mg protein). n = 8-9 mice per group. (d) Remote Left ventricle and (e) peri-infarct mitochondrial oxidative phosphorylation (OXPHOS) complexes I-V (CI-CV) and uncoupling protein 3 (UCP3) as determined by immunoblotting. (f) Representative immunoblotting of the regional protein levels OXPHOS complexes I-V and UCP3. Cardiac protein was normalized to glyceraldehyde-3-phosphate dehydrogenase (GAPDH) content and expressed relative to the SHAM group. n = 6 mice per group. Data are mean ± S.E.M. *p < 0.05 vs. SHAM. †p < 0.05 vs. MI + PBS.
Figure 5
Figure 5
Whole body insulin sensitivity and blood glucose during the hyperinsulinemic-euglycemic (insulin) clamp. (a) Glucose infusion rate (GIR) during the insulin clamp. The GIR is equivalent to the whole body glucose disposal rate in response to venous insulin infusion. The insulin infusion was for approximately 120 minutes prior to 2-[14C]deoxyglucose (2-[14C]DG) administration. The GIR is displayed as a time course commencing twenty minutes prior to administration of 2-[14C]DG (−20 minute time point) to 30 minutes following 2-[14C]DG infusion (30 minute time point). (b) Arterial, blood glucose concentration following 2-[14C]DG for 30 minutes post-administration. Data are mean ± SEM for n = 9-12 mice per group. *p < 0.05 vs. SHAM.
Figure 6
Figure 6
Insulin-stimulated peripheral tissue glucose utilization. (a) Metabolic index of glucose uptake (Rg) in the soleus. (b) Metabolic index of glucose uptake (Rg) in the superficial vastus lateralis. (c) Metabolic index of glucose uptake (Rg) in the gastrocnemius. (d) Metabolic index of glucose uptake (Rg) in white adipose tissue. Tissue Rg values are relative to brain Rg. n = 9 mice per group. (e) Gastrocnemius glucose transporter 4 (GLUT4), phospho-Akt (p-Akt), Akt and p-Akt-to-total Akt ratio (p-Akt/Akt) as determined by immunoblotting. n = 6-8 mice per group. (f) Representative immunoblotting performed to measure gastrocnemius GLUT4, p-Akt and Akt. (g) White adipose tissue glucose transporter 4 (GLUT4), phospho-Akt (p-Akt), Akt and p-Akt-to-total Akt ratio (p-Akt/Akt) as determined by immunoblotting. n = 6 mice per group. (h) Representative immunoblotting performed to measure white adipose tissue GLUT4, p-Akt and Akt. Protein levels are normalized to glyceraldehyde-3-phosphate dehydrogenase (GAPDH) content and are expressed relative to the SHAM group. Data are mean ± S.E.M. *p < 0.05 vs. SHAM. †p < 0.05 vs. MI + PBS.

Similar articles

Cited by

References

    1. Swynghedauw B. Molecular mechanisms of myocardial remodeling. Physiol Rev. 1999;79(1):215–262. - PubMed
    1. Minicucci MF, Azevedo PS, Polegato BF, Paiva SA, Zornoff LA. Heart failure after myocardial infarction: clinical implications and treatment. Clin Cardiol. 2011;34(7):410–414. doi: 10.1002/clc.20922. - DOI - PMC - PubMed
    1. Henning RJ. Stem cells in cardiac repair. Future Cardiol. 2011;7(1):99–117. doi: 10.2217/fca.10.109. - DOI - PubMed
    1. Keats EC, Khan ZA. Vascular stem cells in diabetic complications: evidence for a role in the pathogenesis and the therapeutic promise. Cardiovasc Diabetol. 2012;11:37. doi: 10.1186/1475-2840-11-37. - DOI - PMC - PubMed
    1. Ranganath SH, Levy O, Inamdar MS, Karp JM. Harnessing the mesenchymal stem cell secretome for the treatment of cardiovascular disease. Cell Stem Cell. 2012;10(3):244–258. doi: 10.1016/j.stem.2012.02.005. - DOI - PMC - PubMed

Publication types

MeSH terms