

Persistent organic pollutants in Norwegian men from 1979 to 2007: intraindividual changes, age-period-cohort effects, and model predictions
- PMID: 24007675
- PMCID: PMC3855502
- DOI: 10.1289/ehp.1206317
Persistent organic pollutants in Norwegian men from 1979 to 2007: intraindividual changes, age-period-cohort effects, and model predictions
Abstract
Background: Longitudinal monitoring studies of persistent organic pollutants (POPs) in human populations are important to better understand changes with time and age, and for future predictions.
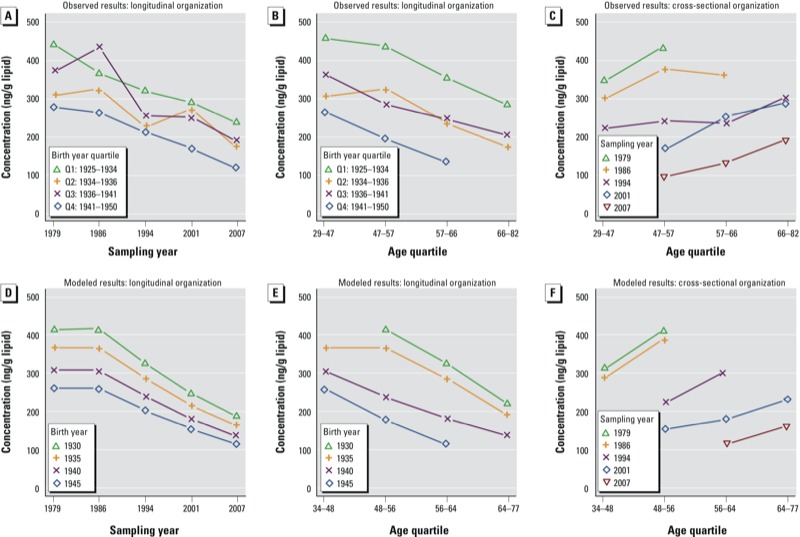
Objectives: We sought to describe serum POP time trends on an individual level, investigate age-period-cohort effects, and compare predicted polychlorinated biphenyl (PCB) concentrations to measured values.
Methods: Serum was sampled in 1979, 1986, 1994, 2001, and 2007 from a cohort of 53 men in Northern Norway and analyzed for 41 POPs. Time period, age, and birth cohort effects were assessed by graphical analyses and mixed-effect models. We derived the predicted concentrations of four PCBs for each sampling year using the CoZMoMAN model.
Results: The median decreases in summed serum POP concentrations (lipid-adjusted) in 1986, 1994, 2001, and 2007 relative to 1979 were -22%, -52%, -54%, and -68%, respectively. We observed substantial declines in all POP groups with the exception of chlordanes. Time period (reflected by sampling year) was the strongest descriptor of changes in PCB-153 concentrations. Predicted PCB-153 concentrations were consistent with measured concentrations in the study population.
Conclusions: Our results suggest substantial intraindividual declines in serum concentrations of legacy POPs from 1979 to 2007 in men from Northern Norway. These changes are consistent with reduced environmental exposure during these 30 years and highlight the relation between historic emissions and POP concentrations measured in humans. Observed data and interpretations are supported by estimates from the CoZMoMAN emission-based model. A longitudinal decrease in concentrations with age was evident for all birth cohorts. Overall, our findings support the relevance of age-period-cohort effects to human biomonitoring of environmental contaminants.
Conflict of interest statement
The authors declare they have no actual or potential competing financial interests.
Figures


References
-
- Akins JR, Waldrep K, Bernert JT., Jr The estimation of total serum lipids by a completely enzymatic ‘summation’ method. Clin Chim Acta. 1989;184(3):219–226. - PubMed
-
- AMAP (Arctic Monitoring and Assessment Programme). AMAP Assessment Report: Arctic Pollution Issues. Oslo, Norway:AMAP. 1998. Available: http://www.amap.no/documents/doc/amap-assessment-report-arctic-pollution... [accessed 17 September 2013]
-
- AMAP (Arctic Monitoring and Assessment Programme). AMAP Assessment 2002: Persistent Organic Pollutants in the Arctic. Oslo, Norway:AMAP. 2004. Available: http://www.amap.no/documents/download/1159 [accessed 17 September 2013]
-
- Anda EE, Nieboer E, Dudarev AA, Sandanger TM, Odland JØ. Intra- and intercompartmental associations between levels of organochlorines in maternal plasma, cord plasma and breast milk, and lead and cadmium in whole blood, for indigenous peoples of Chukotka, Russia. J Environ Monit. 2007;9(8):884–893. - PubMed
Publication types
MeSH terms
Substances
LinkOut - more resources
Full Text Sources
Other Literature Sources