. 2013 Nov;183(5):1518-1526.
doi: 10.1016/j.ajpath.2013.07.012. Epub 2013 Sep 3.

Role of bile acids in liver injury and regeneration following acetaminophen overdose

Affiliations

Role of bile acids in liver injury and regeneration following acetaminophen overdose

Bharat Bhushan et al. Am J Pathol. 2013 Nov.

Abstract

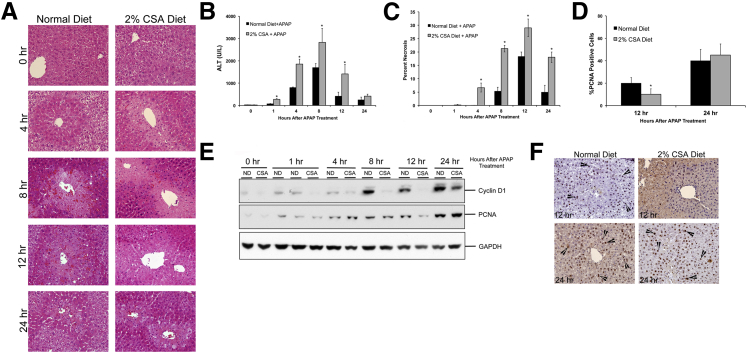
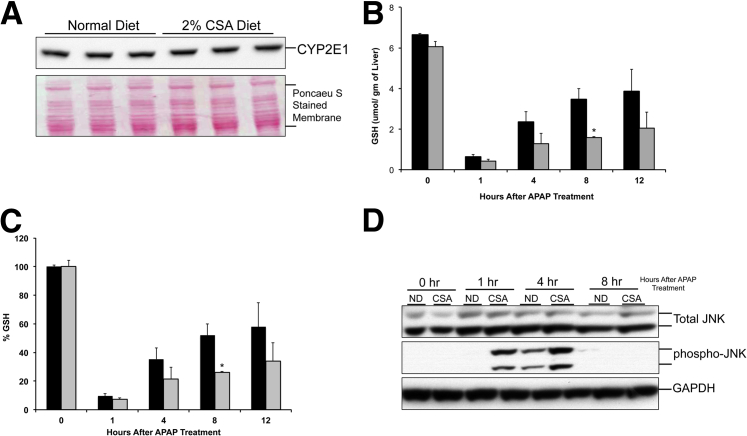
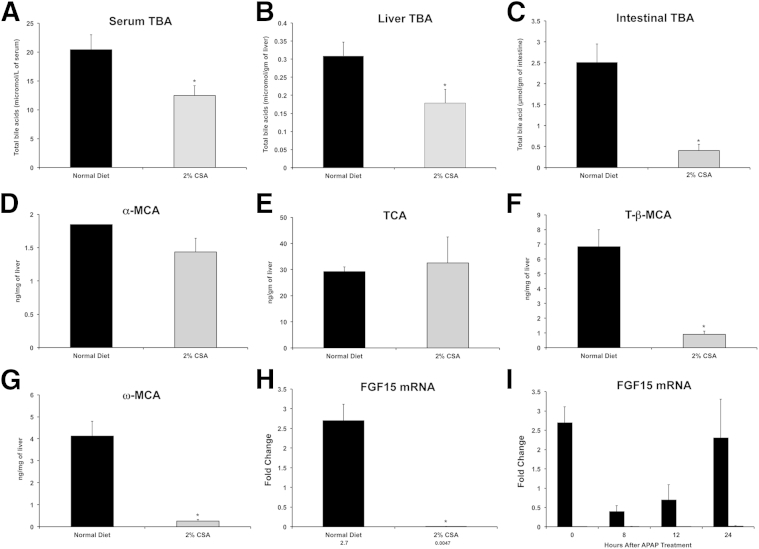
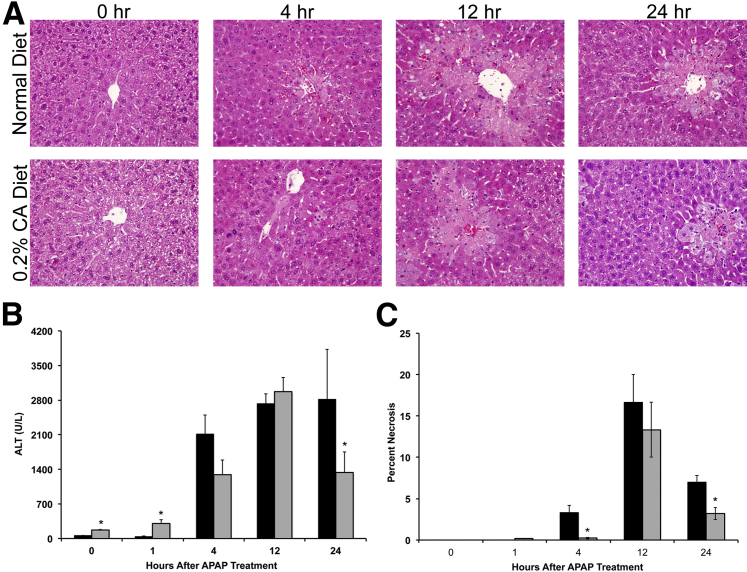
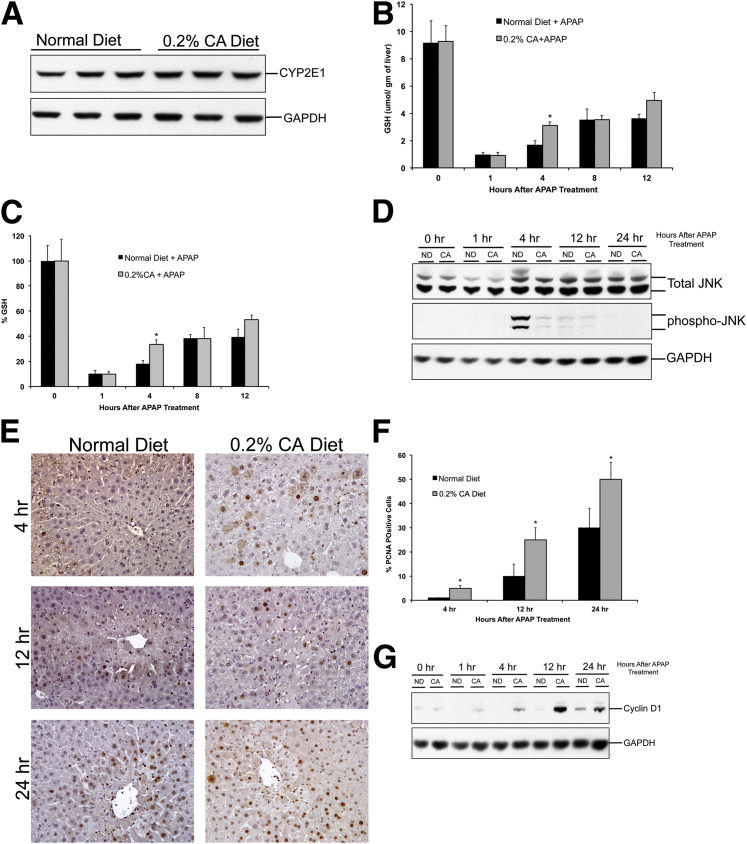
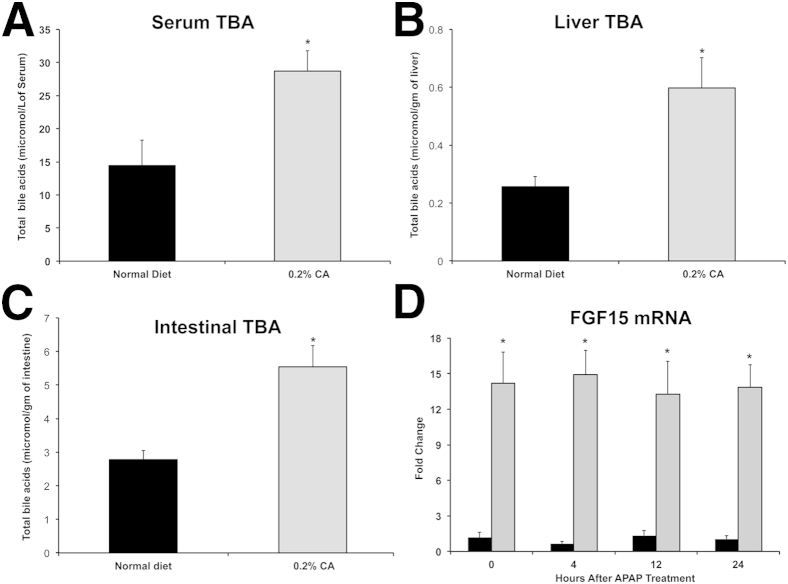
Bile acids play a critical role in liver injury and regeneration, but their role in acetaminophen (APAP)-induced liver injury is not known. We tested the effect of bile acid modulation on APAP hepatotoxicity using C57BL/6 mice, which were fed a normal diet, a 2% cholestyramine (CSA)-containing diet for bile acid depletion, or a 0.2% cholic acid (CA)-containing diet for 1 week before treatment with 400 mg/kg APAP. CSA-mediated bile acid depletion resulted in significantly higher liver injury and delayed regeneration after APAP treatment. In contrast, 0.2% CA supplementation in the diet resulted in a moderate delay in progression of liver injury and significantly higher liver regeneration after APAP treatment. Either CSA-mediated bile acid depletion or CA supplementation did not affect hepatic CYP2E1 levels or glutathione depletion after APAP treatment. CSA-fed mice exhibited significantly higher activation of c-Jun N-terminal protein kinases and a significant decrease in intestinal fibroblast growth factor 15 mRNA after APAP treatment. In contrast, mice fed a 0.2% CA diet had significantly lower c-Jun N-terminal protein kinase activation and 12-fold higher fibroblast growth factor 15 mRNA in the intestines. Liver regeneration after APAP treatment was significantly faster in CA diet-fed mice after APAP administration secondary to rapid cyclin D1 induction. Taken together, these data indicate that bile acids play a critical role in both initiation and recovery of APAP-induced liver injury.


Figures

Figure 1
Figure 1
Increased acetaminophen (APAP)-induced liver injury after bile acid depletion. A: Representative photomicrographs of H&E-stained liver sections obtained over a time course of 0 to 24 hours after APAP treatment of mice fed either a normal diet or a 2% CSA diet. B: Serum ALT activity measured over a time course of 0 to 24 hours after APAP treatment of mice fed either a normal diet or a 2% CSA diet. C: Percentage necrosis after APAP treatment. D: Percentage PCNA-positive cells at 12 and 24 hours in liver sections of APAP-treated mice fed either a normal diet or a 2% CSA diet. E: Western blot analysis of cyclin D1 and PCNA using total liver cell extracts of normal diet– or CSA diet–fed mice treated with APAP. F: Representative photomicrographs of PCNA IHC staining of liver sections of APAP-treated mice fed either a normal diet or a 2% CSA diet at 12 and 24 hours after APAP treatment. Arrowheads indicate cells in the S phase. P < 0.05 (BD). GAPDH, glyceraldehyde-3-phosphate dehydrogenase.
Figure 2
Figure 2
Mechanisms of increased acetaminophen (APAP)-induced injury after bile acid depletion. A: Western blot analysis of microsomal CYP2E1 using total liver cell extract of normal diet (ND)–fed and cholestyramine (CSA)-fed murine livers obtained before APAP treatment at 0 hours. B: GSH levels in the livers of ND-fed (black bars) and CSA-fed (gray bars) mice during a time course of 0 to 12 hours after APAP treatment. C: Percentage of GSH depletion in the livers of control (black bars) and CSA-fed (gray bars) mice during a time course of 0 to 12 hours after APAP treatment. D: Western blot analysis of total and phosphorylated JNK using total liver cell extracts of ND-fed and CSA-fed murine livers obtained at various time points after APAP treatment. P < 0.05 (B and C). GAPDH, glyceraldehyde-3-phosphate dehydrogenase.
Figure 3
Figure 3
Changes in total bile acids (TBAs) and intestinal FGF15 mRNA after CSA treatment. Total bile acids in serum (A), liver (B), and intestines (C) in normal diet–fed (black bars) or CSA-diet (gray bars) fed mice. UPLC-MS–mediated quantification of specific hepatic bile acids, including α-muricholic acid (MCA; D), tauro-β-muricholic acid (TCA; E), tauro-β-MCA (F), and ω-MCA (G). Serum and liver samples at 0 hours before APAP administration were used for the analysis. H: Real-time PCR analysis of FGF15 mRNA in the intestine of control and CSA-fed mice before APAP treatment at 0 hours. I: Real-time PCR analysis of FGF15 mRNA in the intestine of control and CSA-fed mice at various time points after APAP treatment. ∗P < 0.05 (AC and FH).
Figure 4
Figure 4
Cholic acid supplementation delays initiation of injury and stimulates rapid recovery after APAP treatment. A: Representative photomicrographs of H&E-stained liver sections of normal diet– and 0.2% CA diet–fed mice treated with APAP during a time course of 0 to 24 hours. B: Serum ALT levels in normal diet–fed (black bars) and 0.2% CA diet–fed mice (gray bars) treated with APAP. C: Percentage of cells in necrosis in the livers of normal diet–fed (black bars) and 0.2% CA diet–fed mice (gray bars) treated with APAP. ∗P < 0.05 (B and C).
Figure 5
Figure 5
Mechanisms of acetaminophen (APAP)-induced liver injury and regeneration after cholic acid supplementation. Western blot analysis of CYP2E1 using total liver cell extract (A), GSH levels in the livers (B), percentage of GSH depletion (C), Western blot analysis of total and phosphorylated JNK using total liver cell extract (D), representative photomicrographs of PCNA IHC staining in the livers (E), bar graph showing percentage of PCNA-positive cells in livers (F), and Western blot analysis of cyclin D1 using total liver cell extracts (G) of normal diet (ND)–fed and 0.2% CA diet–fed mice after APAP treatment. ∗P < 0.05 (B, C, and F). GAPDH, glyceraldehyde-3-phosphate dehydrogenase.
Figure 6
Figure 6
Changes in total bile acids and FGF15 mRNA after cholic acid supplementation. Total bile acids in serum (A), liver (B), and intestines (C) of normal diet–fed and 0.2% cholic acid (CA) diet–fed mice before acetaminophen (APAP) treatment. D: Intestinal FGF15 mRNA expression in normal diet–fed (black bars) and 0.2% CA diet–fed (gray bars) mice before and after APAP administration. P < 0.05 (AD).

References

    1. Hylemon P.B., Zhou H., Pandak W.M., Ren S., Gil G., Dent P. Bile acids as regulatory molecules. J Lipid Res. 2009;50:1509–1520. - PMC - PubMed
    1. Trauner M., Claudel T., Fickert P., Moustafa T., Wagner M. Bile acids as regulators of hepatic lipid and glucose metabolism. Dig Dis. 2010;28:220–224. - PubMed
    1. Allen K., Jaeschke H., Copple B.L. Bile acids induce inflammatory genes in hepatocytes: a novel mechanism of inflammation during obstructive cholestasis. Am J Pathol. 2011;178:175–186. - PMC - PubMed
    1. Gadaleta R.M., van Mil S.W., Oldenburg B., Siersema P.D., Klomp L.W., van Erpecum K.J. Bile acids and their nuclear receptor FXR: relevance for hepatobiliary and gastrointestinal disease. Biochim Biophys Acta. 2010;1801:683–692. - PubMed
    1. Wang Y.D., Chen W.D., Moore D.D., Huang W. FXR: a metabolic regulator and cell protector. Cell Res. 2008;18:1087–1095. - PubMed

Publication types

MeSH terms