. 2013:3:2606.
doi: 10.1038/srep02606.

Distinct cell shapes determine accurate chemotaxis

Affiliations

Distinct cell shapes determine accurate chemotaxis

Luke Tweedy et al. Sci Rep. 2013.

Abstract

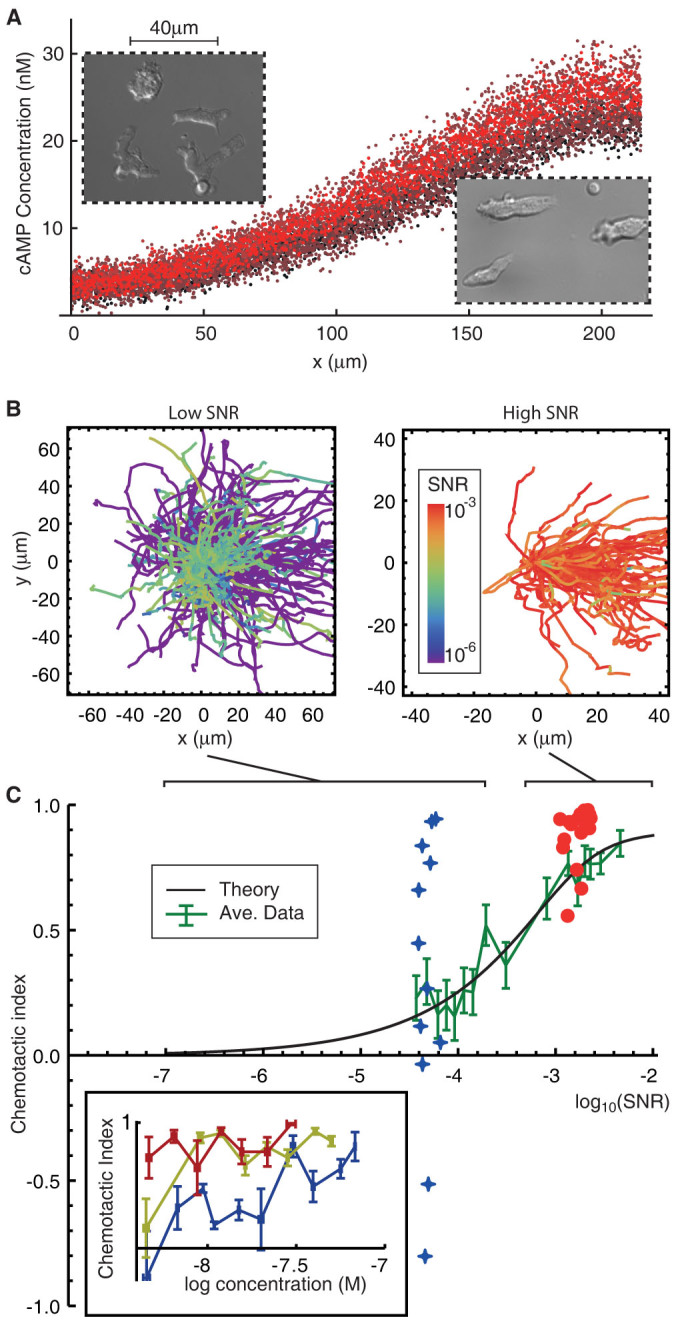
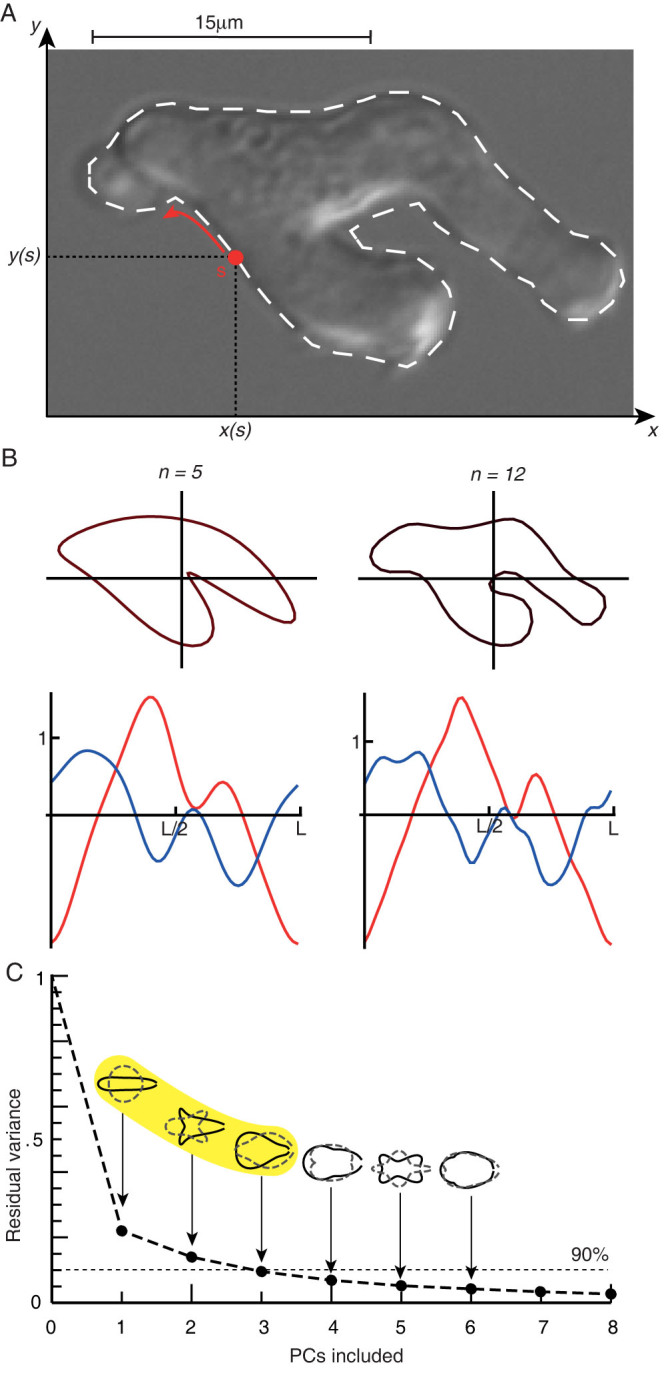
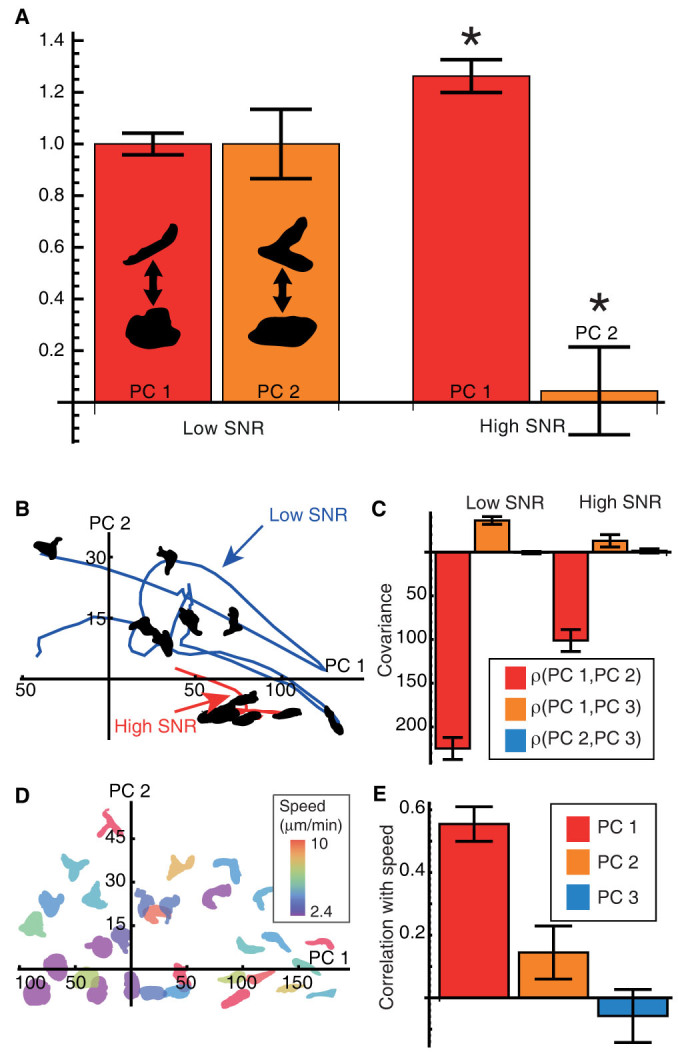
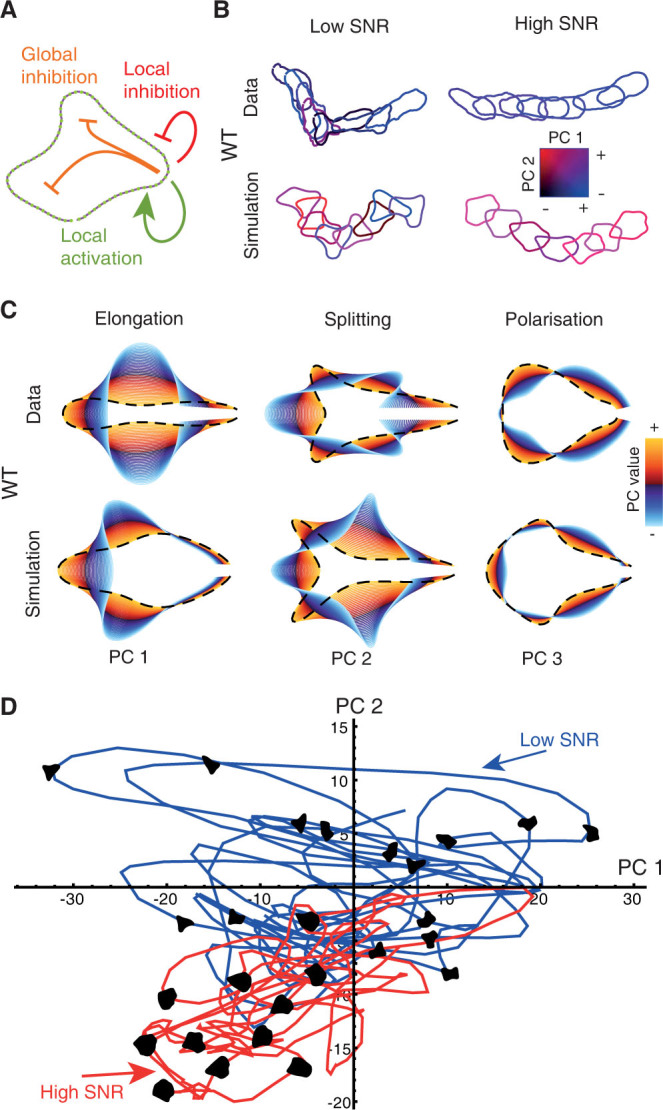
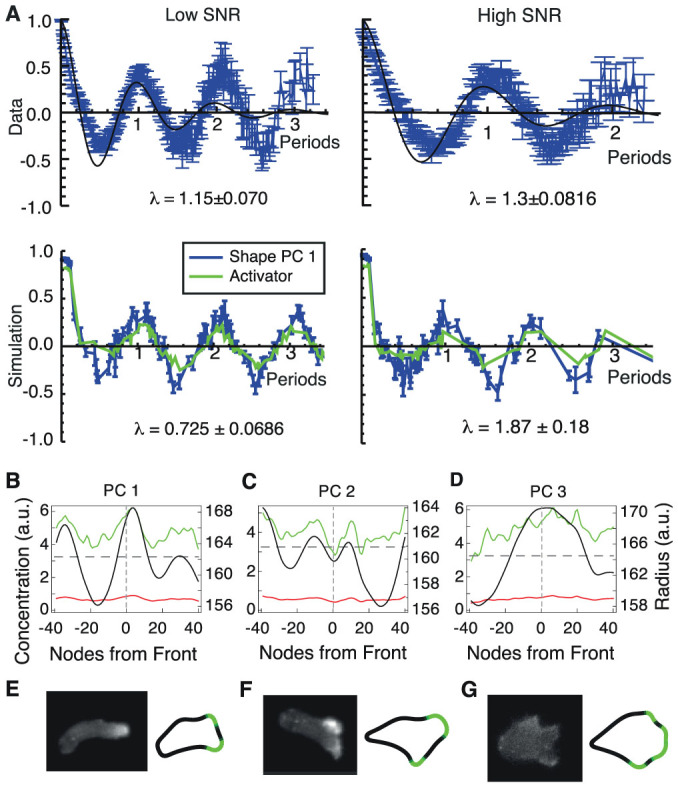
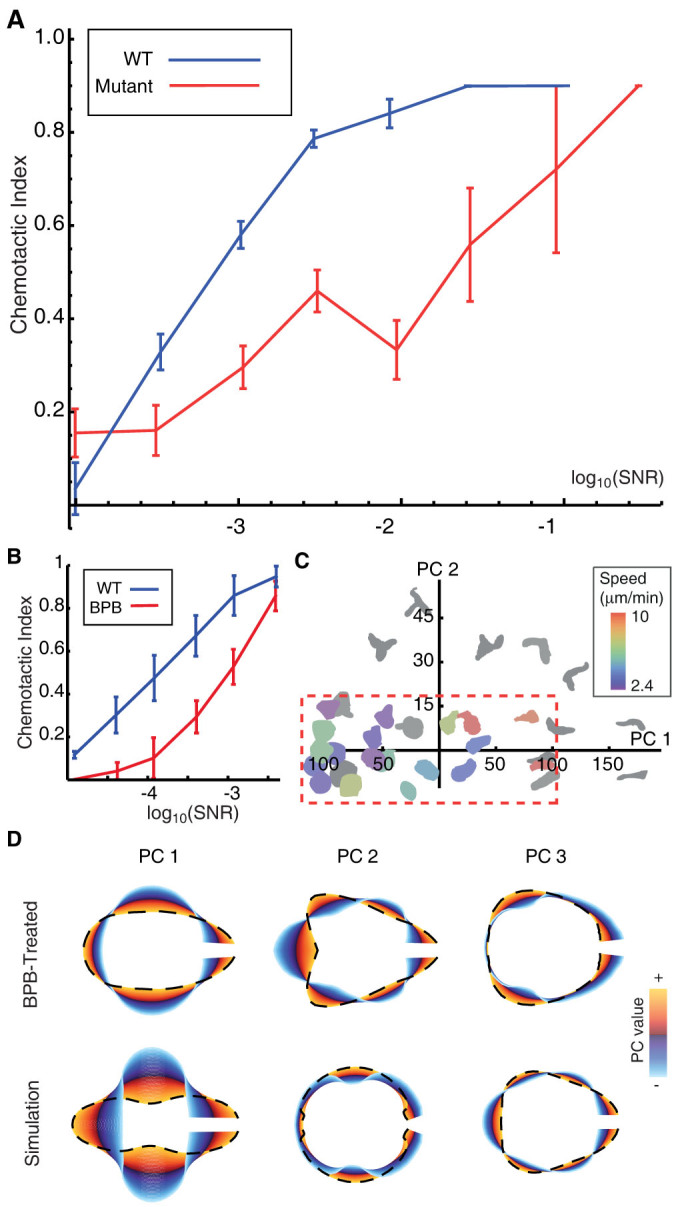
The behaviour of an organism often reflects a strategy for coping with its environment. Such behaviour in higher organisms can often be reduced to a few stereotyped modes of movement due to physiological limitations, but finding such modes in amoeboid cells is more difficult as they lack these constraints. Here, we examine cell shape and movement in starved Dictyostelium amoebae during migration toward a chemoattractant in a microfluidic chamber. We show that the incredible variety in amoeboid shape across a population can be reduced to a few modes of variation. Interestingly, cells use distinct modes depending on the applied chemical gradient, with specific cell shapes associated with shallow, difficult-to-sense gradients. Modelling and drug treatment reveals that these behaviours are intrinsically linked with accurate sensing at the physical limit. Since similar behaviours are observed in a diverse range of cell types, we propose that cell shape and behaviour are conserved traits.


Figures

Figure 1
Figure 1. Chemotactic index depends on SNR.
(A) Gradients of cAMP are produced using a microfluidic device with a flow speed that does not exceed 100 μm/s at the depth of the cells. Stable repeats of cAMP concentration profiles are shown in different red shades, with an average standard deviation of about 13% at any given pixel (for experimental details, see supplementary material). (Insets) DIC images of cells exposed to shallow (left) and steep (right) cAMP gradients. Cells in shallow gradients often display multiple or branched pseudopods. (B) Tracks of migrating cells for low- (left) and high- (right) SNR environments, with SNR = (∇c)2/c0, where ∇c and c0 are gradient and background concentration, respectively (for experimental values, see Fig. S1). Cells bias their motion in the direction the gradient with increasing SNR. Tracks are coloured based on instantaneous SNR. (C) Chemotactic index is a function of SNR (plotted on a log10 scale). The fundamental physical limit for a static spherical ligand absorber (solid black line) and the mean value of CI are shown (solid green line). Data from two cell trajectories are shown in blue crosses and red circles. To remove non-motile cells, only cells with an average speed above 2.4 μm/min were selected. (Inset) CI as a function of concentration for low (blue), medium (yellow) and high (red) relative gradients of 0.0017/μm, 0.010/μm and 0.016/μm, respectively.
Figure 2
Figure 2. Fourier shape descriptors reveal low dimensional shape space.
(A) Raw DIC image of a single cell, with the outline taken from the cell superimposed. x and y co-ordinates are sampled as functions of the distance s travelled around the perimeter of length L. (B) Reconstructions of the cell outline using n Fourier components, with the functions x,y shown below. This is the first instance of dimensionality reduction. (C) To find a low-dimensional description of shape, we calculate the power spectra of 3210 cell shapes from 907 cells (see Materials and Methods) and apply principal component analysis (PCA). The residual variance is shown as additional principal components (PCs) are introduced. Only 3 PCs are required to account for over 90% of shape variability, demonstrating a drastic reduction in dimensionality. These PCs are transformed back into the spatial domain, and are shown as spatial autocorrelations varying around the mean shape with their respective maxima (solid shapes) and minima (dashed shapes). The first three components (highlighted in yellow) describe cell elongation (PC 1), bending or splitting (PC 2), and cell polarisation (PC 3), and are used exclusively from now on.
Figure 3
Figure 3. Analysis reveals characteristic cell shape and behaviour.
(A) Relative differences in cell shape indicate SNR-dependent characteristic shapes. Comparison is based on 967 low- and 361 high-SNR cell shapes. Bars are normalised to the mean of each PC value at low SNR. Absolute values, from left to right, are 44.77, 2.613, 56.32 and 0.114. Error bars show the standard error. Differences in PCs 1 and 2 are statistically significant (*, p < 0.05), using a Kolmogorov-Smirnov test and the Bonferroni correction for multiple tests (3 conditions tested). To guarantee independence, only one frame is selected from each cell. Cells are chosen for a migratory speed above an average of 2.4 μm/min. (B) Example trajectories projected into shape PCs 1 and 2 for a low- (blue) and a high- (red) SNR cell. The positions of elongated cells at high PC 1 and split cells at high PC 2 confirm our interpretation of the PCs from Fig. 2C. (C) Covariance between pairs of components. In spite of describing independent shape variations, PCs 1 and 2 covary strongly within individual trajectories over time, indicating a stereotypical behaviour. (D) Shape space, coloured according to cell speed, illustrating that cells with low PC 1 and low PC 2 migrate slowly. (E) Correlation of PCs with cell migration speed, demonstrating that high PC 1 values correspond to fast migration. Error bars determined by bootstrapping.
Figure 4
Figure 4. Simulation reproduces live cell shape and behaviour.
(A) Diagram of the Meinhardt model. A simulated boundary (green nodes) is deformed by forces generated through physical tension and interactions with three simulated species: a locally acting activator that drives protrusion, and both local and global inhibitors, which regulate activator levels. (B) Example trajectories for wild type (WT) live cells (top) and “wild type” simulations (bottom) for low- (left) and high- (right) SNR. The outlines are coloured according to the value of PCs 1 (red) and 2 (blue). (C) First three PCs of shape for live cells (top) correspond closely to the PCs of simulated cell shapes (bottom). Red to orange contours show increasing addition of a PC to the mean shape. Purple to blue contours show increasing subtraction of a PC. The highest added value of a PC is highlighted (dashed black line). (D) Example trajectories projected into PCs 1 and 2 for low- (blue) and high- (red) SNR simulated trajectories.
Figure 5
Figure 5. Shape gives insight into biochemistry.
(A) (Top) Average of autocorrelations in PC 1 for live cells, scaled by native period, for 103 low-SNR cells (left) and 78 high-SNR cells (right). The period of each cell's autocorrelation was obtained by selecting the largest mode in the frequency domain. The median periods for low and high SNR were 173.1 s and 239.0 s respectively, reflecting the high persistence of cell shape in high-SNR environments. Simulations captured this trend, with median periods of low- and high-SNR simulations of 126.0 time steps and 240.5 time steps, respectively. Error-bars on autocorrelations are large-lag standard errors. (Bottom) Autocorrelations of PC 1 (blue) and of local activator (green) for simulated shallow (left) and steep (right) gradient cells. Individual autocorrelations are aligned according to their fundamental periods, and then averaged. Similar to live cell data, the simulated cells have oscillatory autocorrelations in PC 1, which are less apparent in the steep gradient. For live cell autocorrelations in other PCs, see Fig. S6. (B–D). Concentrations of activator (green), local inhibitor (red) and global inhibitor (dark grey, dashed) and radii (black) are averaged over cells with high values of PC 1 (B), PC 2 (C) and PC 3 (D) and plotted as functions of nodes around the cell contour. Concentration values are shown on the left axis and radii on the right axis. Plots are aligned with the direction of motion in the centre and the rear of the cell at the far left and right. (E–G) Examples of live cells with limGFP-labeled actin (left) compared with simulated cell shapes (right). Cells and simulations in (E) and (F) are exposed to a low SNR. The cell and simulation in (G) are exposed to a high SNR.
Figure 6
Figure 6. Shape is important for accurate chemotaxis.
(A) CI as a function of SNR for WT (blue) and mutant (red) simulations. Error bars show the standard error on the mean. (B) The effect of BPB treatment on Dictyostelium chemotaxis. Wild type and BPB-treated cells are shown in blue and red, respectively. Graph is based on digitised data from, with axis units converted to CI and SNR. (C) The effect of BPB treatment on cell shape. The shapes of BPB-treated cells are shown in colour. Wild type cell shapes are shown in grey for reference. The boundary of the PLA2-inhibited shape space is indicated (dashed red box), and lies inside the shape space boundaries of the wild type data (see Fig. S5). (D) The first three PCs of shape for PLA2-inhibited cells (top) and for shape-constrained simulations (bottom).

Similar articles

Cited by

References

    1. Stephens G. J., Bueno de Mesquita M., Ryu W. S. & Bialek W. Emergence of long timescales and stereotyped behaviours in caenorhabditis elegans. Proc. Natl. Acad. Sci. USA 108, 7286–7289 (2001). - PMC - PubMed
    1. Hicheur H., Pham Q. C., Arechavaleta G., Laumond J. P. & Berthoz A. The formation of trajectories during goal-oriented locomotion in humans. I. A stereotyped behaviour. Eur. J. Neurosci. 26, 2376–2390 (2007). - PubMed
    1. Csermely D., Bonati B. & Romani R. Predatory behaviour of common kestrels (falco tinnunculus) in the wild. J. Ethol. 27, 461–465 (2009).
    1. van Haastert P. J. M. & Postma M. Biased random walk by stochastic fluctuations of chemoattractant-receptor interactions at the lower limit of detection. Biophys. J. 93, 1787–1796 (2007). - PMC - PubMed
    1. Berg H. C. & Purcell E. M. Physics of chemoreception. Biophys. J. 20, 93–219 (1977). - PMC - PubMed

Publication types

LinkOut - more resources