

Cerebrovascular autoregulation after rewarming from hypothermia in a neonatal swine model of asphyxic brain injury
- PMID: 24009008
- PMCID: PMC3841826
- DOI: 10.1152/japplphysiol.00238.2013
Cerebrovascular autoregulation after rewarming from hypothermia in a neonatal swine model of asphyxic brain injury
Abstract
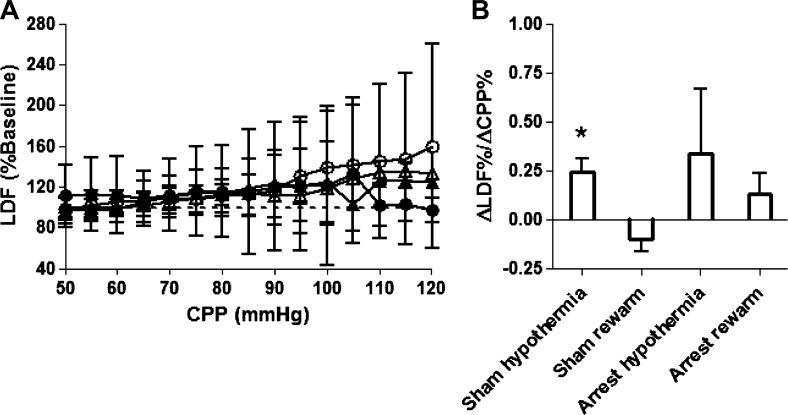
After hypoxic brain injury, maintaining blood pressure within the limits of cerebral blood flow autoregulation is critical to preventing secondary brain injury. Little is known about the effects of prolonged hypothermia or rewarming on autoregulation after cardiac arrest. We hypothesized that rewarming would shift the lower limit of autoregulation (LLA), that this shift would be detected by indices derived from near-infrared spectroscopy (NIRS), and that rewarming would impair autoregulation during hypertension. Anesthetized neonatal swine underwent sham surgery or hypoxic-asphyxic cardiac arrest, followed by 2 h of normothermia and 20 h of hypothermia, with or without rewarming. Piglets were further divided into cohorts for cortical laser-Doppler flow (LDF) measurements during induced hypotension or hypertension. We also tested whether indices derived from NIRS could identify the LDF-derived LLA. The LLA did not differ significantly among groups with sham surgery and hypothermia (29 ± 8 mmHg), sham surgery and rewarming (34 ± 7 mmHg), arrest and hypothermia (29 ± 10 mmHg), and arrest and rewarming (38 ± 11 mmHg). The LLA was not affected by arrest (P = 0.60), temperature (P = 0.08), or interaction between arrest and temperature (P = 0.73). The NIRS-derived indices detected the LLA accurately, with the area under the receiver-operator characteristic curves of 0.81-0.96 among groups. In groups subjected to arrest and hypothermia, with or without rewarming, the slope of LDF relative to cerebral perfusion pressure during hypertension was not significantly different from zero (P > 0.10). In conclusion, rewarming did not shift the LLA during hypotension or affect autoregulation during hypertension after asphyxic cardiac arrest. The NIRS-derived autoregulation indices identified the LLA accurately.
Keywords: cardiac arrest; cerebral blood flow; near-infrared spectroscopy; neonatal hypoxic-ischemic encephalopathy; pig.
Figures


Similar articles
-
Noninvasive autoregulation monitoring in a swine model of pediatric cardiac arrest.Anesth Analg. 2012 Apr;114(4):825-36. doi: 10.1213/ANE.0b013e31824762d5. Epub 2012 Feb 7. Anesth Analg. 2012. PMID: 22314692 Free PMC article.
-
Cerebral blood flow and cerebrovascular autoregulation in a swine model of pediatric cardiac arrest and hypothermia.Crit Care Med. 2011 Oct;39(10):2337-45. doi: 10.1097/CCM.0b013e318223b910. Crit Care Med. 2011. PMID: 21705904 Free PMC article.
-
Later cooling within 6 h and temperatures outside 33-34 °C are not associated with dysfunctional autoregulation during hypothermia for neonatal encephalopathy.Pediatr Res. 2021 Jan;89(1):223-230. doi: 10.1038/s41390-020-0876-8. Epub 2020 Apr 8. Pediatr Res. 2021. PMID: 32268341 Free PMC article.
-
Optimizing hemodynamic care in neonatal encephalopathy.Semin Fetal Neonatal Med. 2020 Oct;25(5):101139. doi: 10.1016/j.siny.2020.101139. Epub 2020 Jul 12. Semin Fetal Neonatal Med. 2020. PMID: 33223016 Review.
-
Hypothermia and perinatal asphyxia: executive summary of the National Institute of Child Health and Human Development workshop.J Pediatr. 2006 Feb;148(2):170-175. doi: 10.1016/j.jpeds.2005.12.009. J Pediatr. 2006. PMID: 16492424 No abstract available.
Cited by
-
Proteasome Biology Is Compromised in White Matter After Asphyxic Cardiac Arrest in Neonatal Piglets.J Am Heart Assoc. 2018 Oct 16;7(20):e009415. doi: 10.1161/JAHA.118.009415. J Am Heart Assoc. 2018. PMID: 30371275 Free PMC article.
-
The utility of therapeutic hypothermia on cerebral autoregulation.J Intensive Med. 2022 Oct 4;3(1):27-37. doi: 10.1016/j.jointm.2022.08.004. eCollection 2023 Jan 31. J Intensive Med. 2022. PMID: 36789361 Free PMC article. Review.
-
A pilot cohort study of cerebral autoregulation and 2-year neurodevelopmental outcomes in neonates with hypoxic-ischemic encephalopathy who received therapeutic hypothermia.BMC Neurol. 2015 Oct 20;15:209. doi: 10.1186/s12883-015-0464-4. BMC Neurol. 2015. PMID: 26486728 Free PMC article.
-
Regulation of the Cerebral Circulation During Development.Compr Physiol. 2021 Sep 23;11(4):2371-2432. doi: 10.1002/cphy.c200028. Compr Physiol. 2021. PMID: 34558670 Free PMC article.
-
The Utility of Cerebral Autoregulation Indices in Detecting Severe Brain Injury Varies by Cooling Treatment Phase in Neonates with Hypoxic-Ischemic Encephalopathy.Dev Neurosci. 2022;44(4-5):363-372. doi: 10.1159/000522314. Epub 2022 Jan 31. Dev Neurosci. 2022. PMID: 35100588 Free PMC article.
References
-
- Agnew DM, Koehler RC, Guerguerian AM, Shaffner DH, Traystman RJ, Martin LJ, Ichord RN. Hypothermia for 24 hours after asphyxic cardiac arrest in piglets provides striatal neuroprotection that is sustained 10 days after rewarming. Pediatr Res 54: 253–262, 2003 - PubMed
-
- Armstead WM, Kiessling JW, Kofke WA, Vavilala MS. Impaired cerebral blood flow autoregulation during posttraumatic arterial hypotension after fluid percussion brain injury is prevented by phenylephrine in female but exacerbated in male piglets by extracellular signal-related kinase mitogen-activated protein kinase upregulation. Crit Care Med 38: 1868–1874, 2010 - PMC - PubMed
-
- Bisschops LL, Hoedemaekers CW, Mollnes TE, van der Hoeven JG. Rewarming after hypothermia after cardiac arrest shifts the inflammatory balance. Crit Care Med 40: 1136–1142, 2012 - PubMed
-
- Brady KM, Lee JK, Kibler KK, Easley RB, Koehler RC, Czosnyka M, Smielewski P, Shaffner DH. The lower limit of cerebral blood flow autoregulation is increased with elevated intracranial pressure. Anesth Analg 108: 1278–1283, 2009 - PubMed
Publication types
MeSH terms
Grants and funding
LinkOut - more resources
Full Text Sources
Other Literature Sources