. 2013 Sep 4;14(9):18124-47.
doi: 10.3390/ijms140918124.

Pattern-recognition receptor signaling regulator mRNA expression in humans and mice, and in transient inflammation or progressive fibrosis

Affiliations

Pattern-recognition receptor signaling regulator mRNA expression in humans and mice, and in transient inflammation or progressive fibrosis

Roman Günthner et al. Int J Mol Sci. .

Abstract

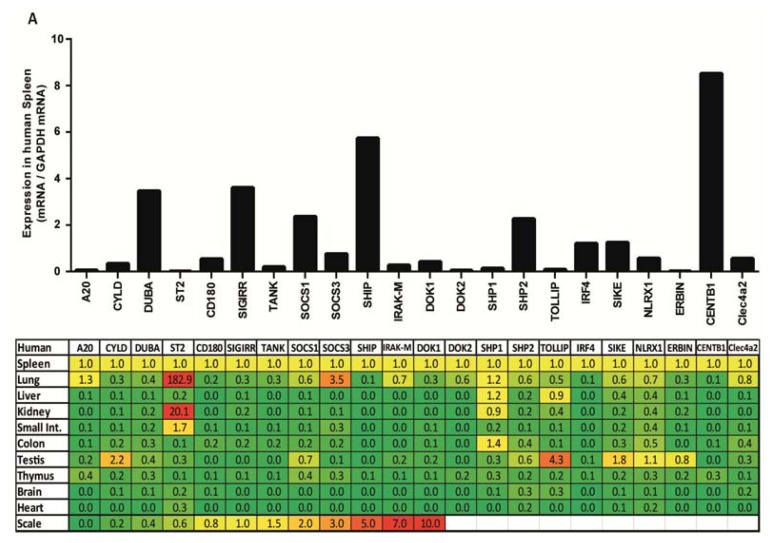
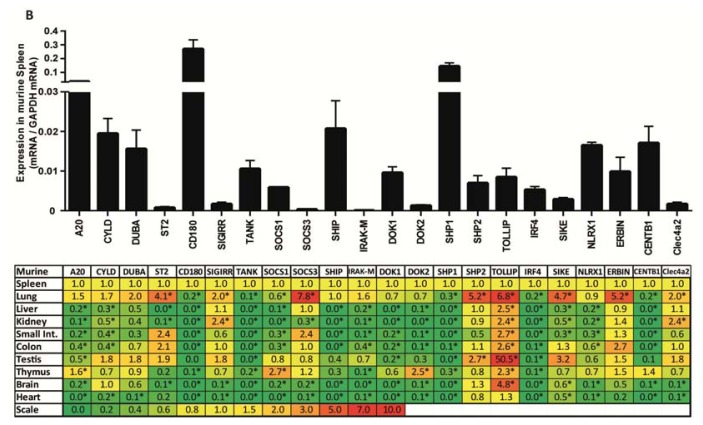
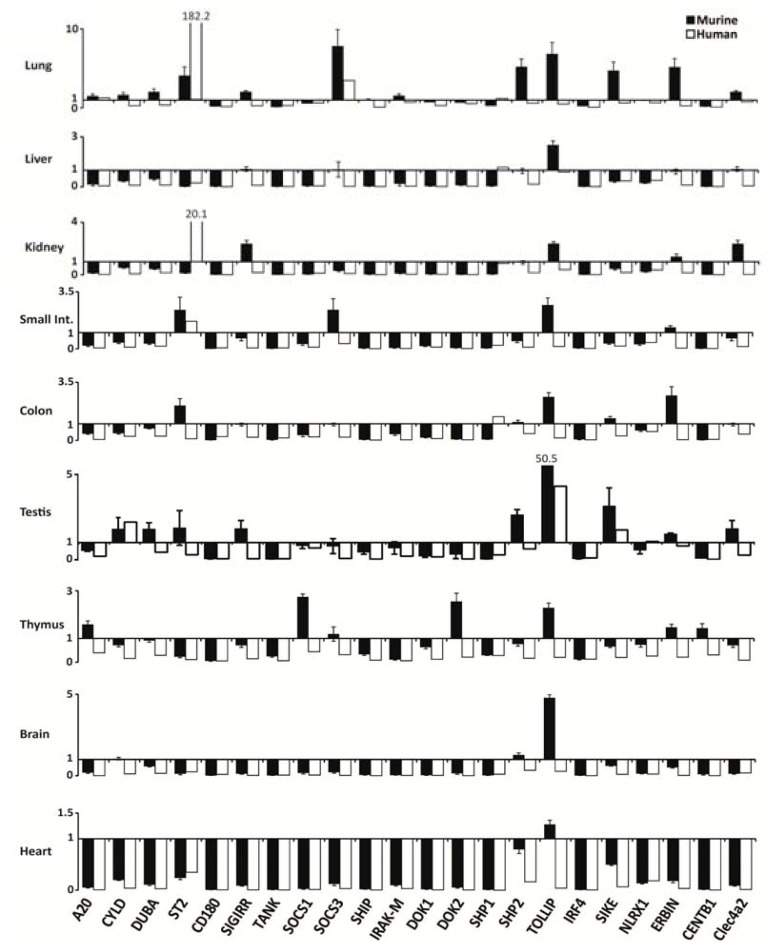
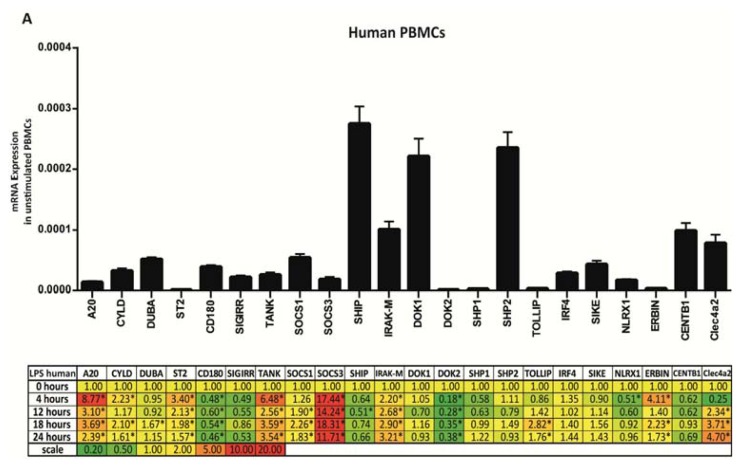
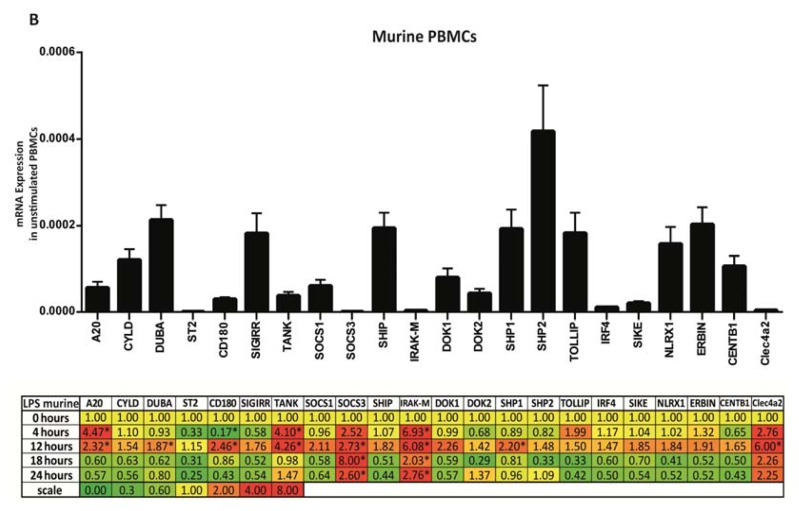
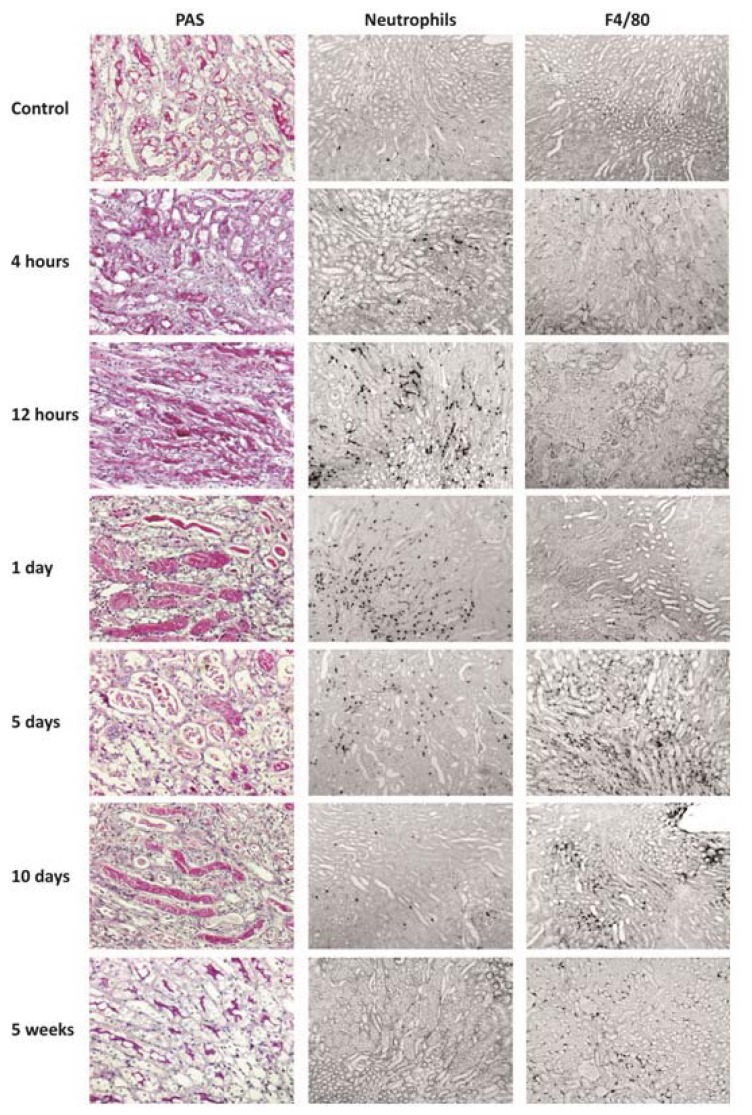
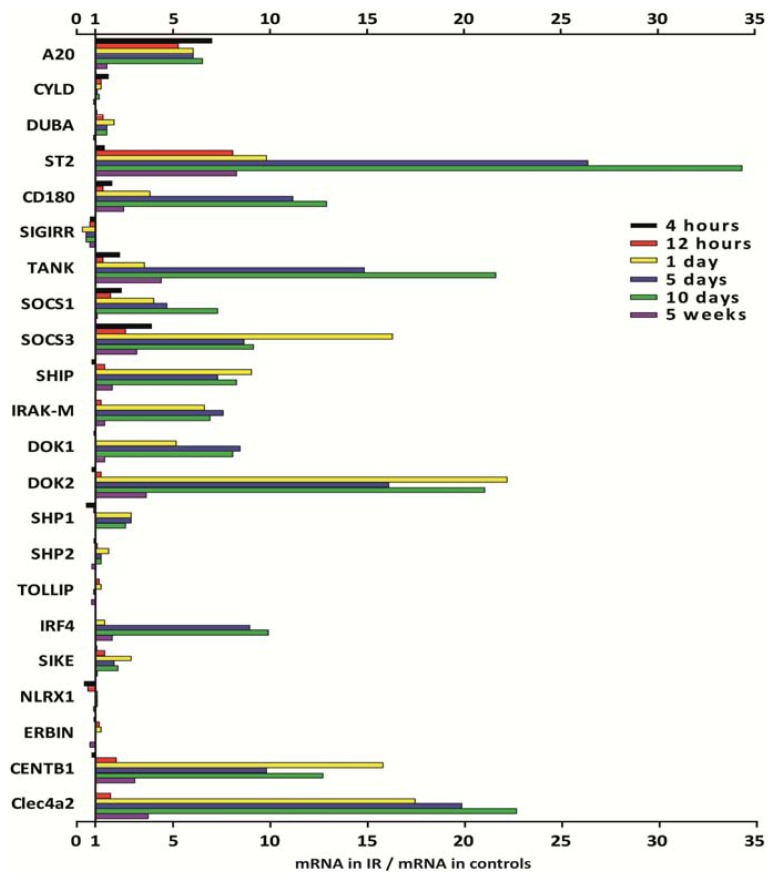
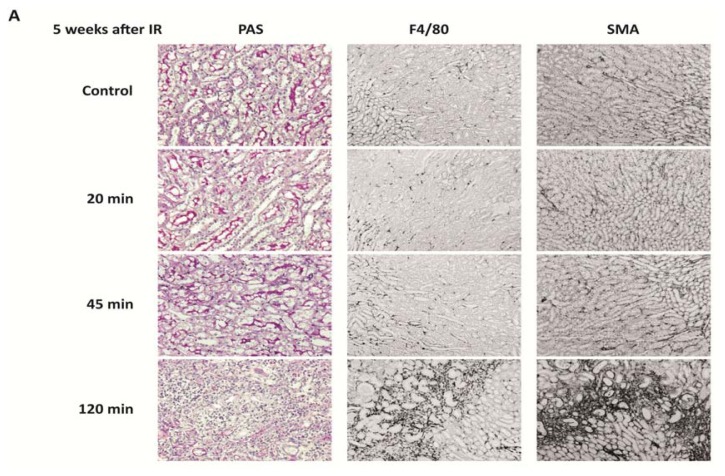
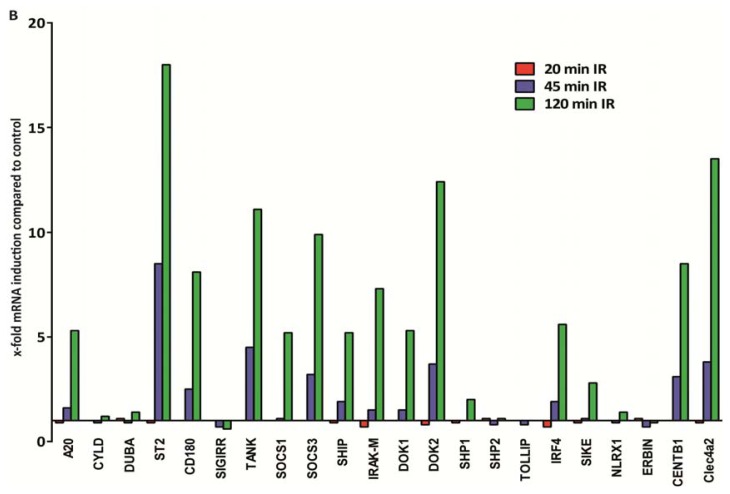
The cell type-, organ-, and species-specific expression of the pattern-recognition receptors (PRRs) are well described but little is known about the respective expression profiles of their negative regulators. We therefore determined the mRNA expression levels of A20, CYLD, DUBA, ST2, CD180, SIGIRR, TANK, SOCS1, SOCS3, SHIP, IRAK-M, DOK1, DOK2, SHP1, SHP2, TOLLIP, IRF4, SIKE, NLRX1, ERBIN, CENTB1, and Clec4a2 in human and mouse solid organs. Humans and mice displayed significant differences between their respective mRNA expression patterns of these factors. Additionally, we characterized their expression profiles in mononuclear blood cells upon bacterial endotoxin, which showed a consistent induction of A20, SOCS3, IRAK-M, and Clec4a2 in human and murine cells. Furthermore, we studied the expression pattern in transient kidney ischemia-reperfusion injury versus post-ischemic atrophy and fibrosis in mice. A20, CD180, ST2, SOCS1, SOCS3, SHIP, IRAK-M, DOK1, DOK2, IRF4, CENTB1, and Clec4a2 were all induced, albeit at different times of injury and repair. Progressive fibrosis was associated with a persistent induction of these factors. Thus, the organ- and species-specific expression patterns need to be considered in the design and interpretation of studies related to PRR-mediated innate immunity, which seems to be involved in tissue injury, tissue regeneration and in progressive tissue scarring.


Figures

Figure 1
Figure 1
Pattern-recognition receptor (PRR) negative regulators mRNA expression in adult human and mouse tissues. (A) Basal mRNA expression of negative regulators in human tissues. Quantitative real-time PCR analysis of pre-normalized cDNA derived from poly-(A)-selected DNase-treated RNA isolated from 10 several tissues was performed as described in experimental section. mRNA expression levels were calculated using human Glyceraldehyd-3-Phosphat-Dehydrogenase (GAPDH) as a housekeeping gene. Spleen was chosen as a reference organ. Spleen mRNA expression levels are shown in the upper graph. Expression of the genes in other human organs is indicated in the table as x-fold induction (or suppression) compared to expression in spleen. Yellow shades illustrate similar, red colors increased and green colors decreased mRNA levels; (B) Basal mRNA expression of negative regulators in murine tissues. Quantitative real-time PCR analysis of cDNA derived from RNA isolated from 10 several murine (C57BL/6) tissues was performed as described in experimental section. Detected mRNA expression levels were calculated using murine Glyceraldehyd-3-Phosphat-Dehydrogenase (GAPDH) as a housekeeping gene; spleen mRNA expression levels are illustrated in the upper graph; error bars represent SEM. Expression of the genes in other murine organs is indicated in the table as x-fold induction (or suppression) compared to expression in spleen. Yellow shades illustrate similar, red colors increased and green colors decreased mRNA levels.
Figure 1
Figure 1
Pattern-recognition receptor (PRR) negative regulators mRNA expression in adult human and mouse tissues. (A) Basal mRNA expression of negative regulators in human tissues. Quantitative real-time PCR analysis of pre-normalized cDNA derived from poly-(A)-selected DNase-treated RNA isolated from 10 several tissues was performed as described in experimental section. mRNA expression levels were calculated using human Glyceraldehyd-3-Phosphat-Dehydrogenase (GAPDH) as a housekeeping gene. Spleen was chosen as a reference organ. Spleen mRNA expression levels are shown in the upper graph. Expression of the genes in other human organs is indicated in the table as x-fold induction (or suppression) compared to expression in spleen. Yellow shades illustrate similar, red colors increased and green colors decreased mRNA levels; (B) Basal mRNA expression of negative regulators in murine tissues. Quantitative real-time PCR analysis of cDNA derived from RNA isolated from 10 several murine (C57BL/6) tissues was performed as described in experimental section. Detected mRNA expression levels were calculated using murine Glyceraldehyd-3-Phosphat-Dehydrogenase (GAPDH) as a housekeeping gene; spleen mRNA expression levels are illustrated in the upper graph; error bars represent SEM. Expression of the genes in other murine organs is indicated in the table as x-fold induction (or suppression) compared to expression in spleen. Yellow shades illustrate similar, red colors increased and green colors decreased mRNA levels.
Figure 2
Figure 2
Interspecies comparison of relative expression of PRR negative regulators in different organs compared to spleen. The respective relative murine (black bars) and human (open bars) PRR negative regulators mRNA levels from Figure 1A and 1B are illustrated to directly compare expression between mice and humans. The y-axis marks the fold-change in each direction, whereas x-axis marks the different genes used in the analysis. Note that the scale of the y-axis is different for each organ. Data represent means ± SEM.
Figure 3
Figure 3
Expression levels of peripheral blood mononuclear cells (PBMCs) stimulated with LPS. (A) mRNA expression in human PBMCs; (B) mRNA expression in murine PBMCs. PBMCs were isolated from humans/mice and stimulated with 500 ng/mL LPS for 4, 12, 18 and 24 h as described in experimental section. Histograms show the basal expression in PBS treated controls. 18S served as a housekeeping gene in both, humans and mice to remain comparability. Expression of the genes at chosen time points is indicated in the table as x-fold induction (or suppression) compared to controls. Yellow shades illustrate similar, red colors increased and green colors decreased mRNA levels.
Figure 3
Figure 3
Expression levels of peripheral blood mononuclear cells (PBMCs) stimulated with LPS. (A) mRNA expression in human PBMCs; (B) mRNA expression in murine PBMCs. PBMCs were isolated from humans/mice and stimulated with 500 ng/mL LPS for 4, 12, 18 and 24 h as described in experimental section. Histograms show the basal expression in PBS treated controls. 18S served as a housekeeping gene in both, humans and mice to remain comparability. Expression of the genes at chosen time points is indicated in the table as x-fold induction (or suppression) compared to controls. Yellow shades illustrate similar, red colors increased and green colors decreased mRNA levels.
Figure 4
Figure 4
Tissue histology upon kidney ischemia-reperfusion. Renal ischemia-reperfusion injury was induced as described in experimental section. Representative images of renal sections stained with PAS, Neutrophil staining for neutrophils or F4/80 for macrophages are shown at 6 time points. Original magnification: 200× for PAS and 100× for neutrophils and F4/80.
Figure 5
Figure 5
PRR negative regulators mRNA expression in the kidney undergoing ischemia-reperfusion injury. Renal ischemia-reperfusion injury was induced by clamping the renal artery for 45 min and organs were harvested after 6 different timepoints as described in experimental section. RNA was isolated from injured kidneys or contralateral controls and transcribed into cDNA. qRT-PCR was performed and mRNA expression was determined using 18S as a housekeeping gene. Expression levels are illustrated in the bar graph as x-fold induction compared to contralateral kidneys, which served as controls.
Figure 6
Figure 6
Histology and PRR negative regulators mRNA expression in kidneys upon different ischemia times. (A) Renal ischemia-reperfusion injury was induced by clamping the renal artery for 20, 45 and 120 min and organs were harvested after five weeks as described in experimental section. Representative images of renal sections were stained with PAS, F4/80 as a macrophage marker and SMA as a fibrosis marker. Original magnification: ×200 for PAS and 100× for F4/80 and SMA; (B) RNA was isolated from injured kidneys or contralateral controls, transcribed into cDNA and qRT-PCR was performed. 18S served as a housekeeping gene. Induction of negative regulators five weeks after IRI is shown as x-fold induction compared to contralateral kidneys.
Figure 6
Figure 6
Histology and PRR negative regulators mRNA expression in kidneys upon different ischemia times. (A) Renal ischemia-reperfusion injury was induced by clamping the renal artery for 20, 45 and 120 min and organs were harvested after five weeks as described in experimental section. Representative images of renal sections were stained with PAS, F4/80 as a macrophage marker and SMA as a fibrosis marker. Original magnification: ×200 for PAS and 100× for F4/80 and SMA; (B) RNA was isolated from injured kidneys or contralateral controls, transcribed into cDNA and qRT-PCR was performed. 18S served as a housekeeping gene. Induction of negative regulators five weeks after IRI is shown as x-fold induction compared to contralateral kidneys.

Similar articles

Cited by

References

    1. Takeuchi O., Akira S. Pattern recognition receptors and inflammation. Cell. 2010;140:805–820. - PubMed
    1. Ramaiah S.K., Gunthner R., Lech M., Anders H.J. Toll-like receptor and accessory molecule mRNA expression in humans and mice as well as in murine autoimmunity, transient inflammation, and progressive fibrosis. Int. J. Mol. Sci. 2013;14:13213–13230. - PMC - PubMed
    1. Germain R.N. Maintaining system homeostasis: The third law of Newtonian immunology. Nat. Immunol. 2012;13:902–906. - PMC - PubMed
    1. Murray P.J., Smale S.T. Restraint of inflammatory signaling by interdependent strata of negative regulatory pathways. Nat. Immunol. 2012;13:916–924. - PMC - PubMed
    1. Stearns-Kurosawa D.J., Osuchowski M.F., Valentine C., Kurosawa S., Remick D.G. The pathogenesis of sepsis. Annu. Rev. Pathol. 2011;6:19–48. - PMC - PubMed

Publication types

LinkOut - more resources